Gene: CELA3A
chr1: 22328148-22339015Expression Profile
(log scale)
Graphical Connections
Distribution of linked clusters:
You may find it interesting if many of the connected DHS sites belong to the same cluster.| Cluster Profile | Cluster ID | Number of DHS sites in this cluster |
|---|---|---|
 | 934 | 5 |
 | 935 | 4 |
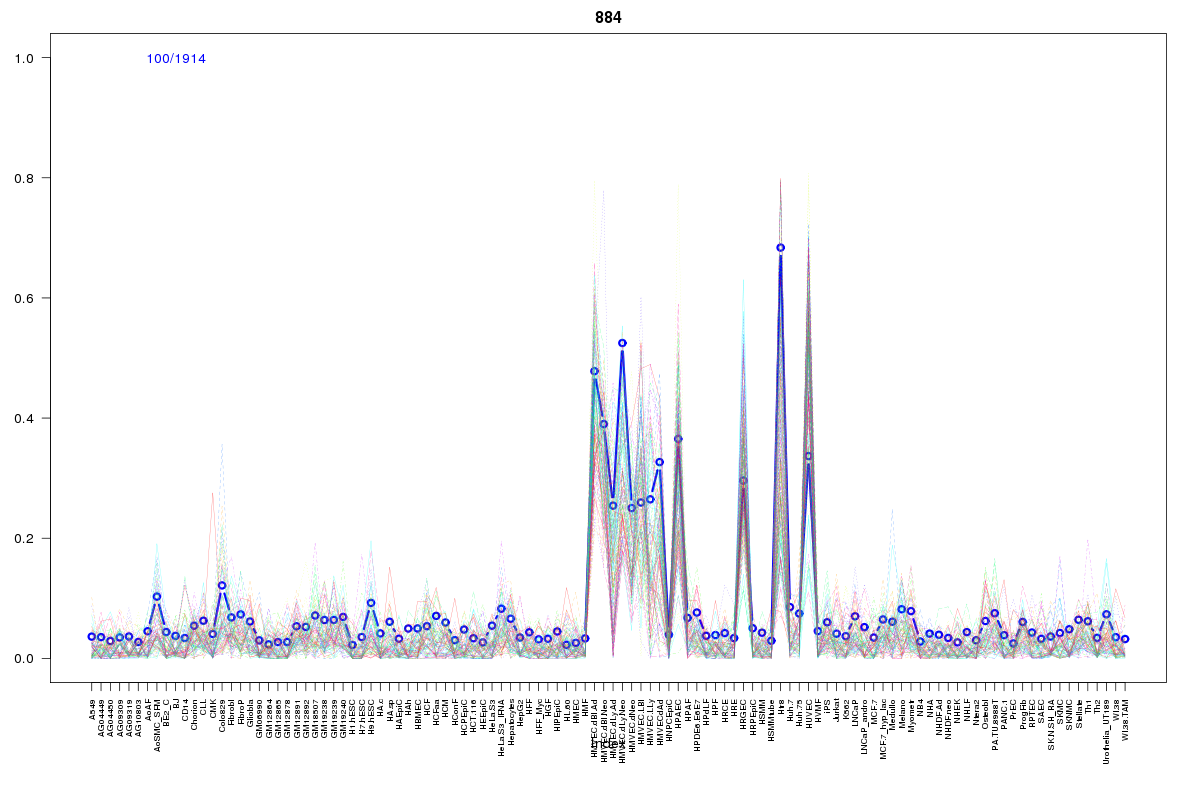 | 884 | 4 |
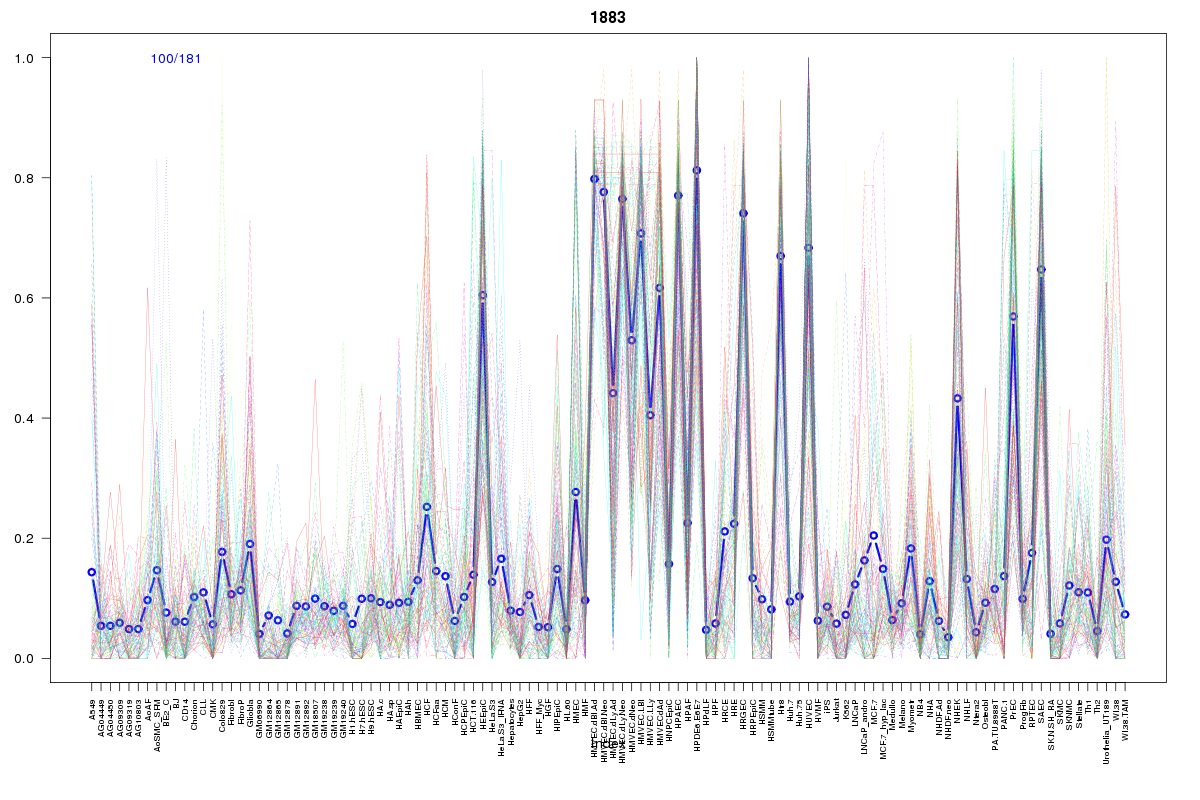 | 1883 | 2 |
 | 502 | 2 |
 | 569 | 2 |
 | 979 | 2 |
 | 739 | 2 |
 | 1605 | 1 |
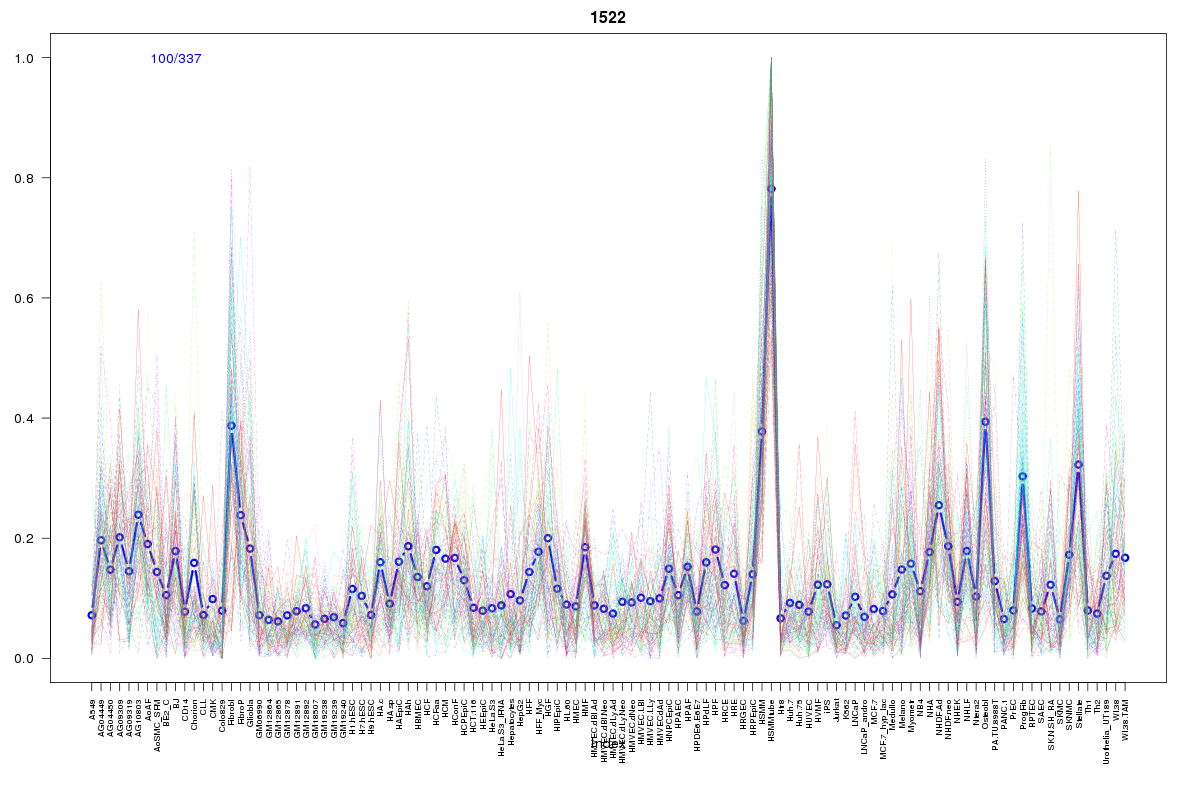 | 1522 | 1 |
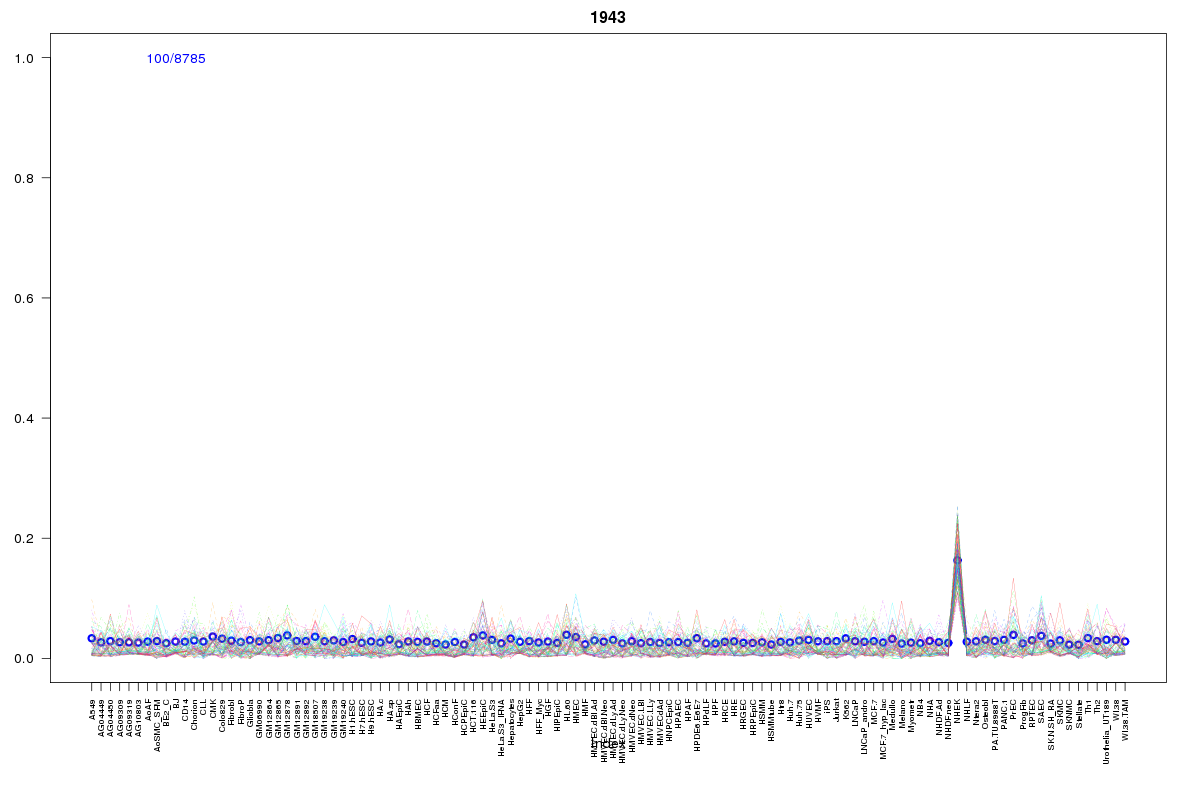 | 1943 | 1 |
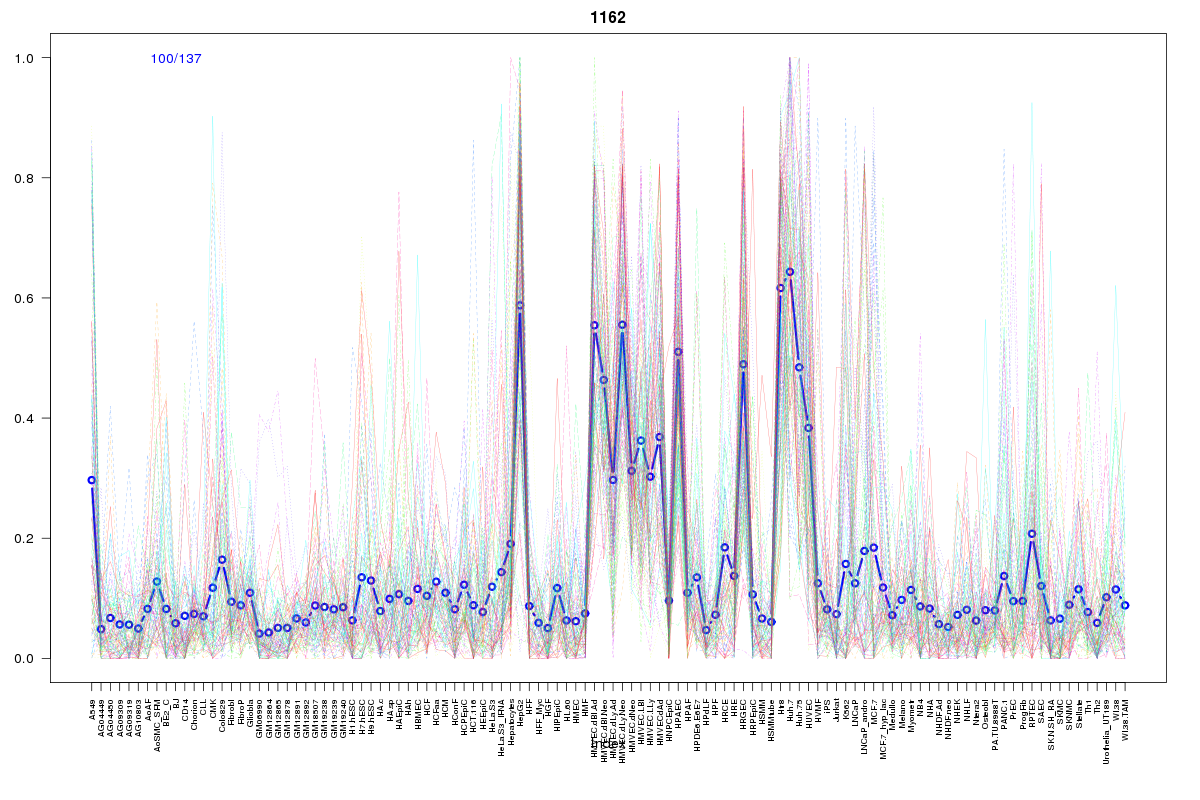 | 1162 | 1 |
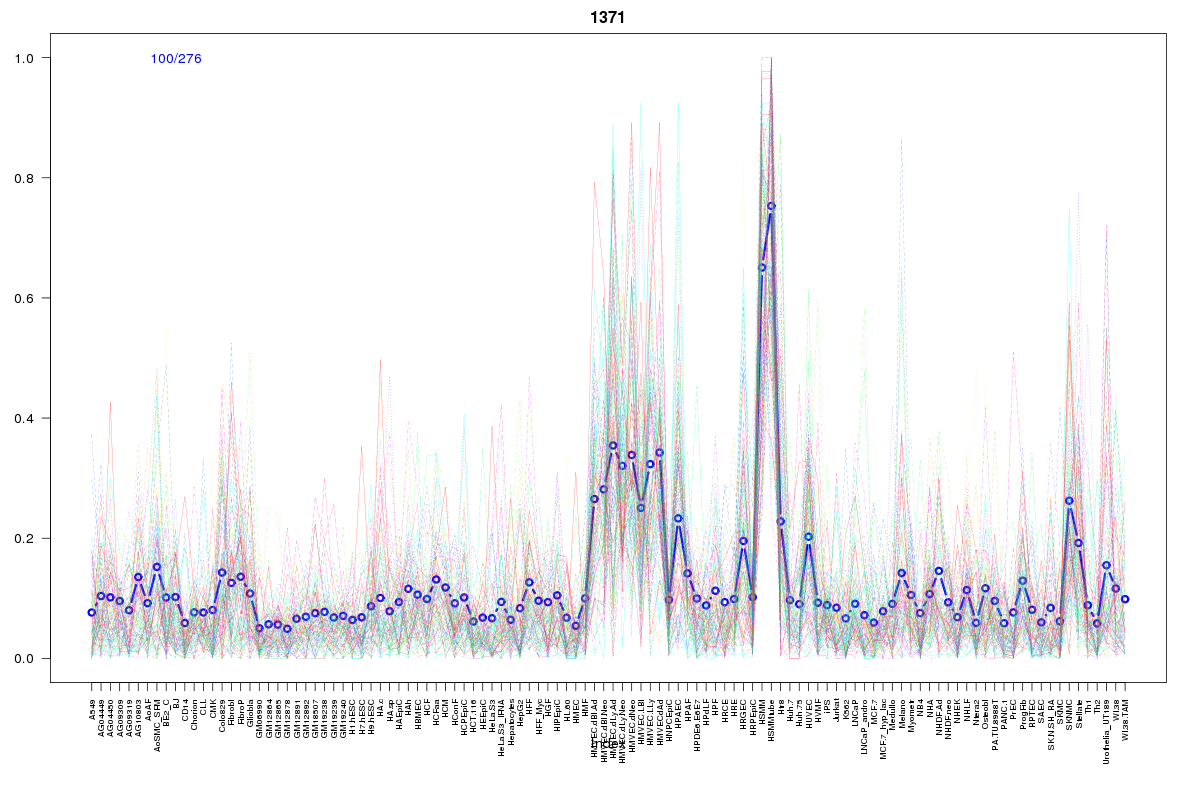 | 1371 | 1 |
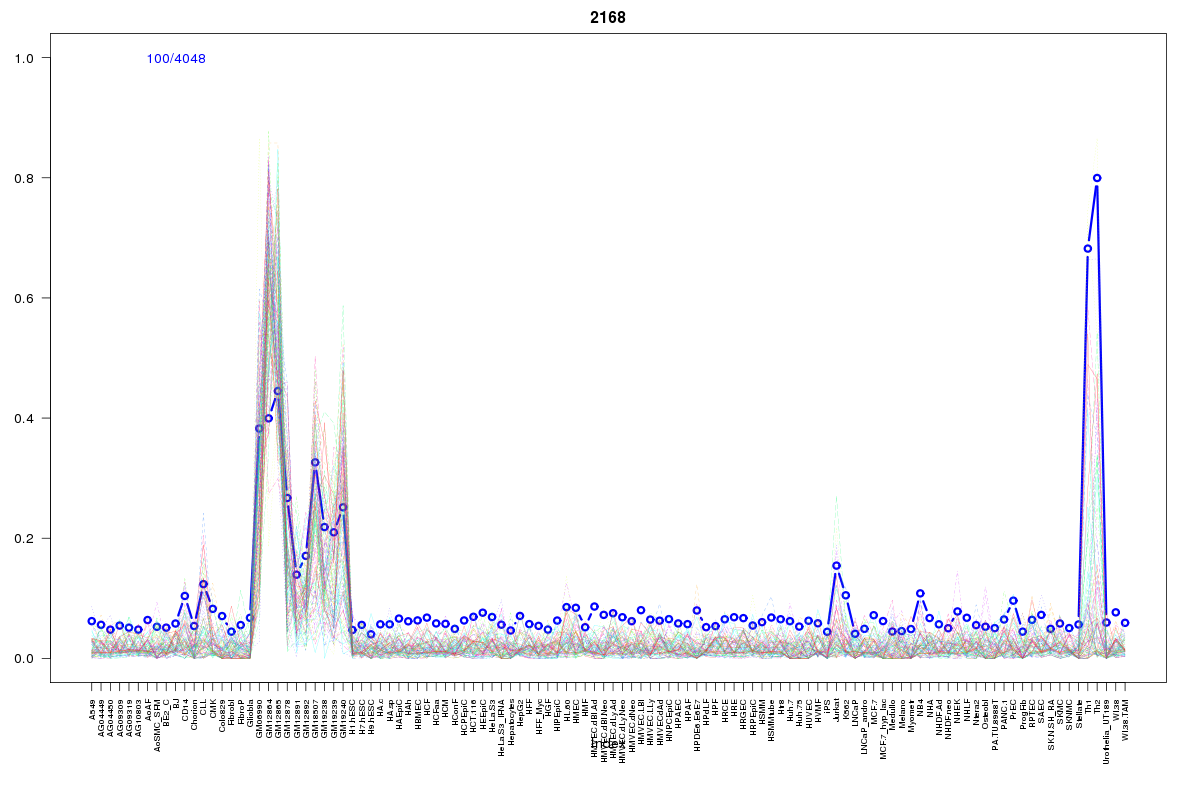 | 2168 | 1 |
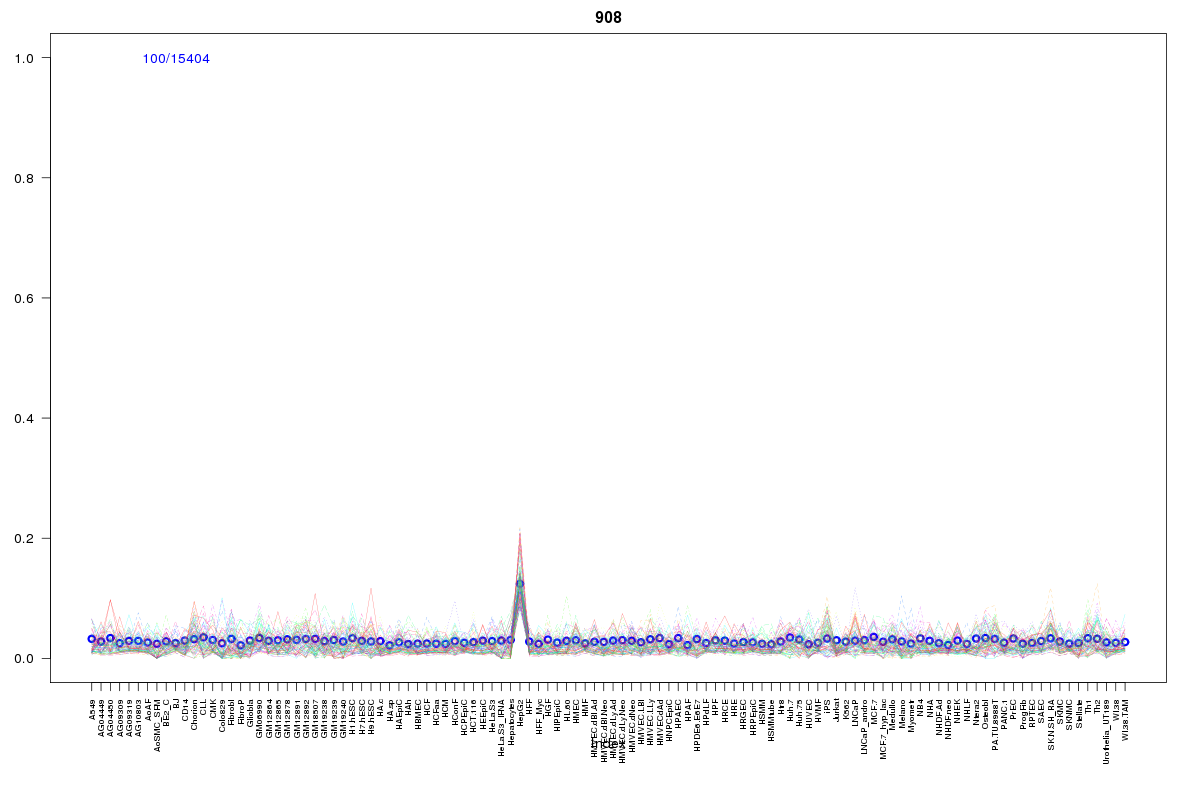 | 908 | 1 |
 | 15 | 1 |
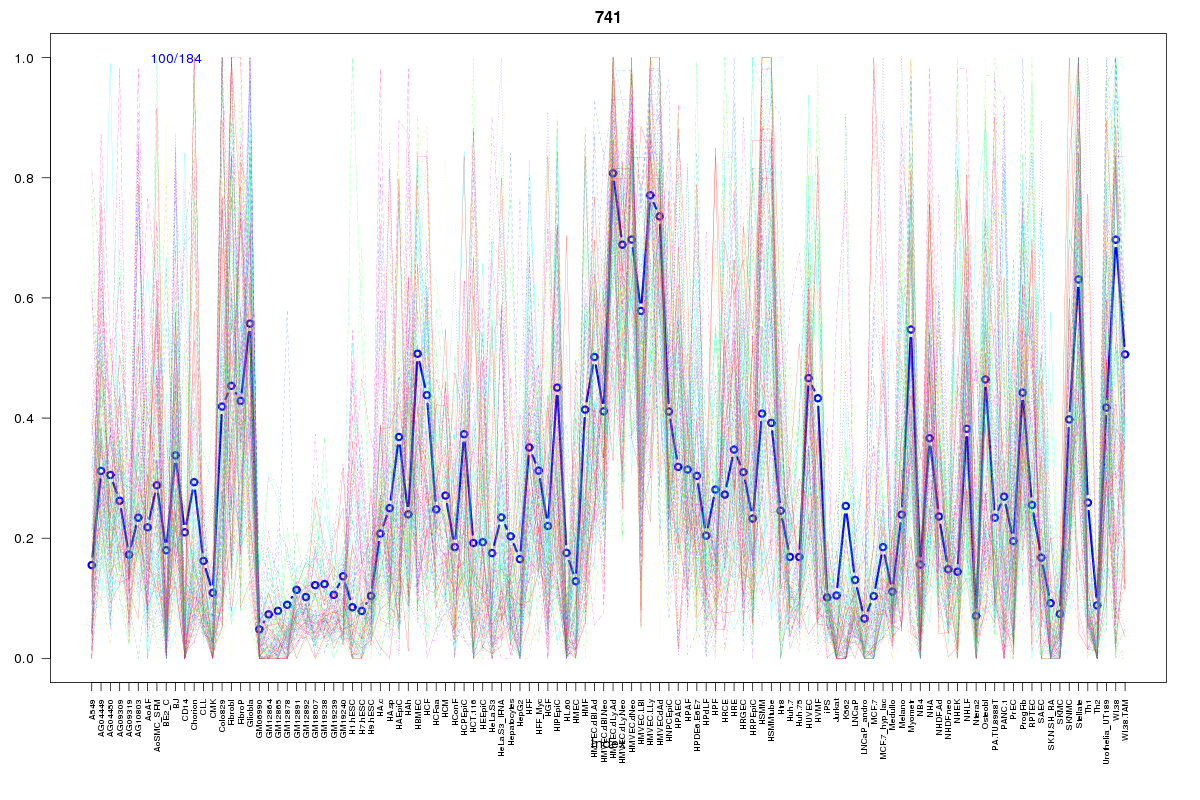 | 741 | 1 |
 | 130 | 1 |
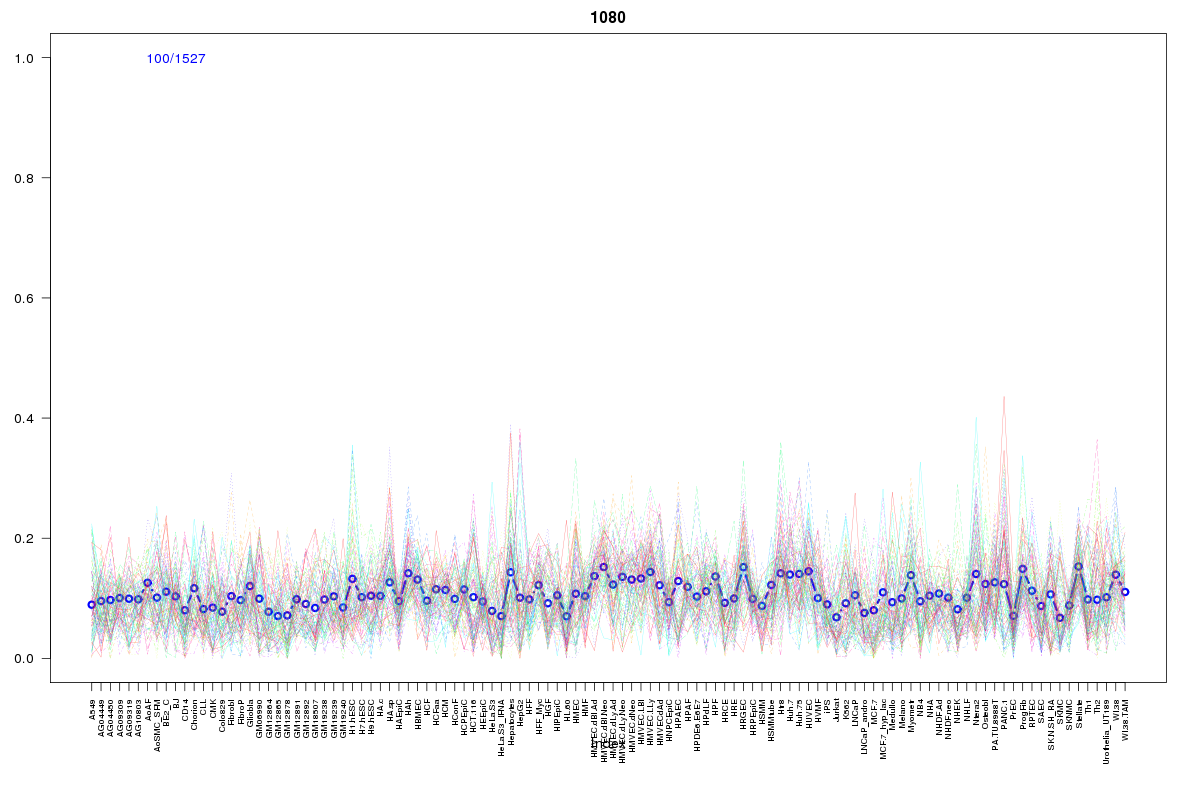 | 1080 | 1 |
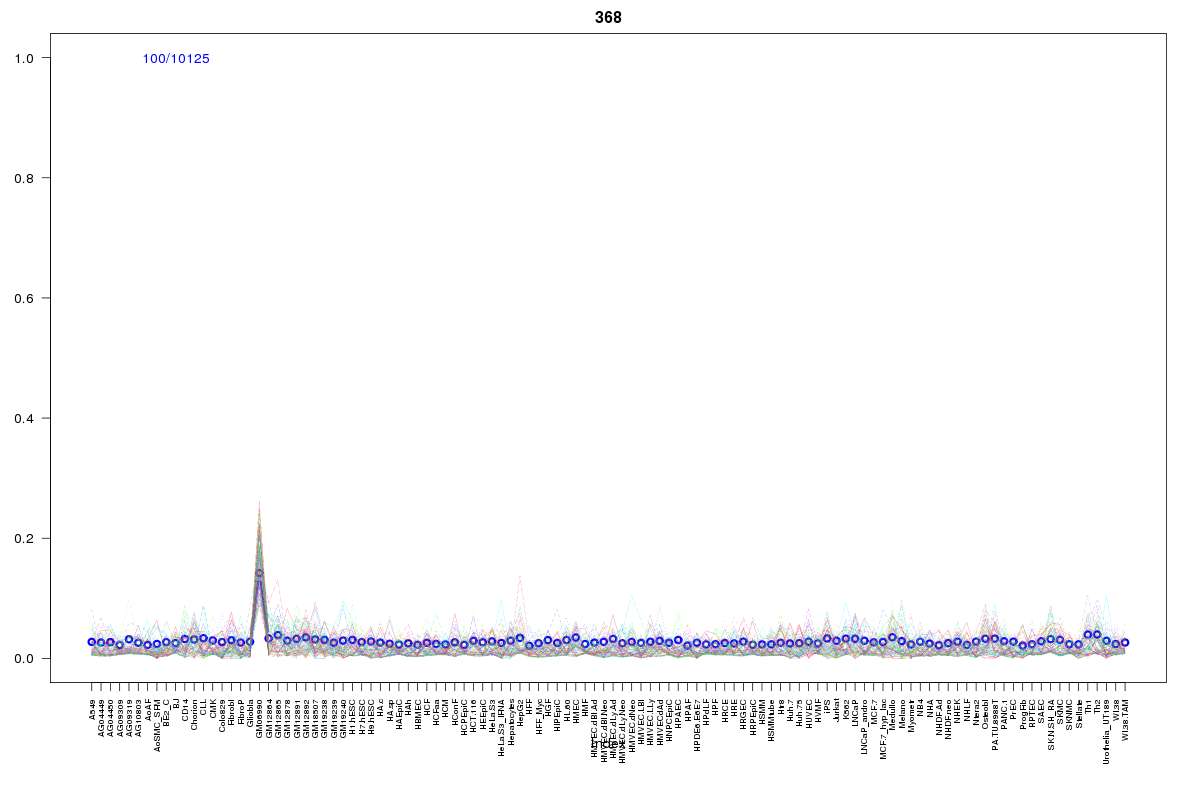 | 368 | 1 |
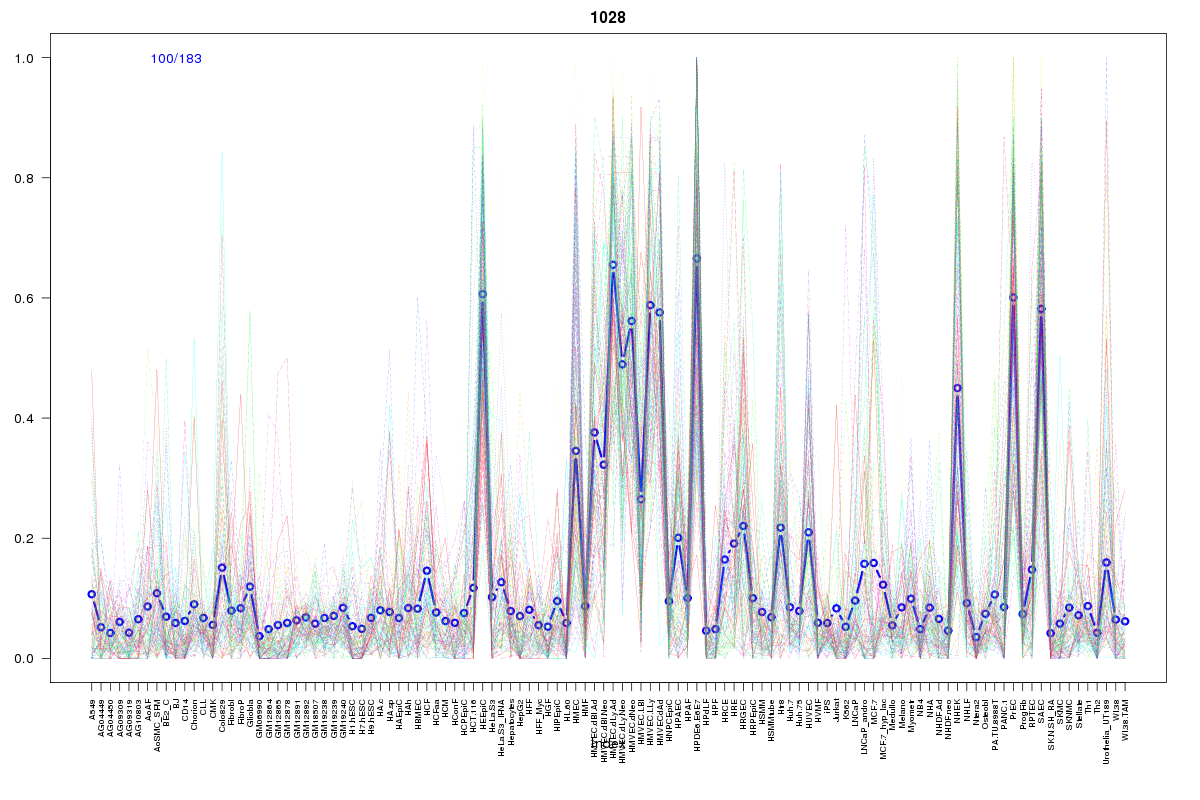 | 1028 | 1 |
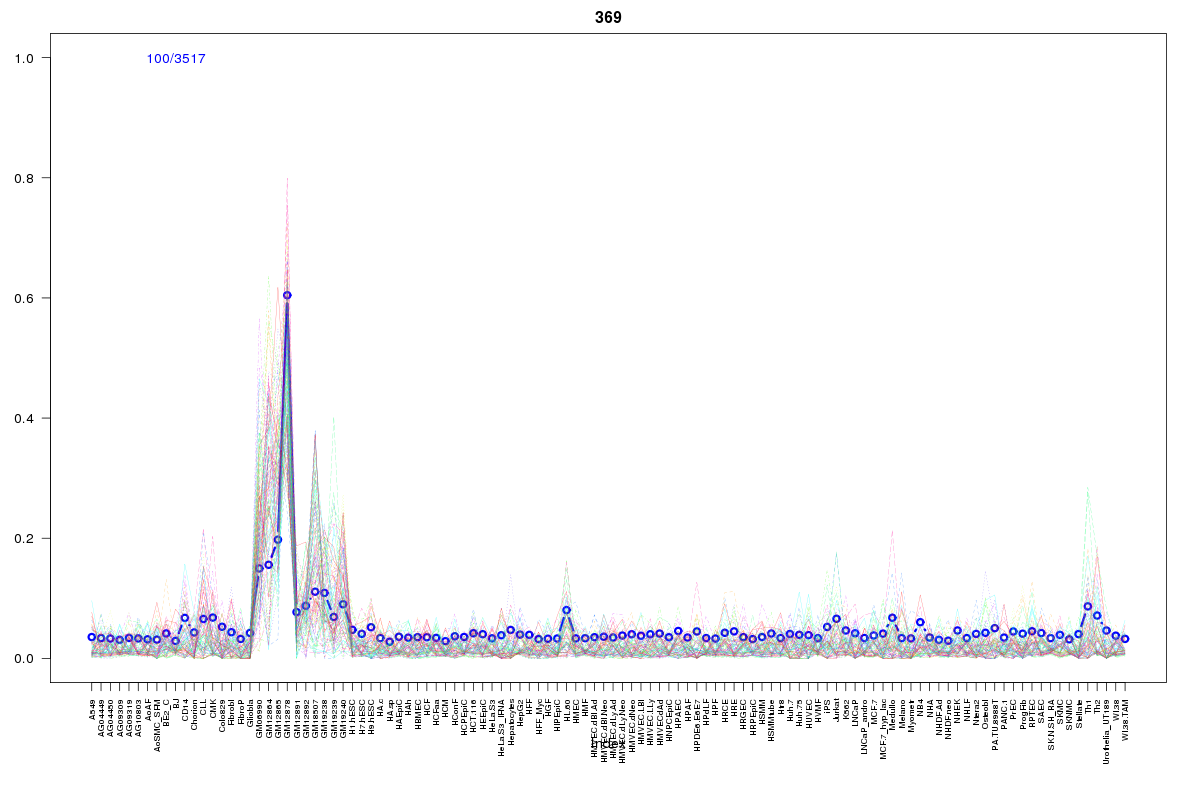 | 369 | 1 |
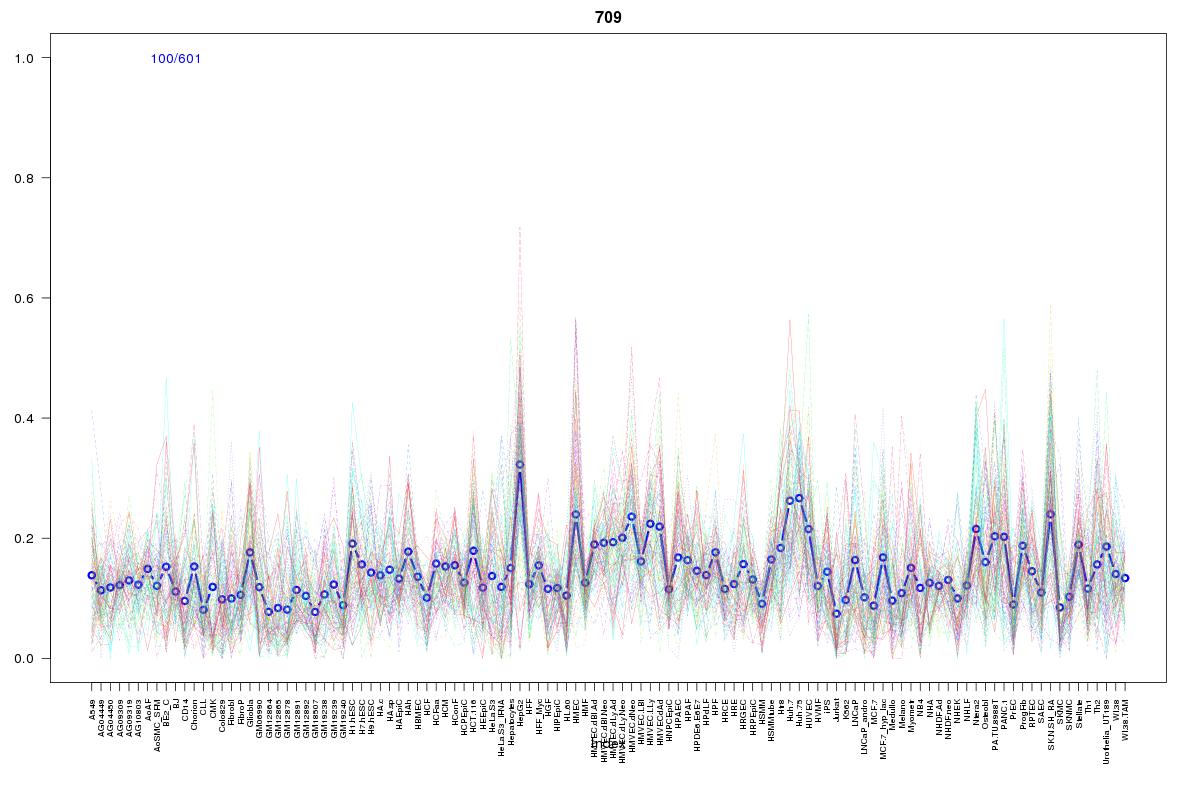 | 709 | 1 |
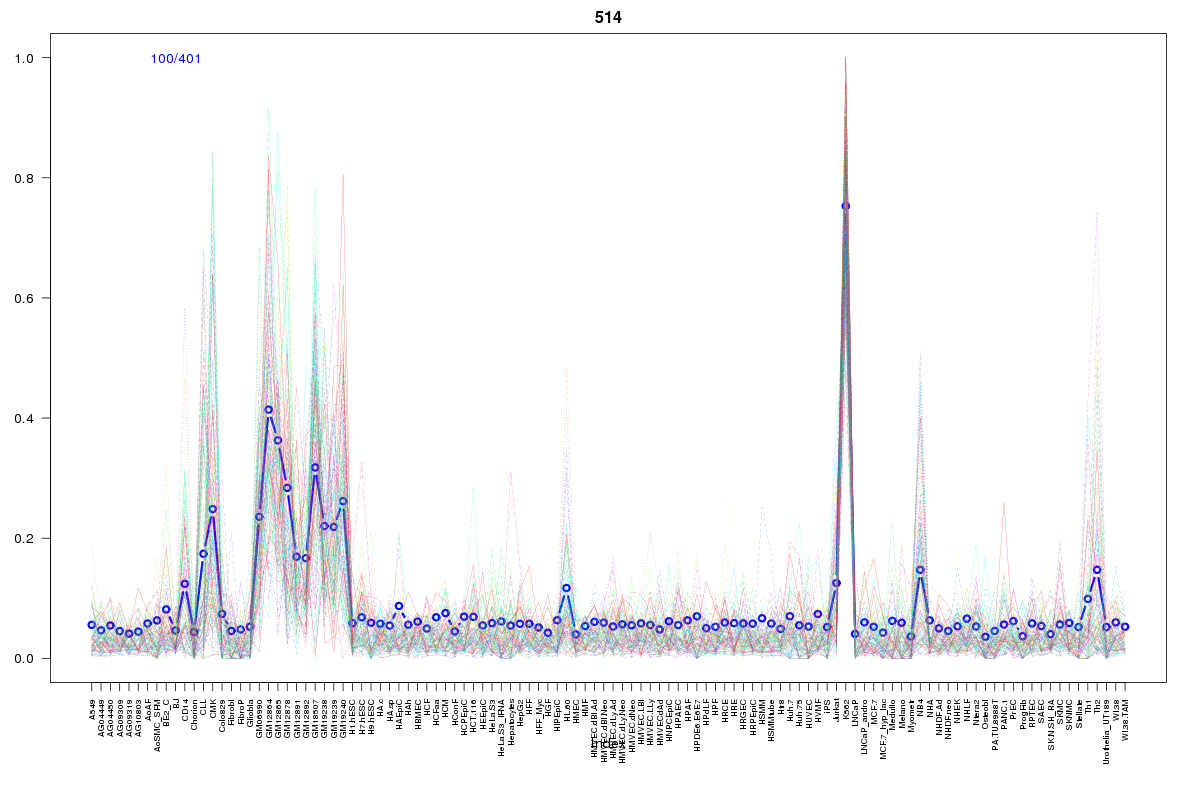 | 514 | 1 |
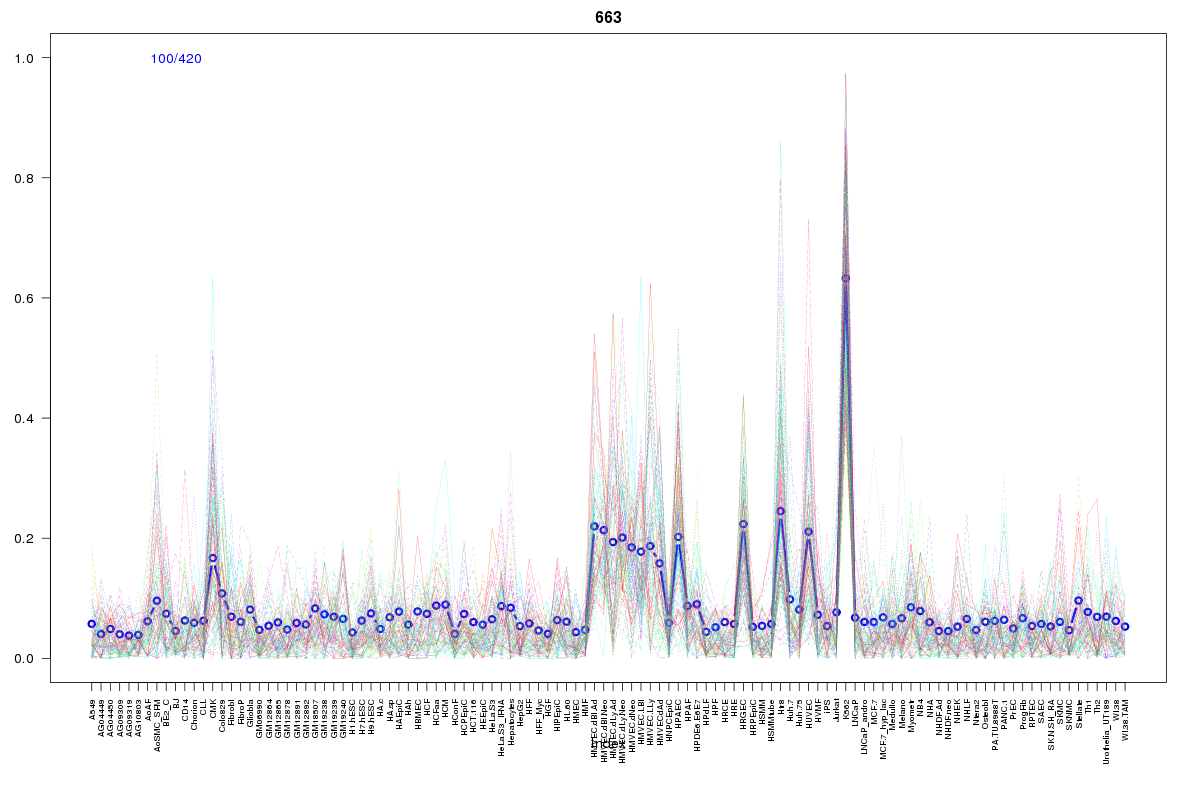 | 663 | 1 |
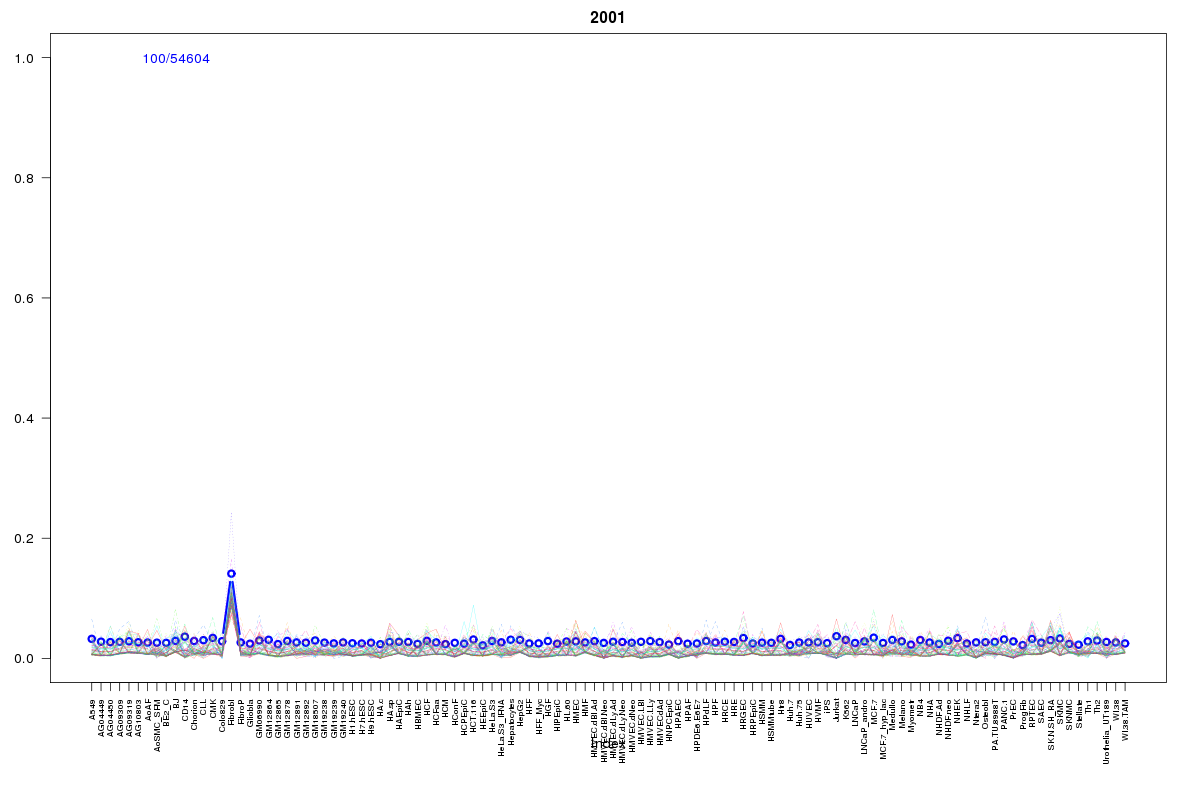 | 2001 | 1 |
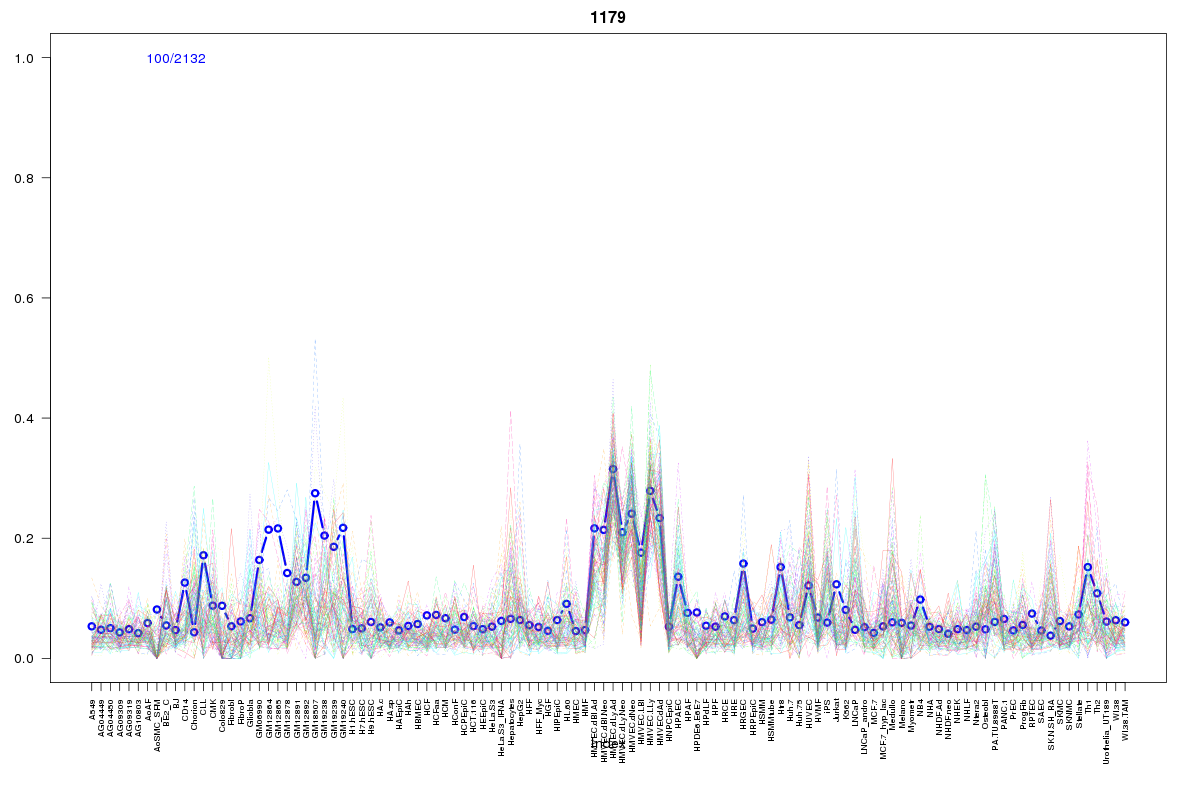 | 1179 | 1 |
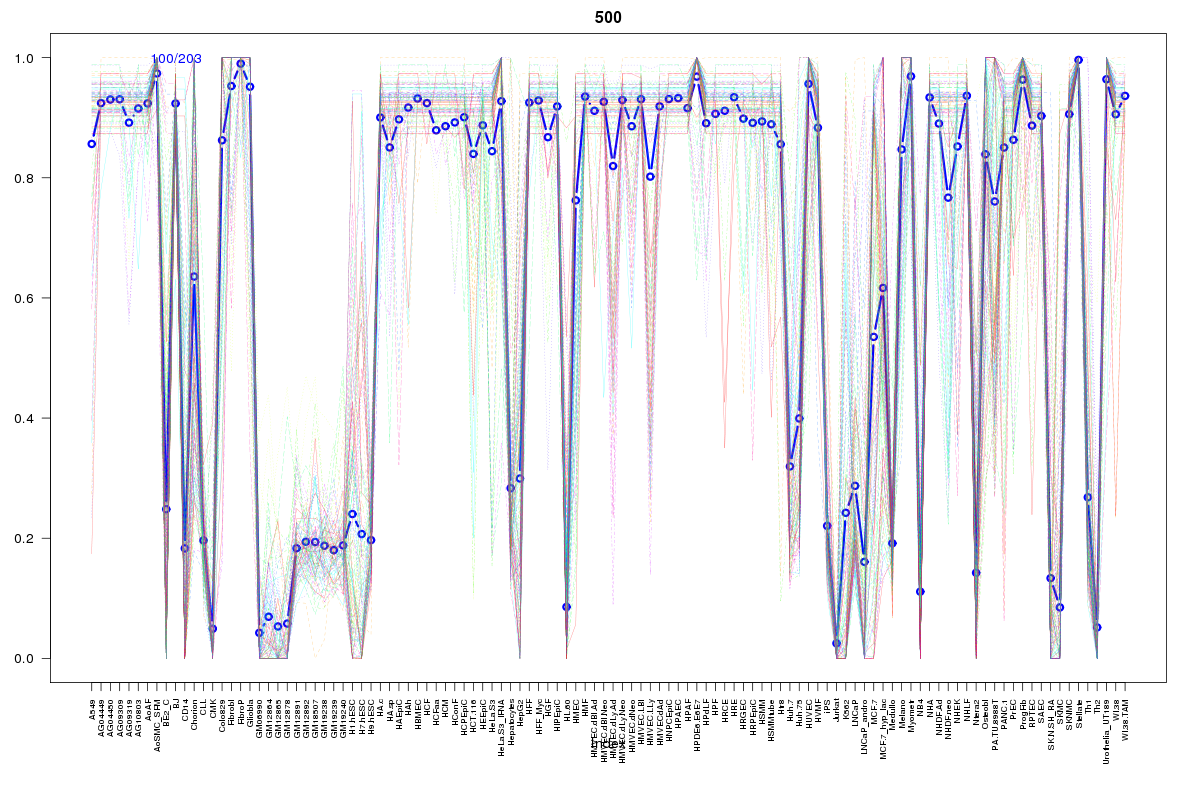 | 500 | 1 |
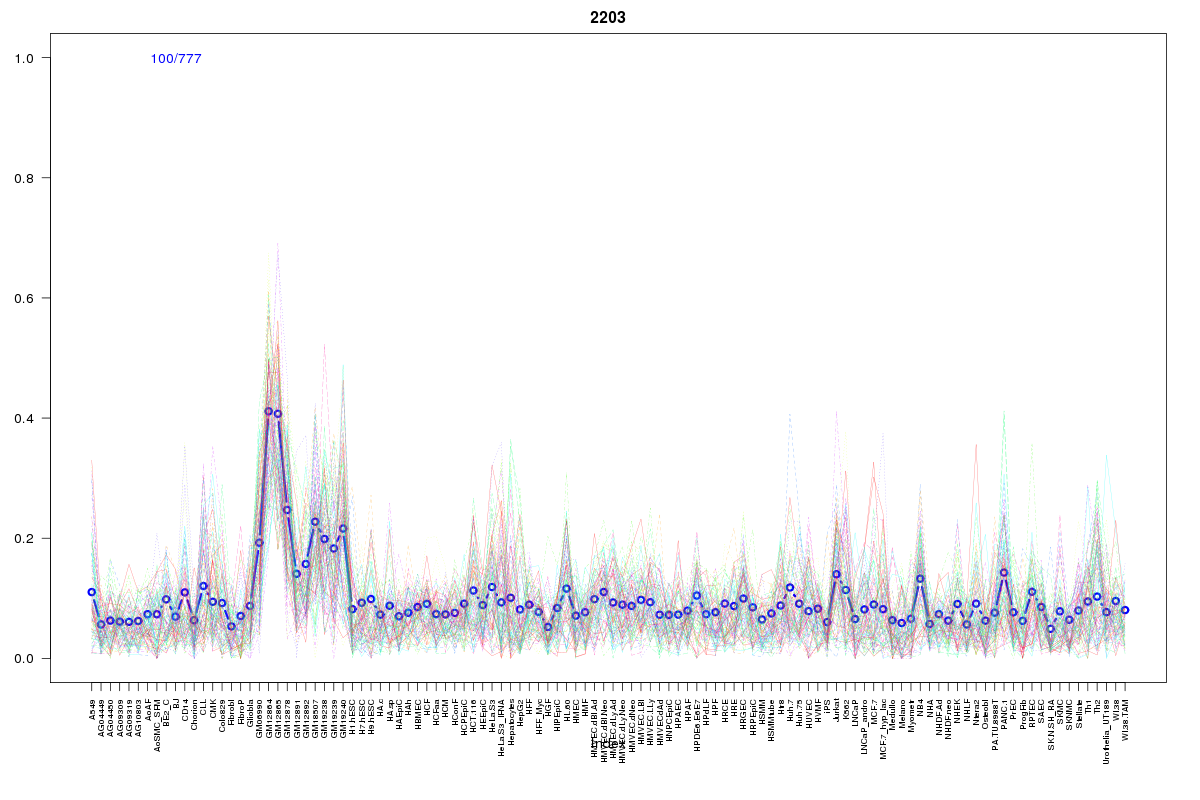 | 2203 | 1 |
 | 687 | 1 |
 | 2072 | 1 |
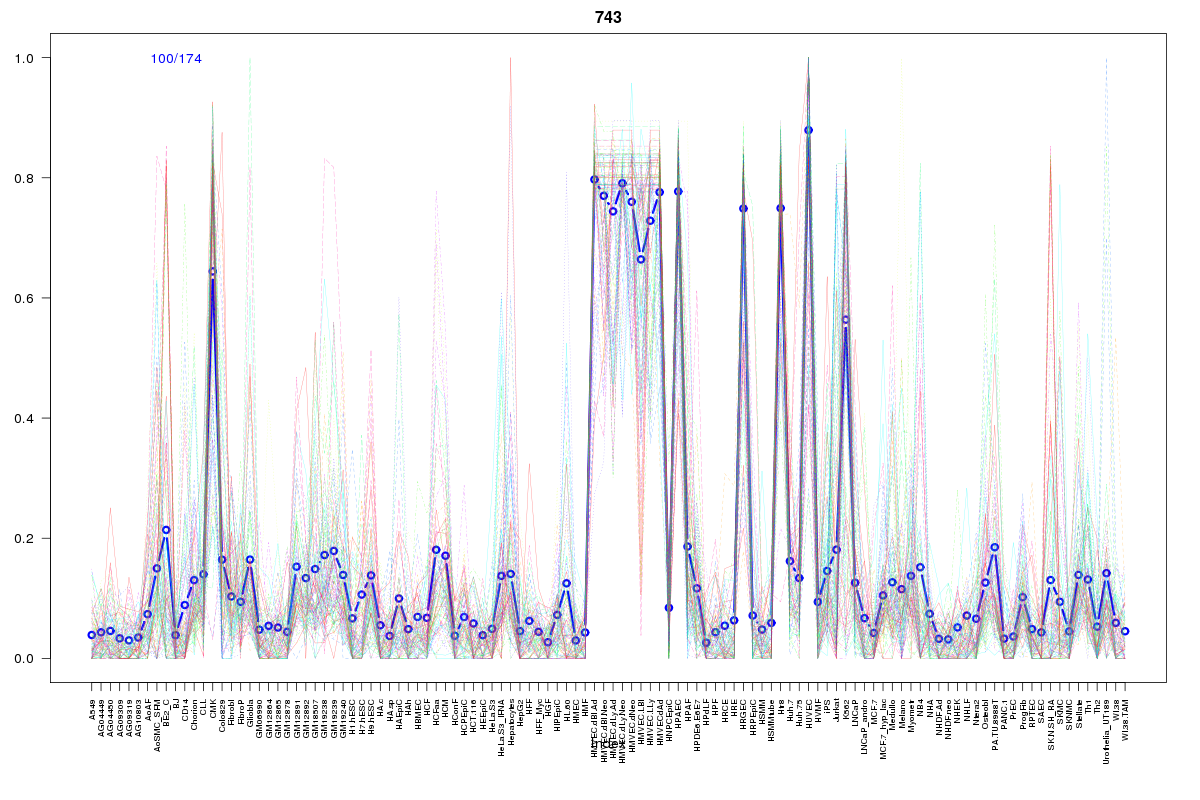 | 743 | 1 |
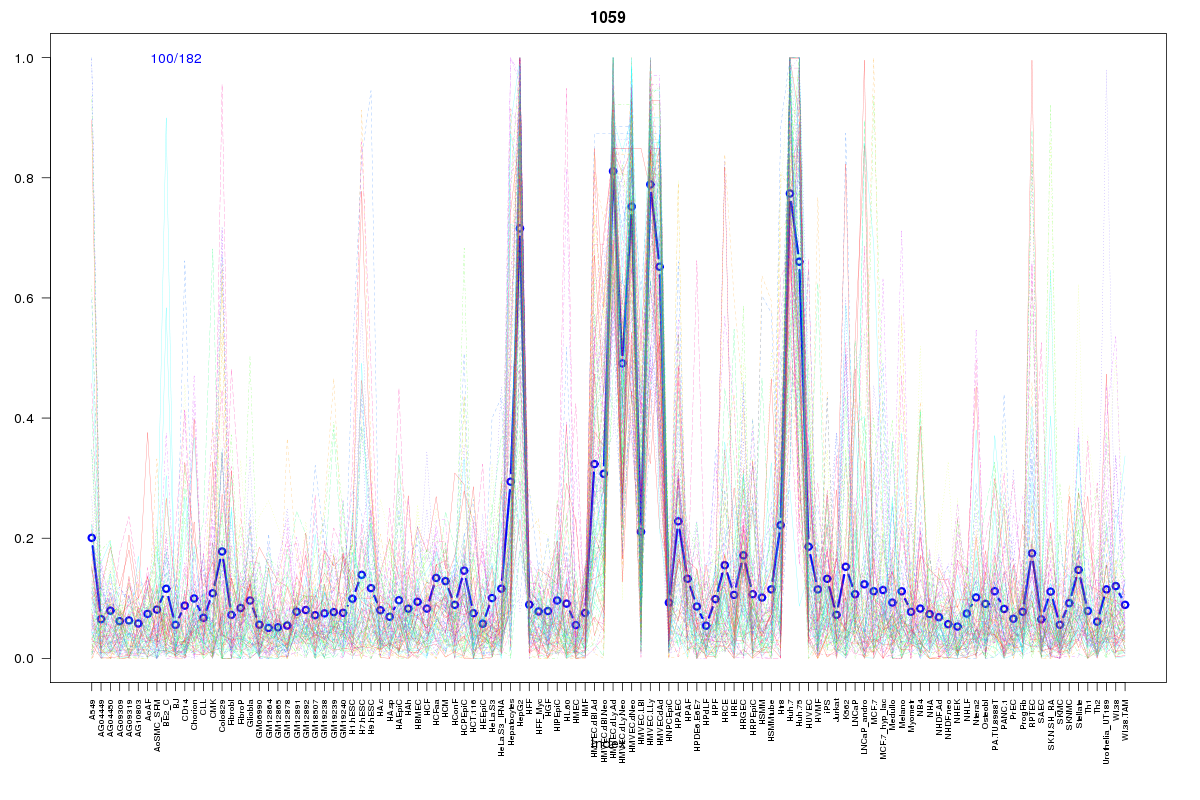 | 1059 | 1 |
 | 66 | 1 |
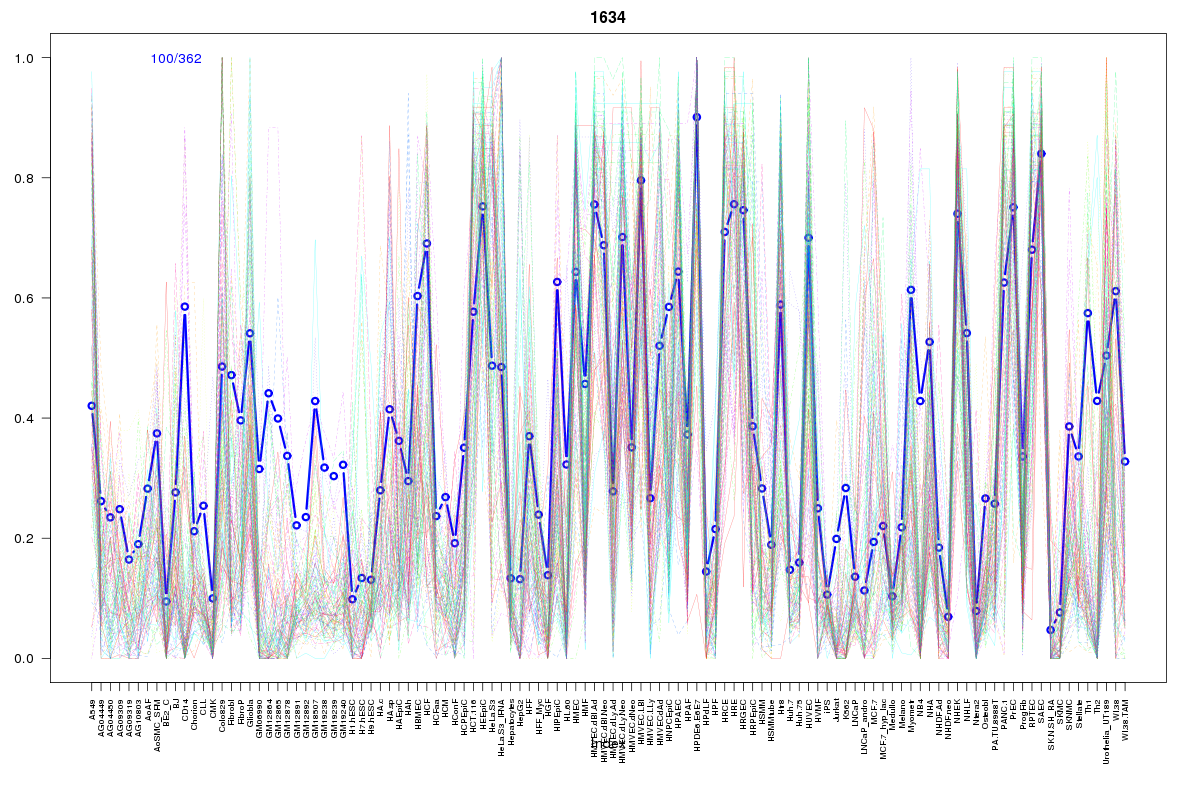 | 1634 | 1 |
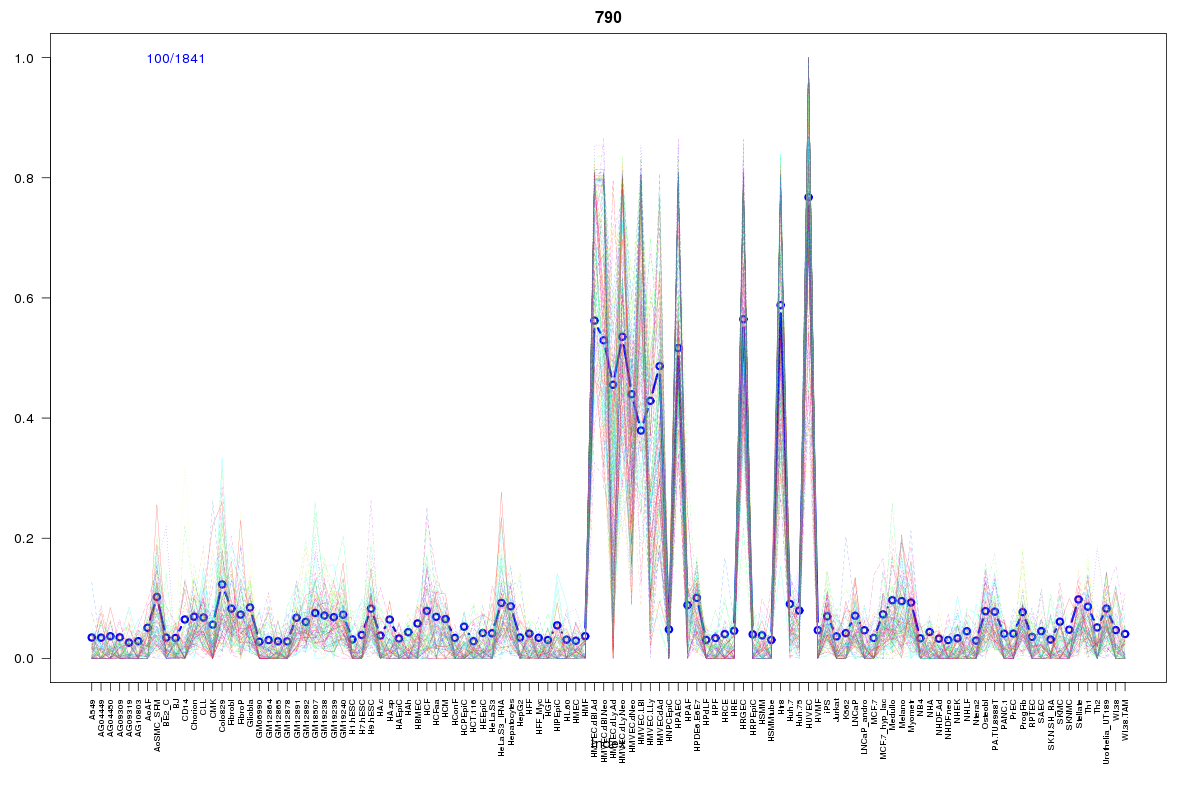 | 790 | 1 |
Resources
BED file downloads
Connects to 51 DHS sitesTop 10 Correlated DHS Sites
p-values indiciate significant higher or lower correlation| Location | Cluster | P-value |
|---|---|---|
| chr1:22252160-22252310 | 935 | 0.001 |
| chr1:22284940-22285090 | 790 | 0.001 |
| chr1:22288440-22288590 | 935 | 0.001 |
| chr1:22251140-22251290 | 743 | 0.001 |
| chr1:22324660-22324810 | 1162 | 0.001 |
| chr1:22273480-22273630 | 1059 | 0.002 |
| chr1:22284685-22284835 | 934 | 0.004 |
| chr1:22251300-22251450 | 739 | 0.004 |
| chr1:22324880-22325030 | 935 | 0.004 |
| chr1:22266240-22266390 | 500 | 0.004 |
| chr1:22273660-22273810 | 884 | 0.005 |
External Databases
UCSCEnsembl (ENSG00000142789)