Gene: N4BP2L1
chr13: 32974860-33002315Expression Profile
(log scale)
Graphical Connections
Distribution of linked clusters:
You may find it interesting if many of the connected DHS sites belong to the same cluster.| Cluster Profile | Cluster ID | Number of DHS sites in this cluster |
|---|---|---|
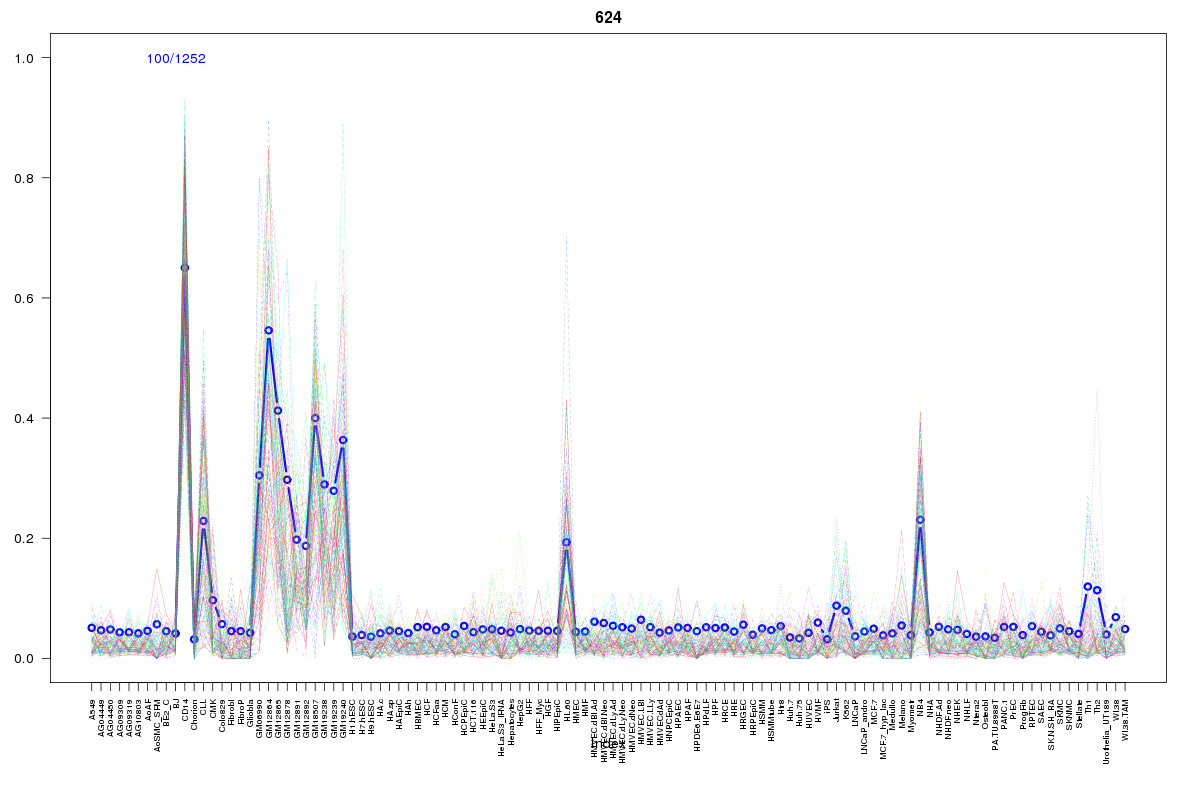 | 624 | 1 |
 | 927 | 1 |
 | 326 | 1 |
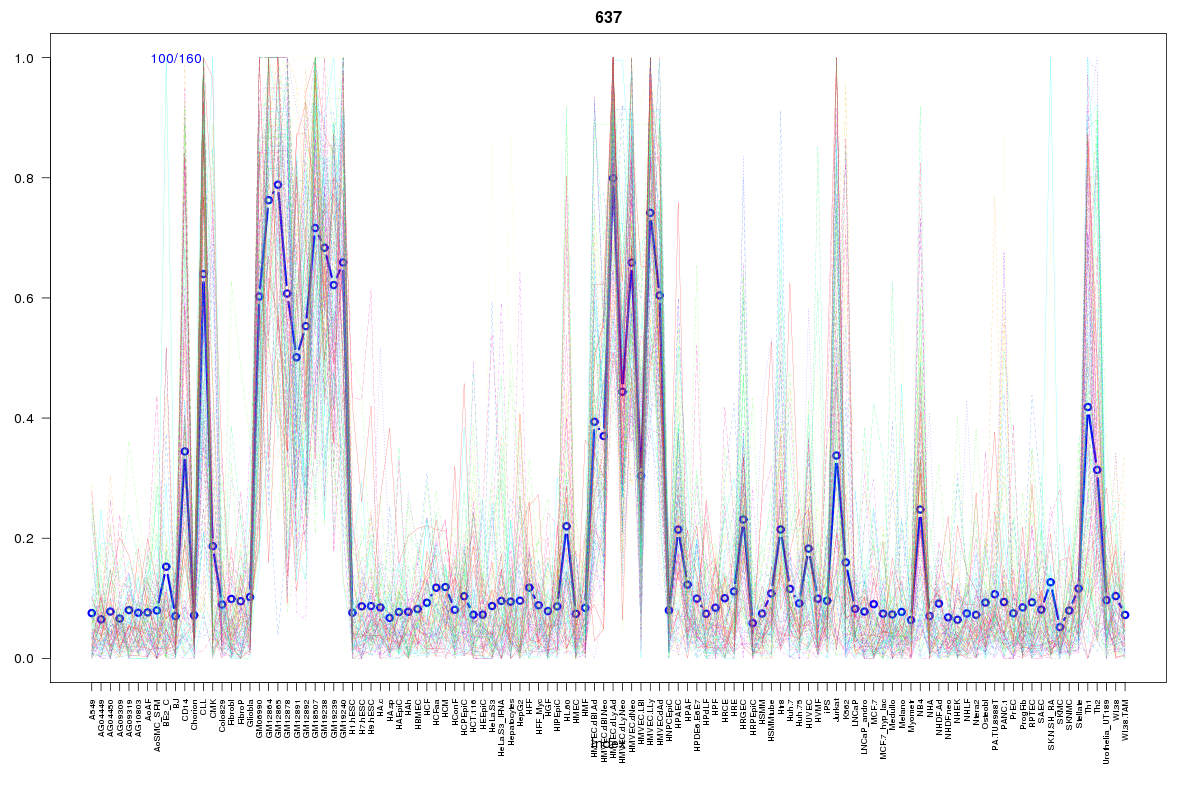 | 637 | 1 |
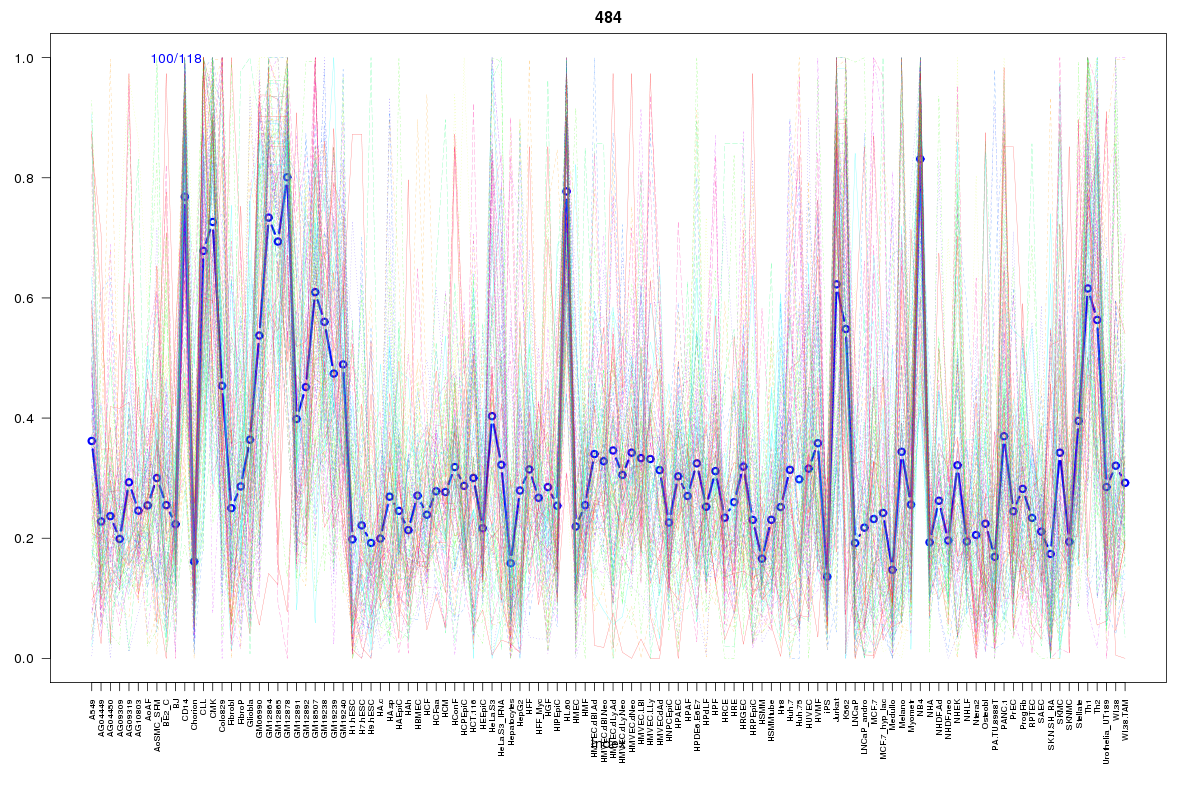 | 484 | 1 |
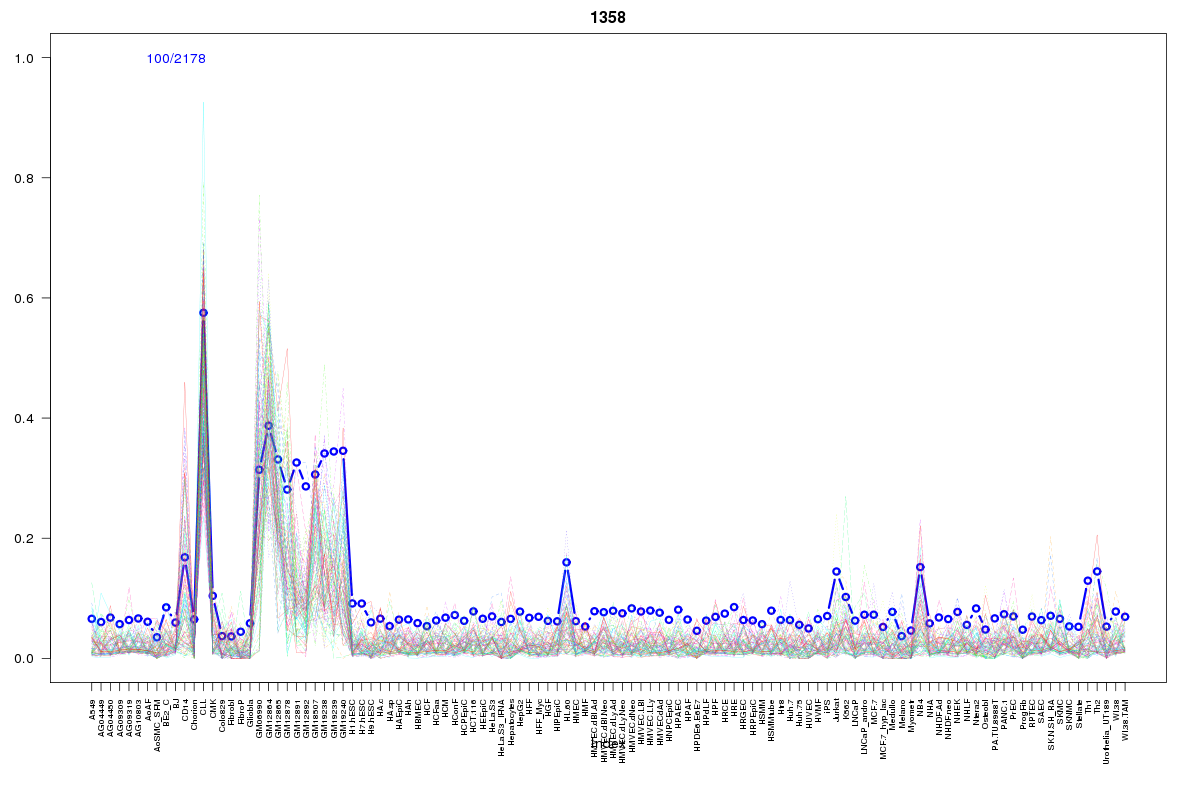 | 1358 | 1 |
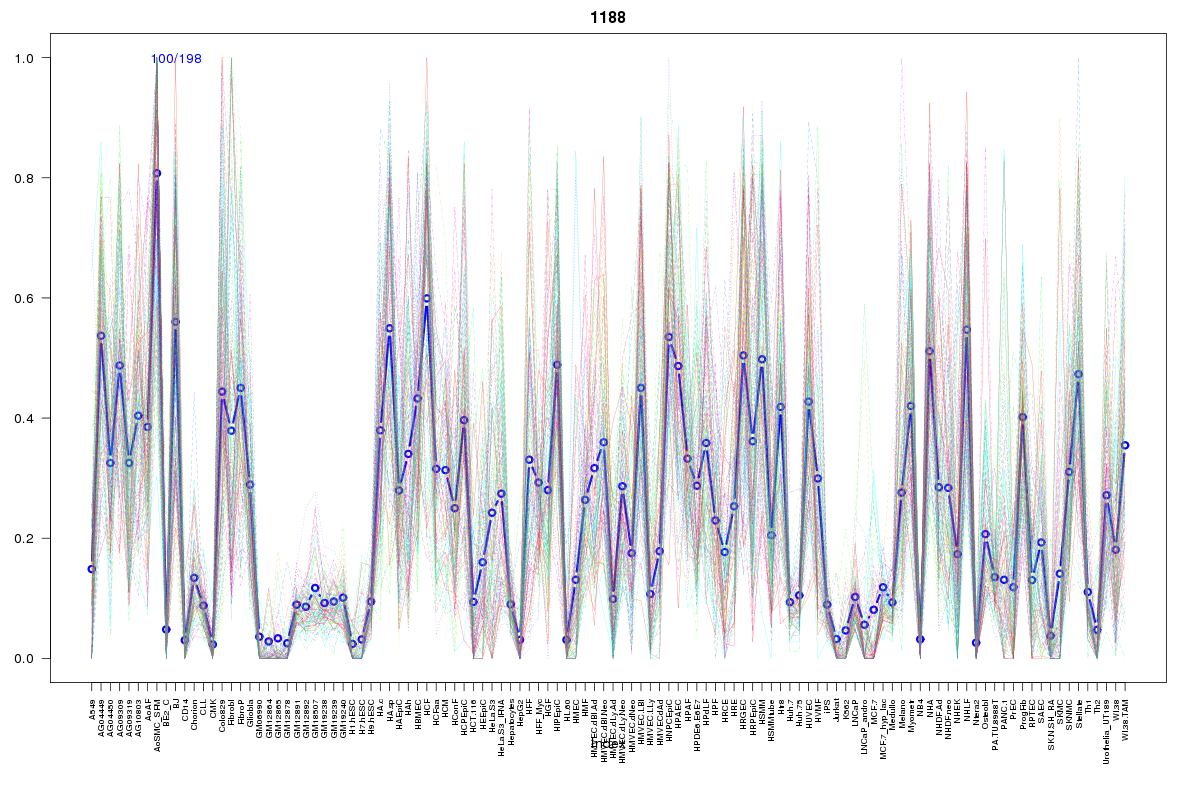 | 1188 | 1 |
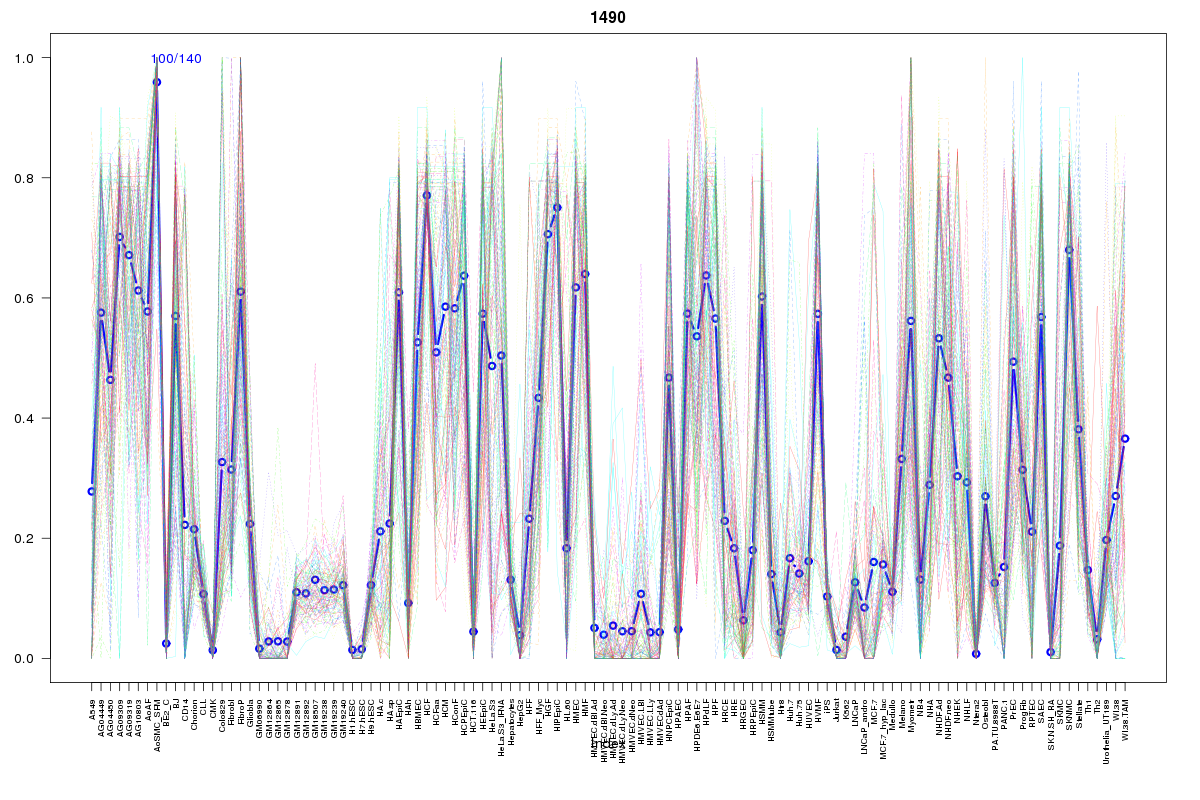 | 1490 | 1 |
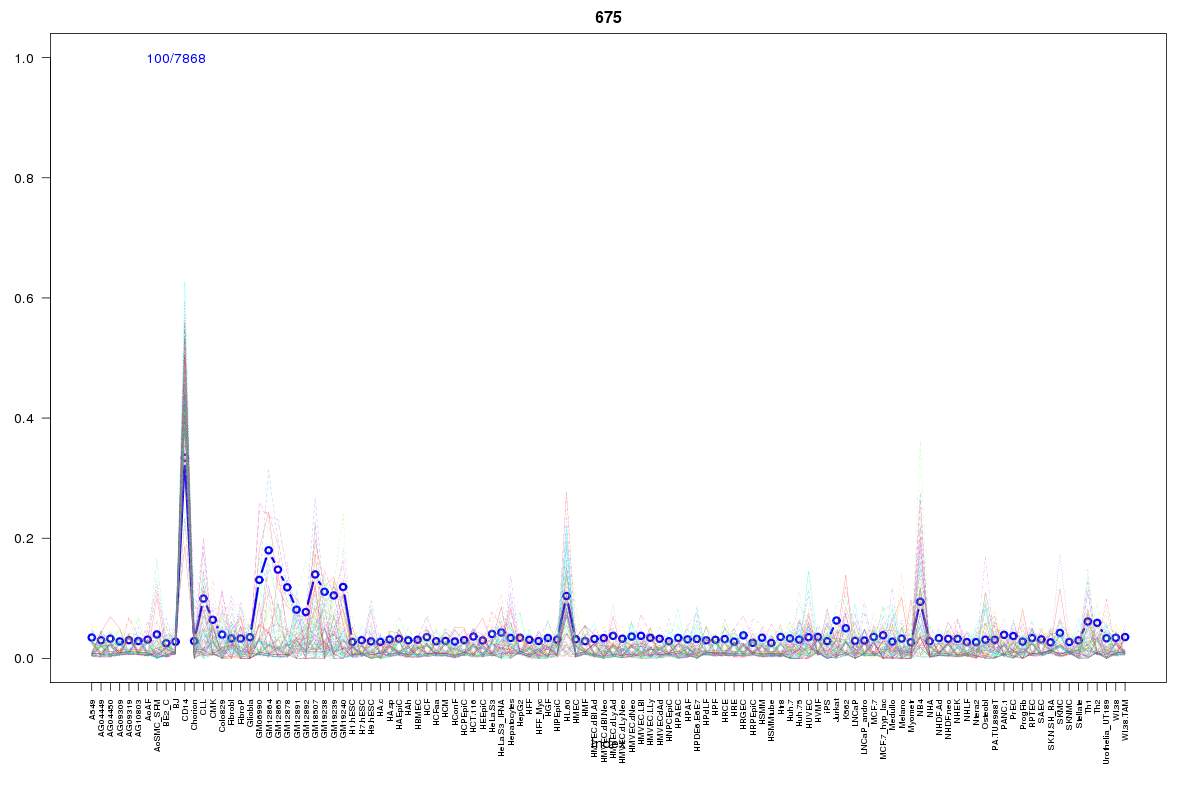 | 675 | 1 |
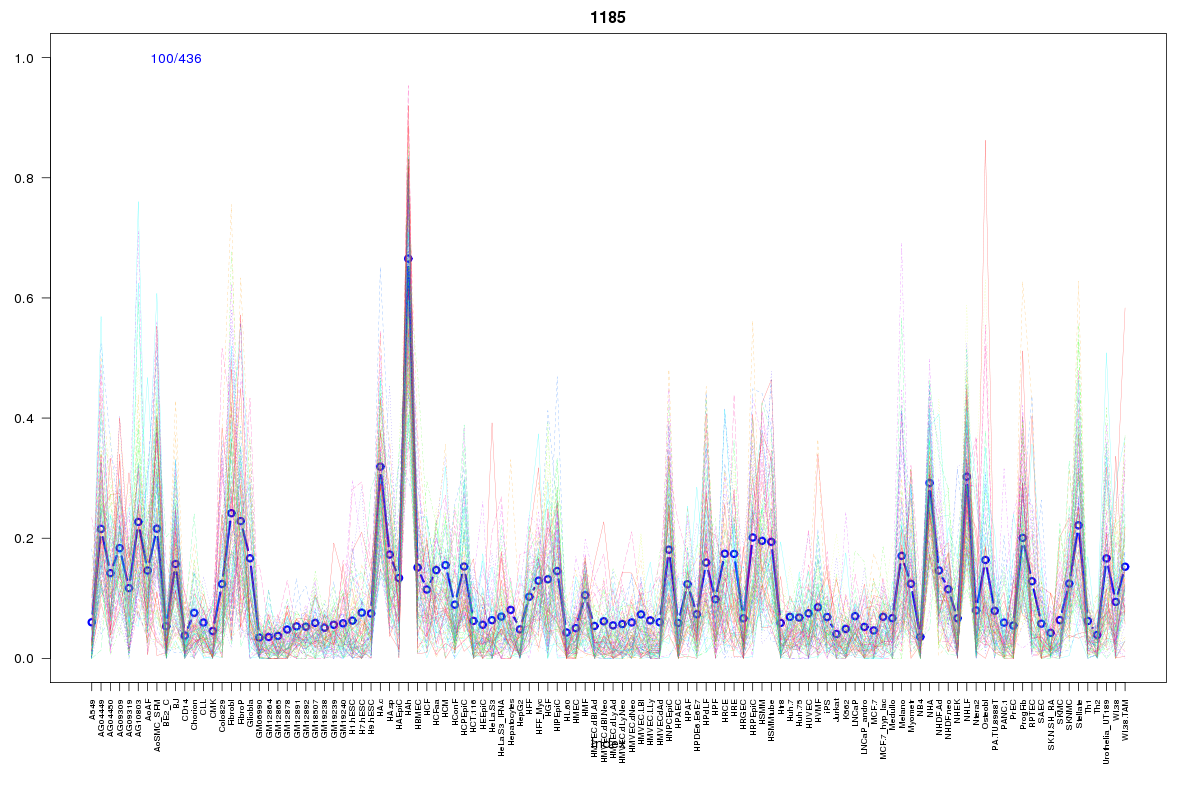 | 1185 | 1 |
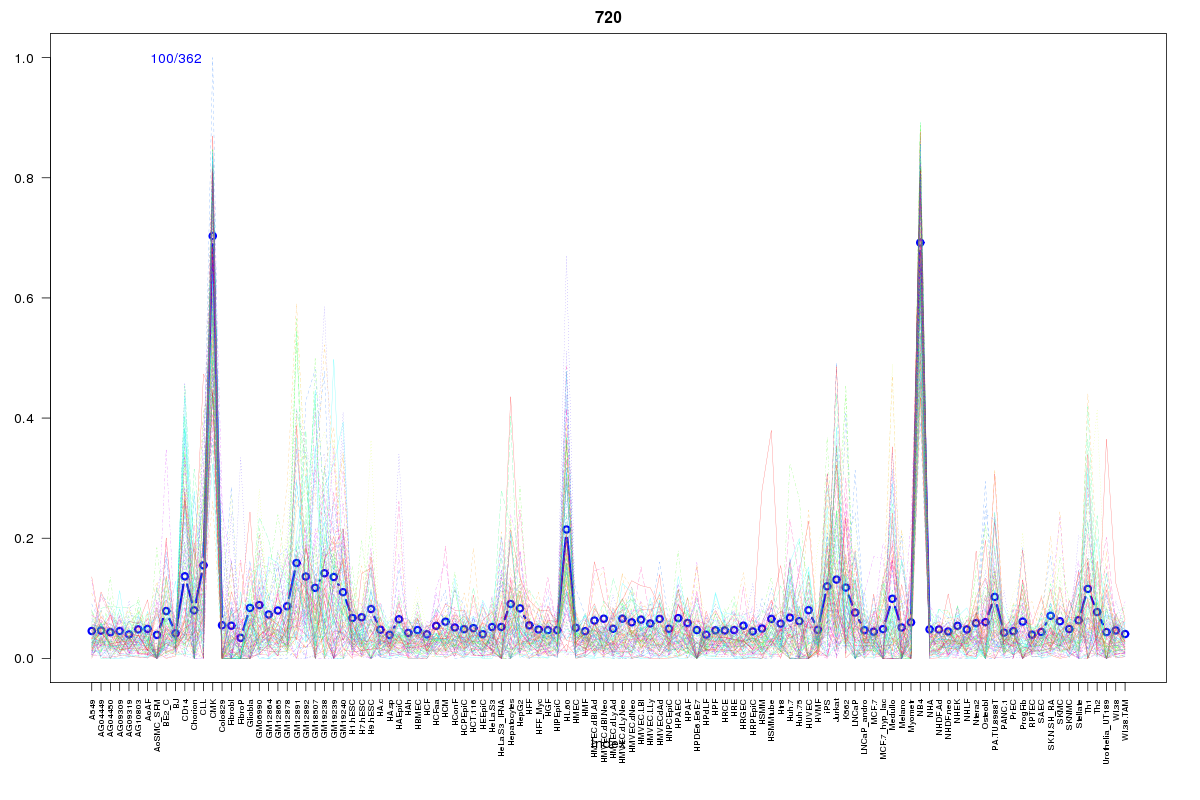 | 720 | 1 |
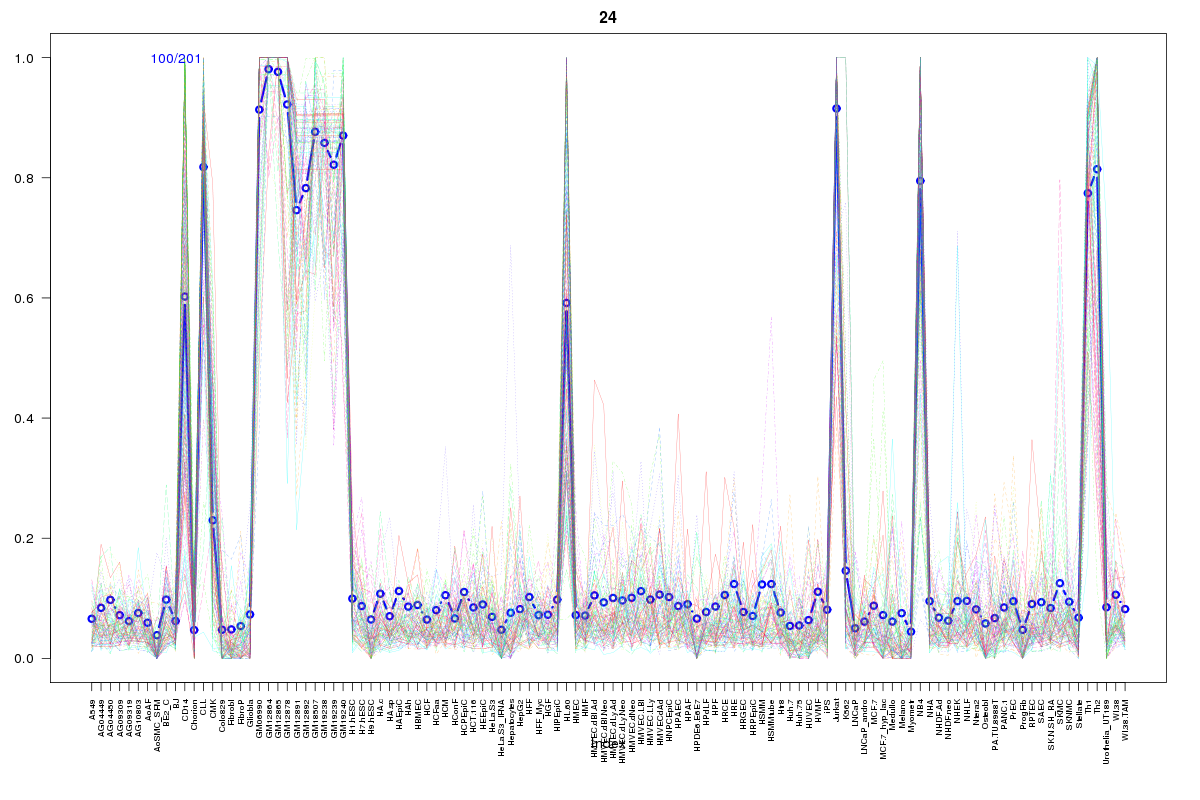 | 24 | 1 |
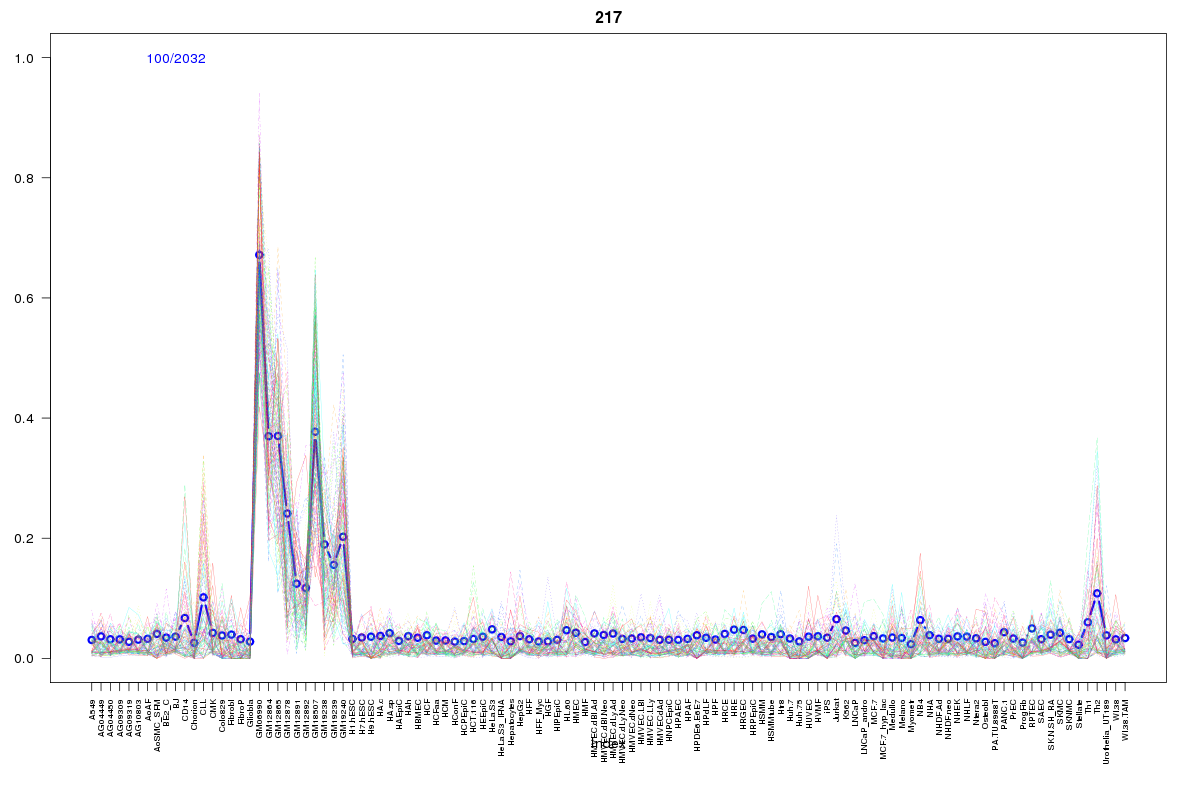 | 217 | 1 |
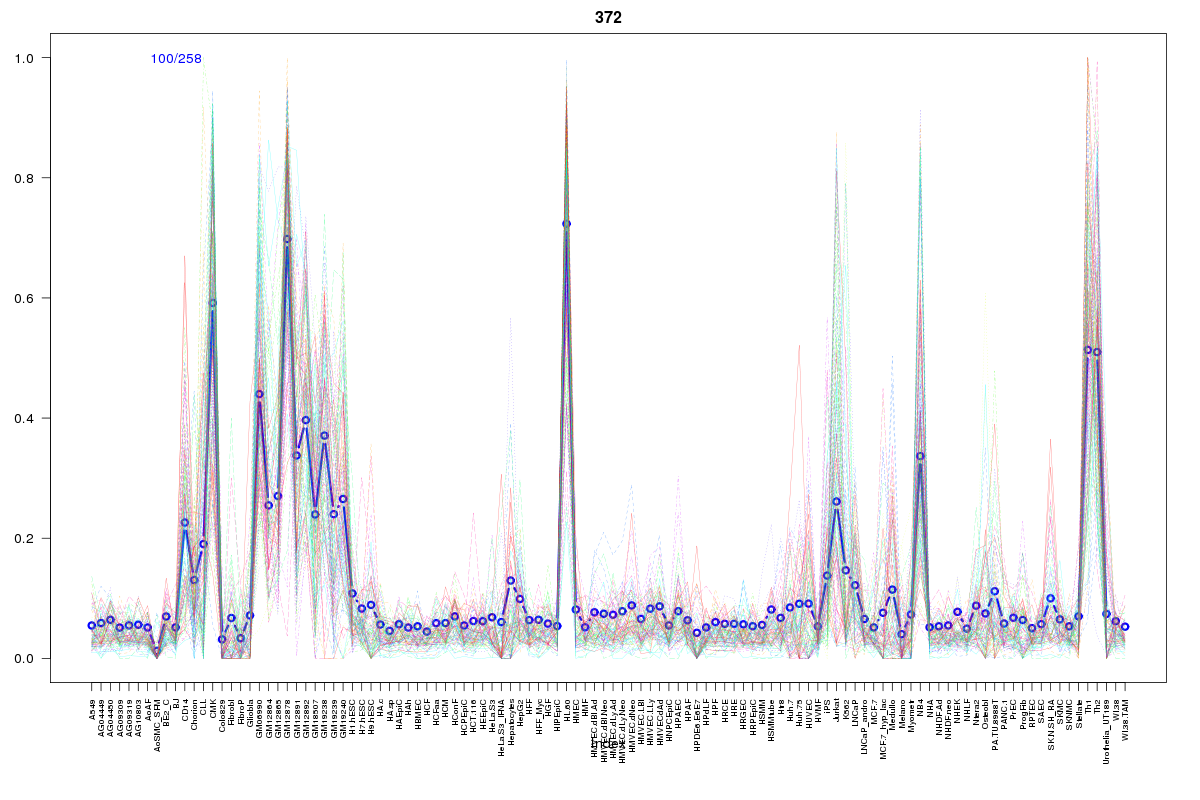 | 372 | 1 |
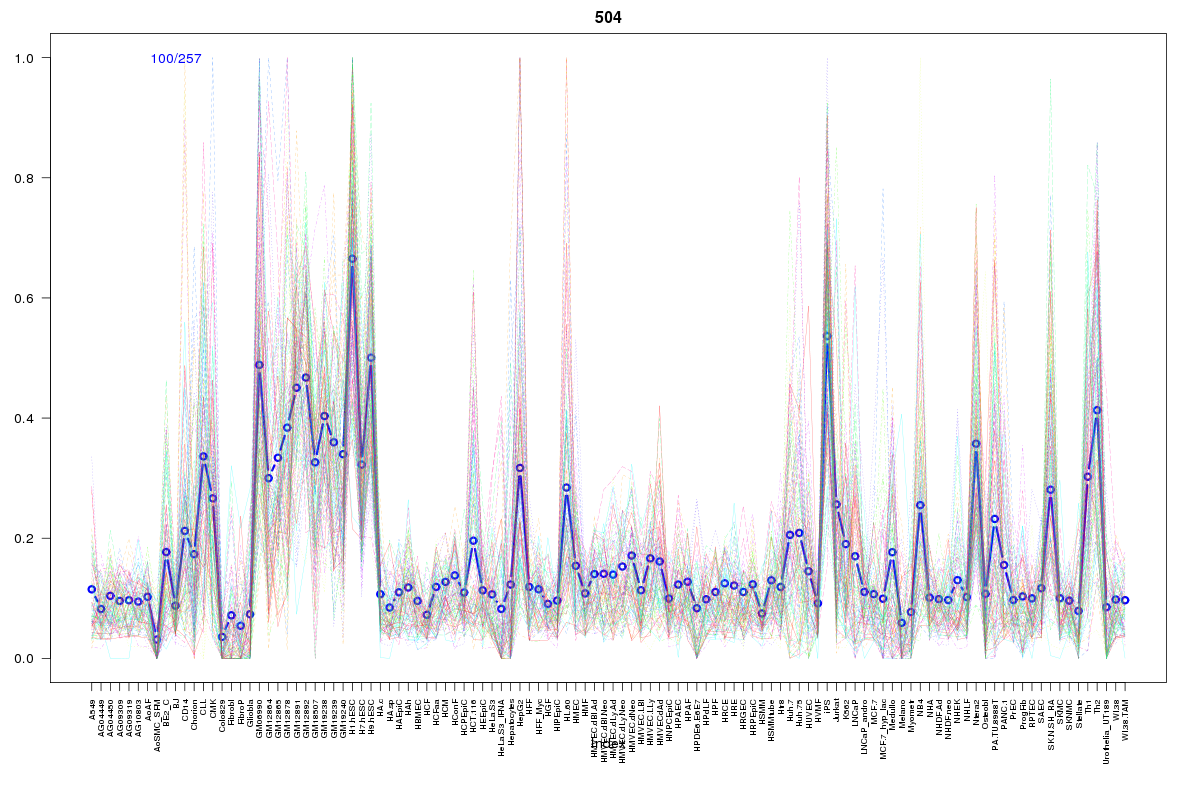 | 504 | 1 |
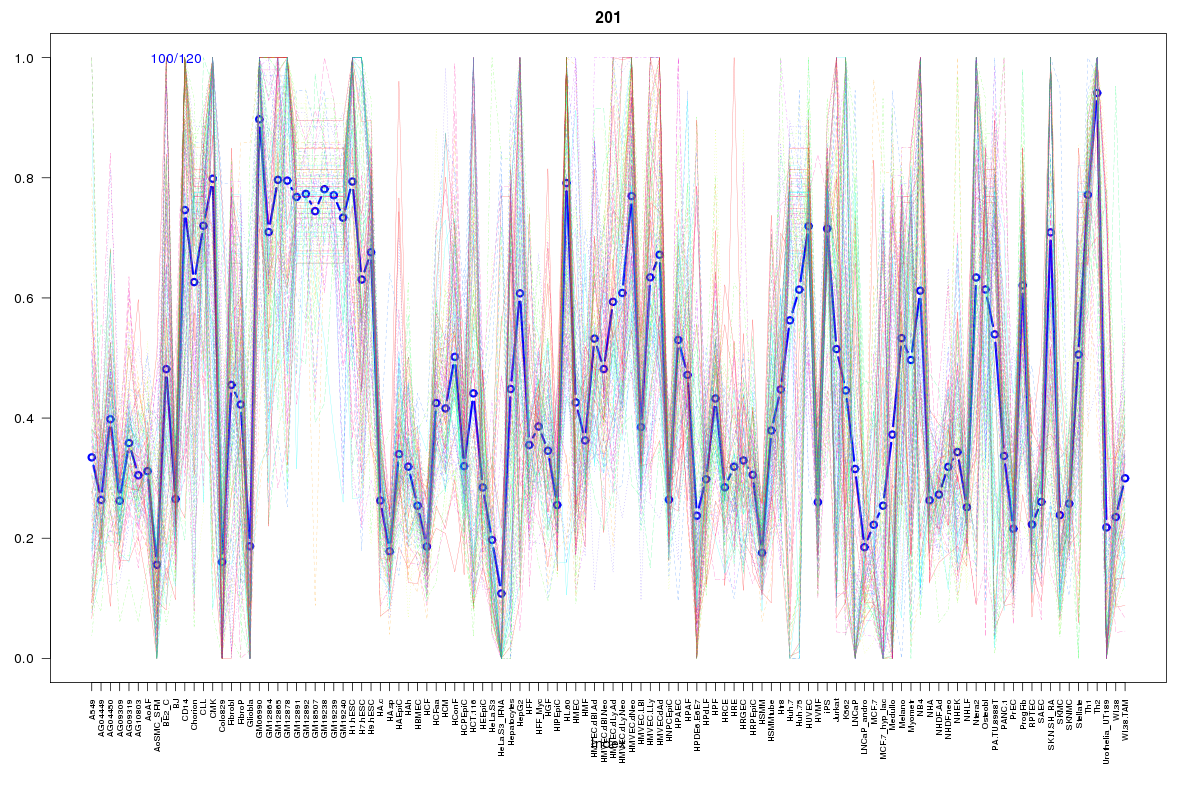 | 201 | 1 |
 | 282 | 1 |
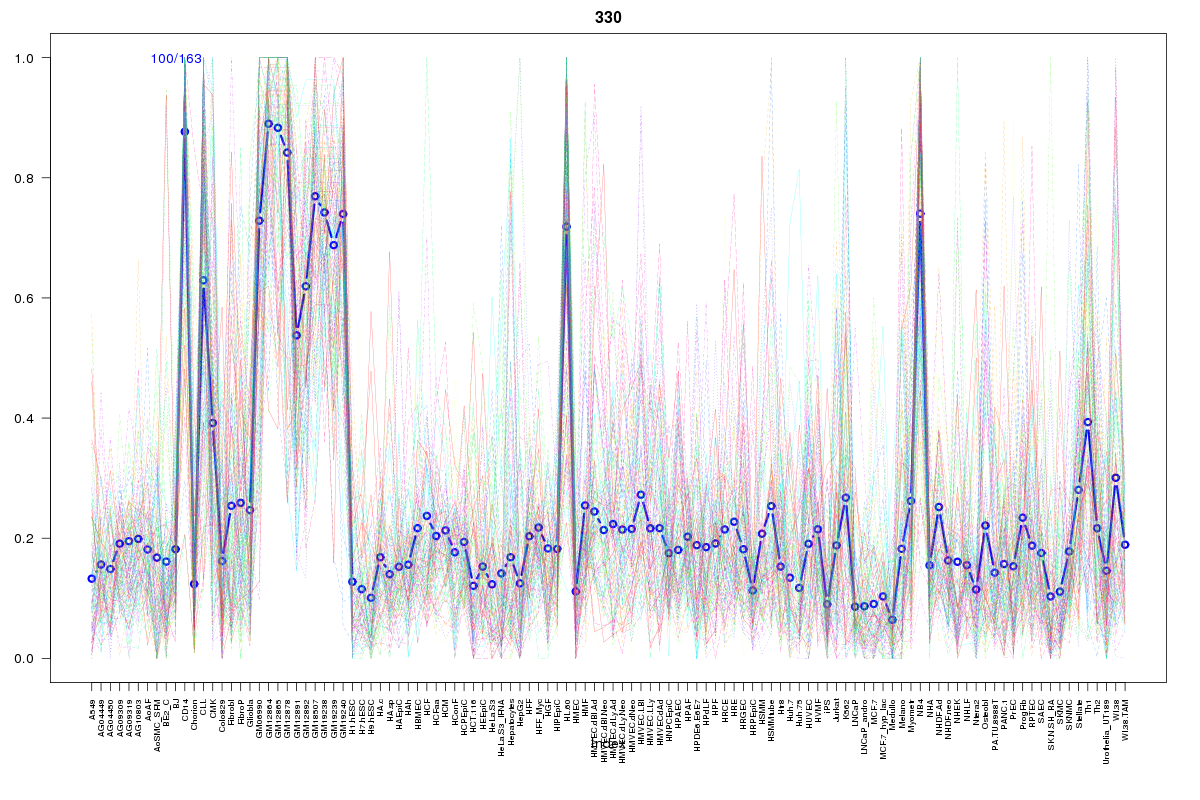 | 330 | 1 |
Resources
BED file downloads
Connects to 18 DHS sitesTop 10 Correlated DHS Sites
p-values indiciate significant higher or lower correlation| Location | Cluster | P-value |
|---|---|---|
| chr13:33002400-33002550 | 282 | 0 |
| chr13:33000340-33000490 | 24 | 0 |
| chr13:33002560-33002710 | 330 | 0 |
| chr13:33002240-33002390 | 201 | 0.001 |
| chr13:33002940-33003090 | 624 | 0.001 |
| chr13:33001220-33001370 | 504 | 0.003 |
| chr13:33000760-33000910 | 372 | 0.004 |
| chr13:33017380-33017530 | 637 | 0.006 |
| chr13:32889080-32889230 | 484 | 0.006 |
| chr13:33000605-33000755 | 217 | 0.014 |
| chr13:32997840-32997990 | 720 | 0.015 |
External Databases
UCSCEnsembl (ENSG00000139597)