Gene: MTTP
chr4: 100484917-100504573Expression Profile
(log scale)
Graphical Connections
Distribution of linked clusters:
You may find it interesting if many of the connected DHS sites belong to the same cluster.| Cluster Profile | Cluster ID | Number of DHS sites in this cluster |
|---|---|---|
 | 860 | 2 |
 | 1355 | 2 |
 | 149 | 1 |
 | 248 | 1 |
 | 2055 | 1 |
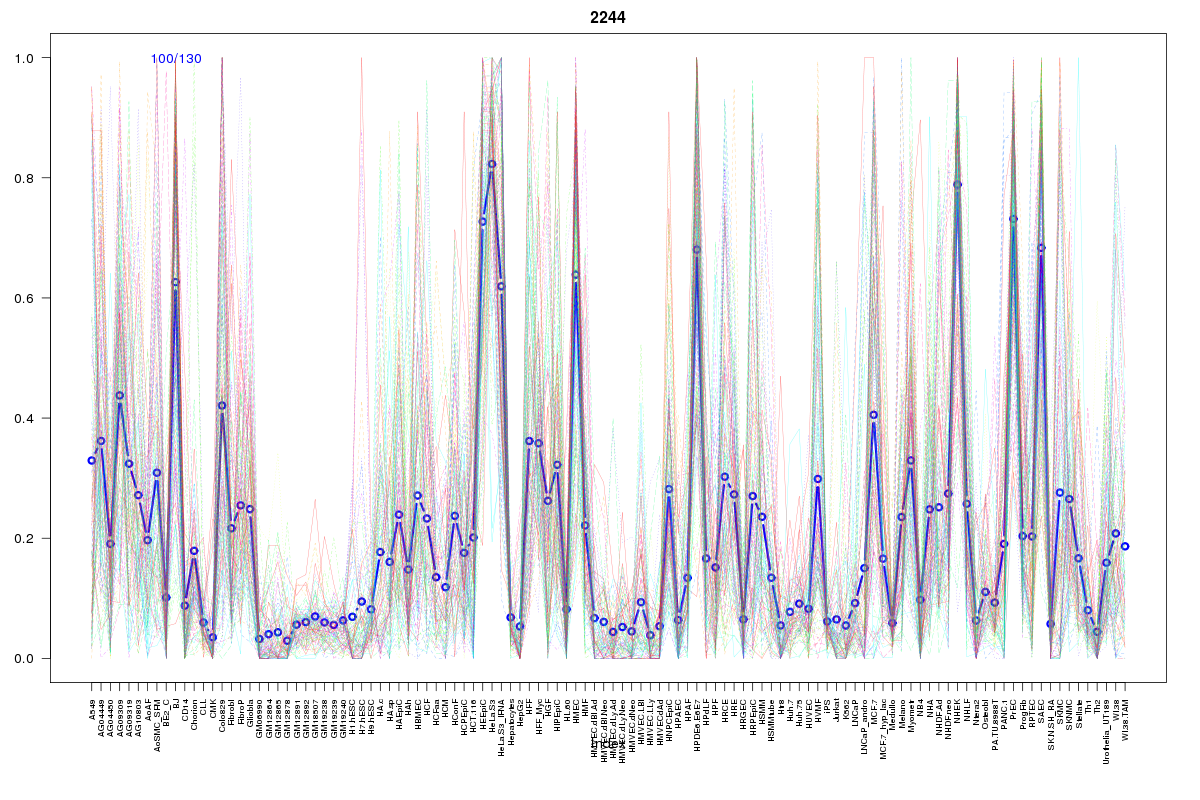 | 2244 | 1 |
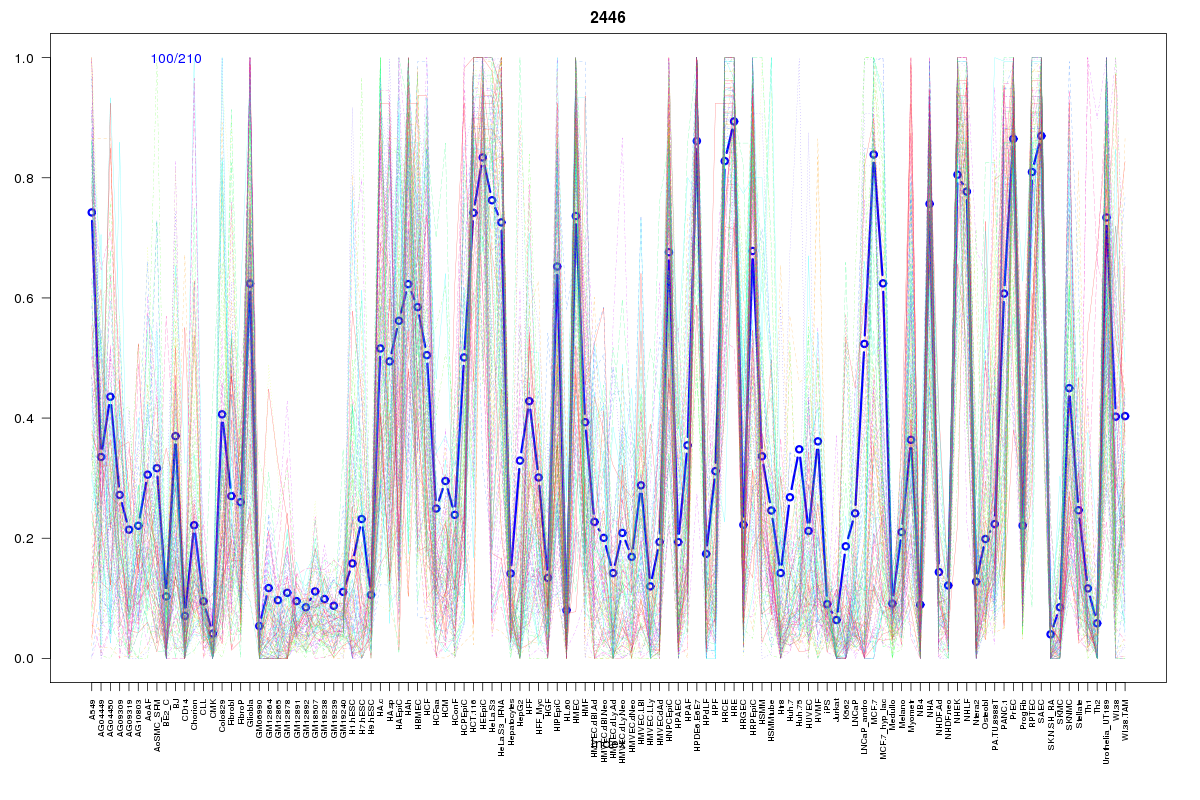 | 2446 | 1 |
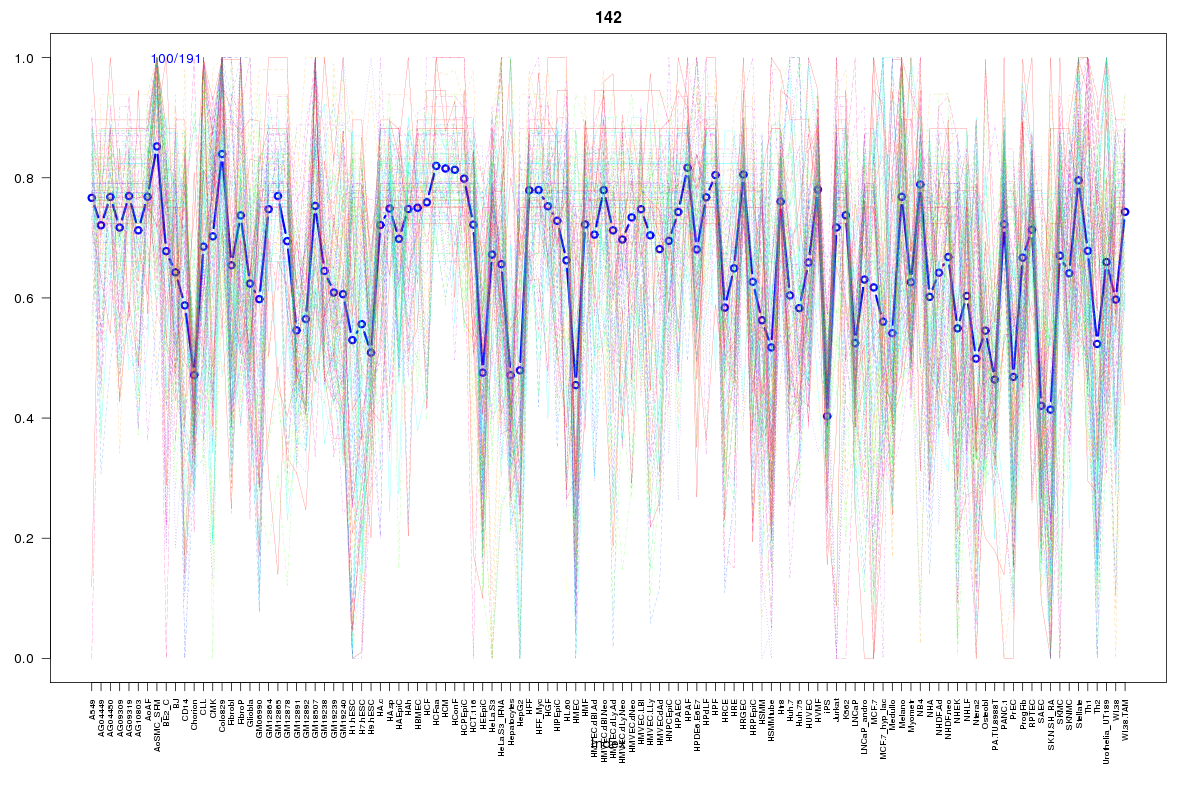 | 142 | 1 |
Resources
BED file downloads
Connects to 10 DHS sitesTop 10 Correlated DHS Sites
p-values indiciate significant higher or lower correlation| Location | Cluster | P-value |
|---|---|---|
| chr4:100495860-100496010 | 1355 | 0.002 |
| chr4:100458105-100458255 | 1355 | 0.009 |
| chr4:100569845-100569995 | 860 | 0.015 |
| chr4:100571345-100571495 | 2055 | 0.016 |
| chr4:100571145-100571295 | 860 | 0.017 |
| chr4:100576600-100576750 | 2244 | 0.017 |
| chr4:100485120-100485270 | 248 | 0.013 |
| chr4:100644820-100644970 | 2446 | 0.013 |
| chr4:100482400-100482550 | 142 | 0.011 |
| chr4:100484840-100484990 | 149 | 0.004 |
External Databases
UCSCEnsembl (ENSG00000138823)