Gene: MYO1G
chr7: 45002260-45018678Expression Profile
(log scale)
Graphical Connections
Distribution of linked clusters:
You may find it interesting if many of the connected DHS sites belong to the same cluster.| Cluster Profile | Cluster ID | Number of DHS sites in this cluster |
|---|---|---|
 | 570 | 9 |
 | 1970 | 5 |
 | 2062 | 4 |
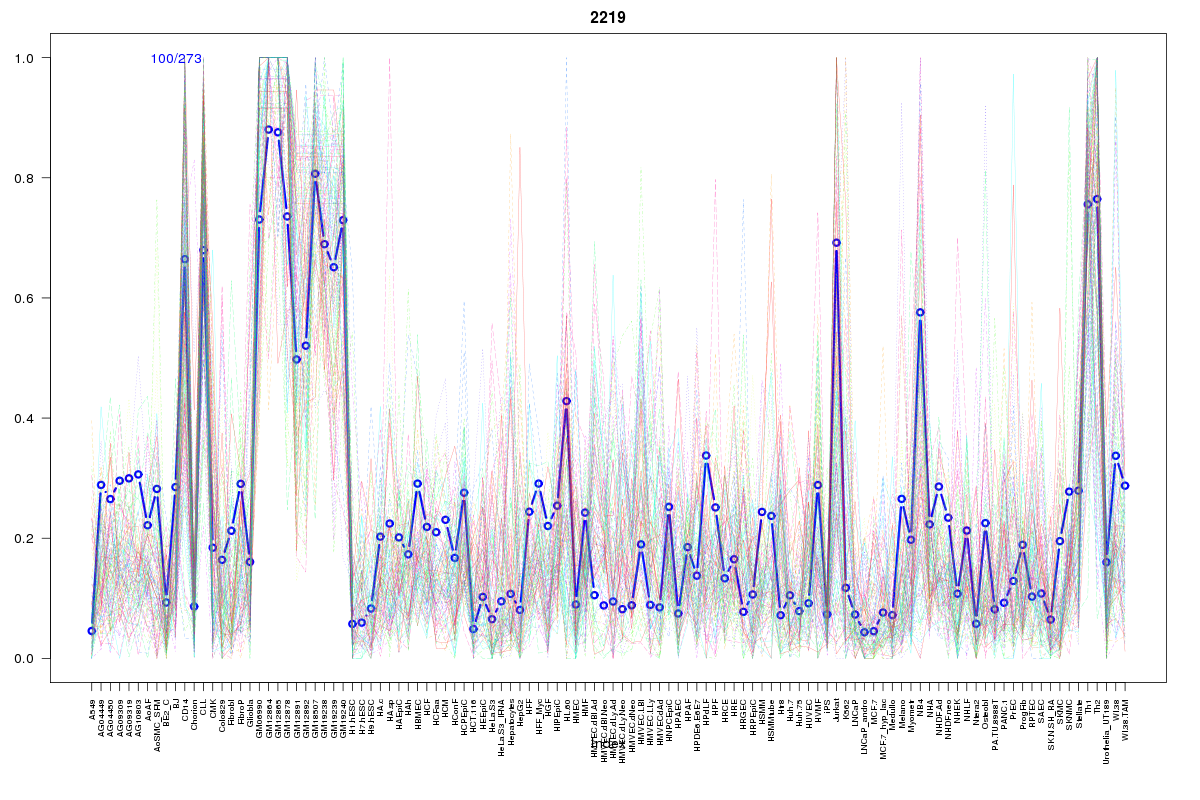 | 2219 | 3 |
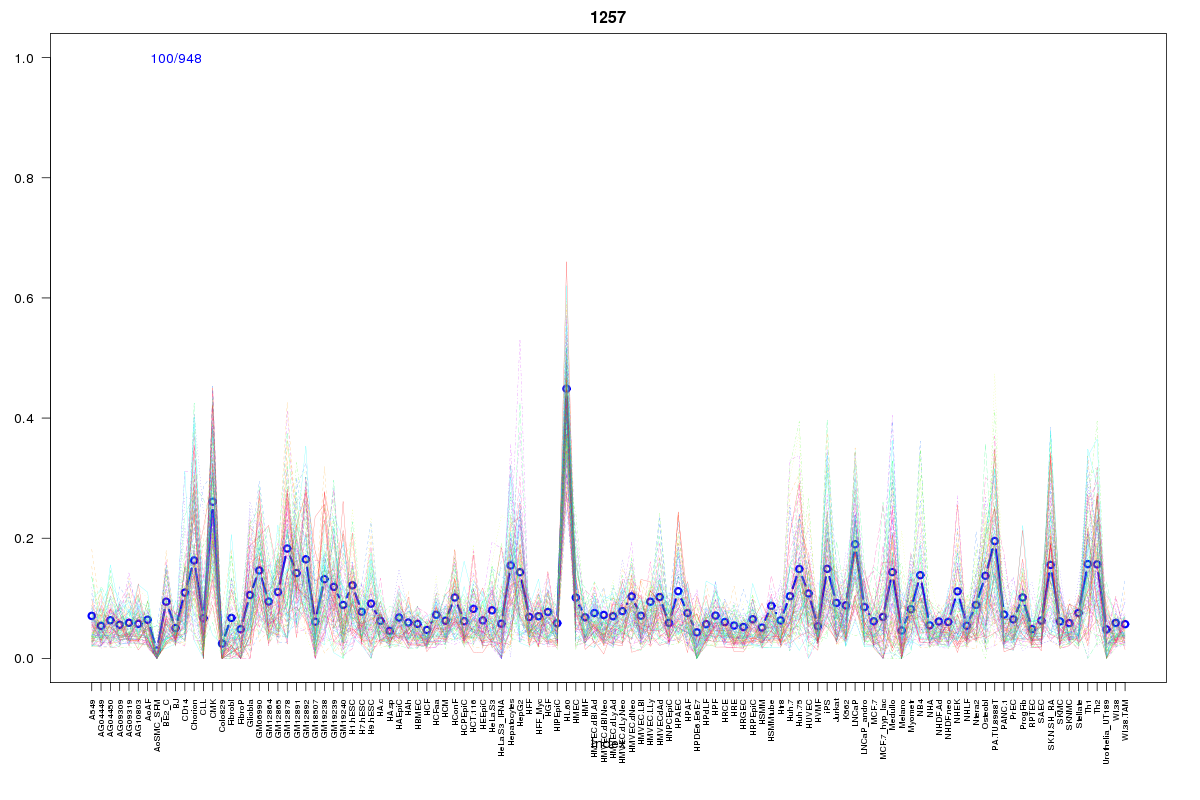 | 1257 | 3 |
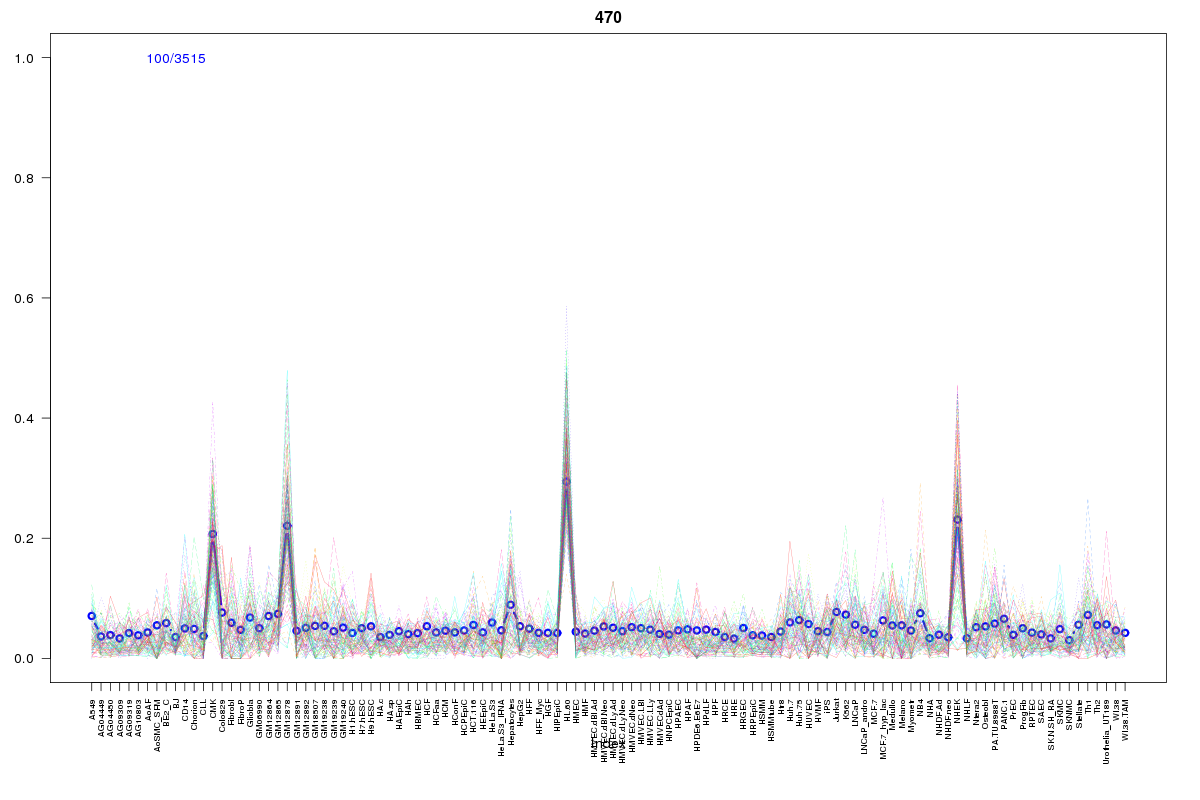 | 470 | 3 |
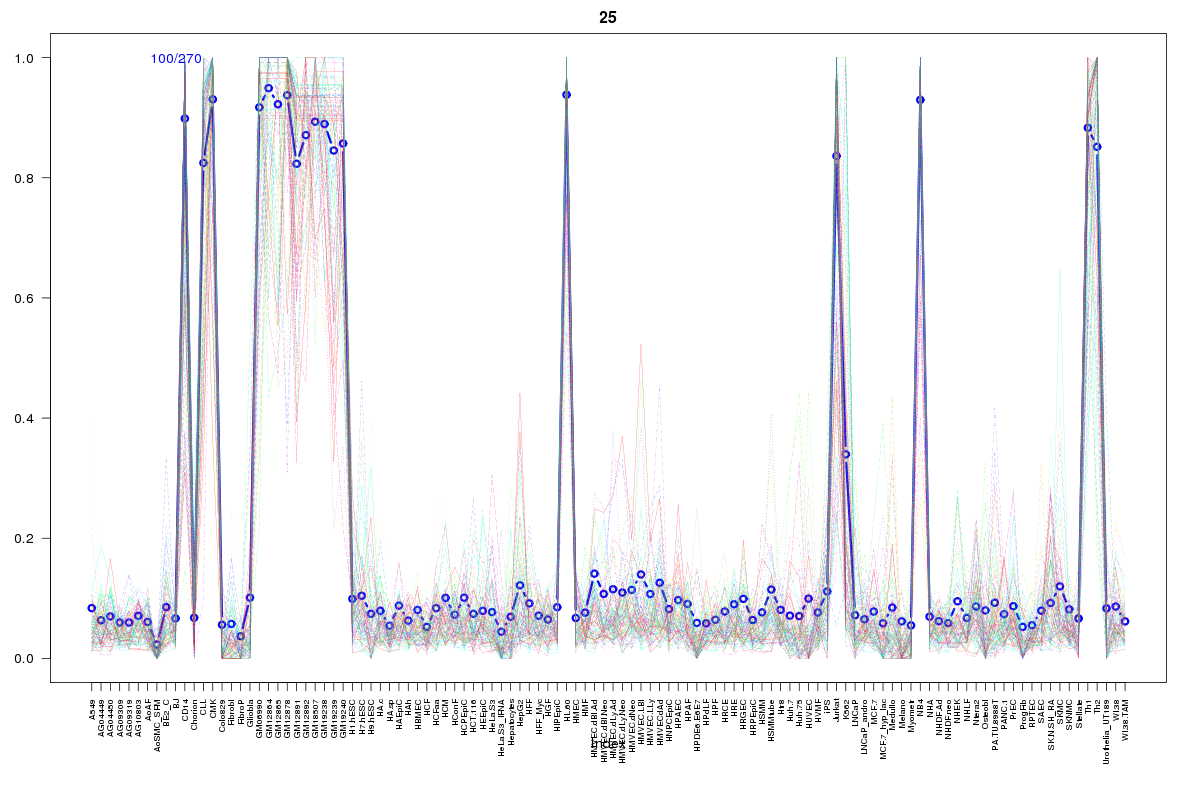 | 25 | 3 |
 | 2072 | 3 |
 | 1755 | 2 |
 | 568 | 2 |
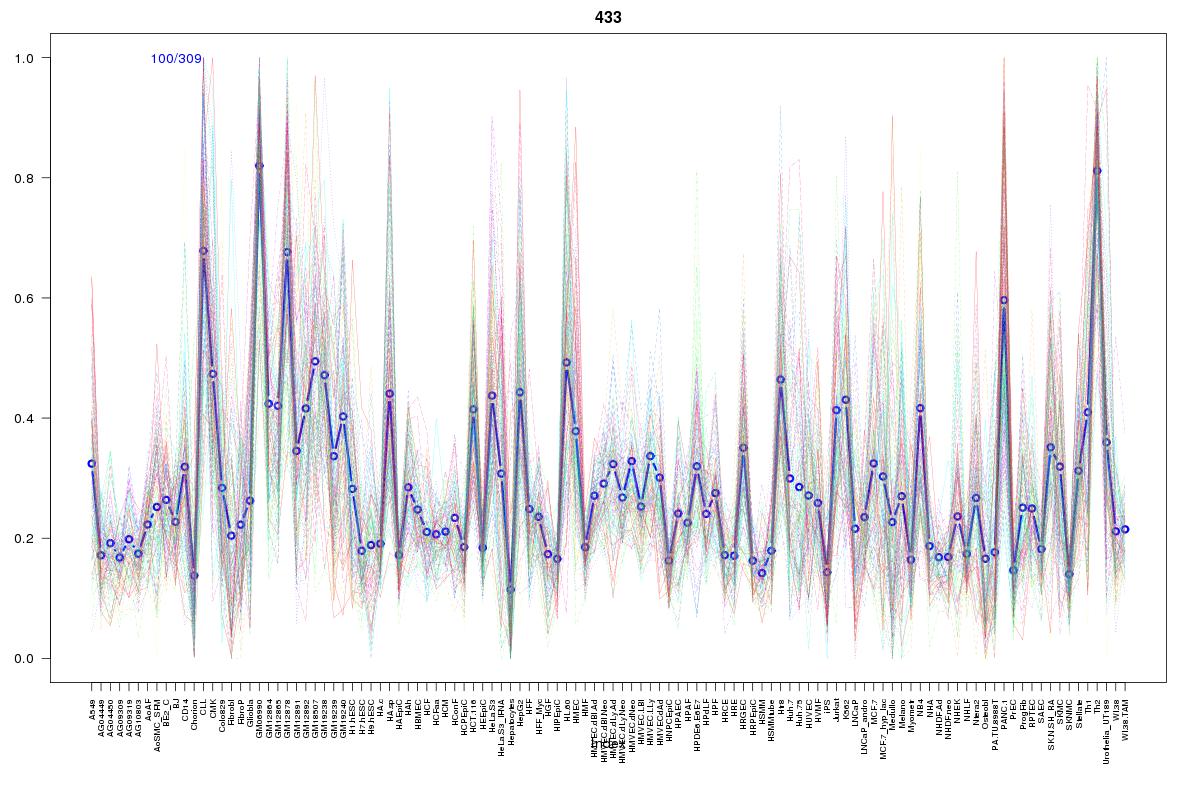 | 433 | 2 |
 | 1604 | 2 |
 | 2122 | 2 |
 | 2211 | 2 |
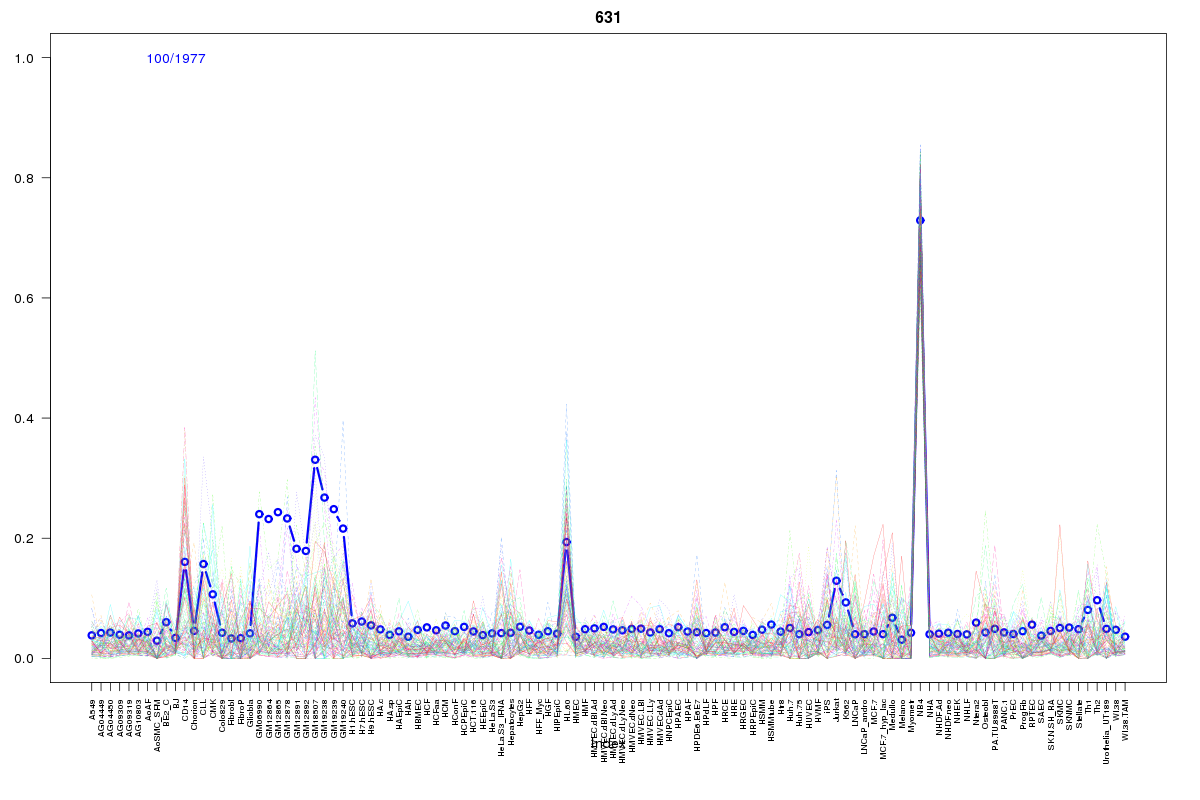 | 631 | 2 |
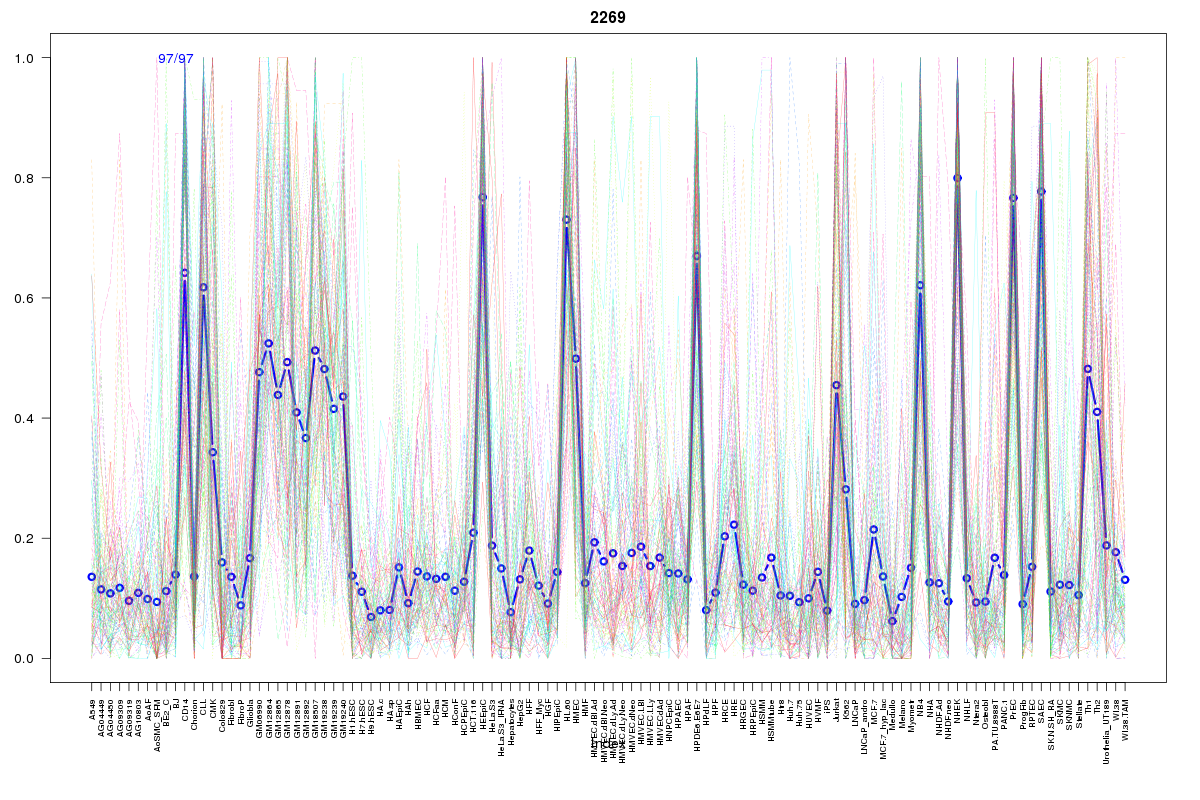 | 2269 | 1 |
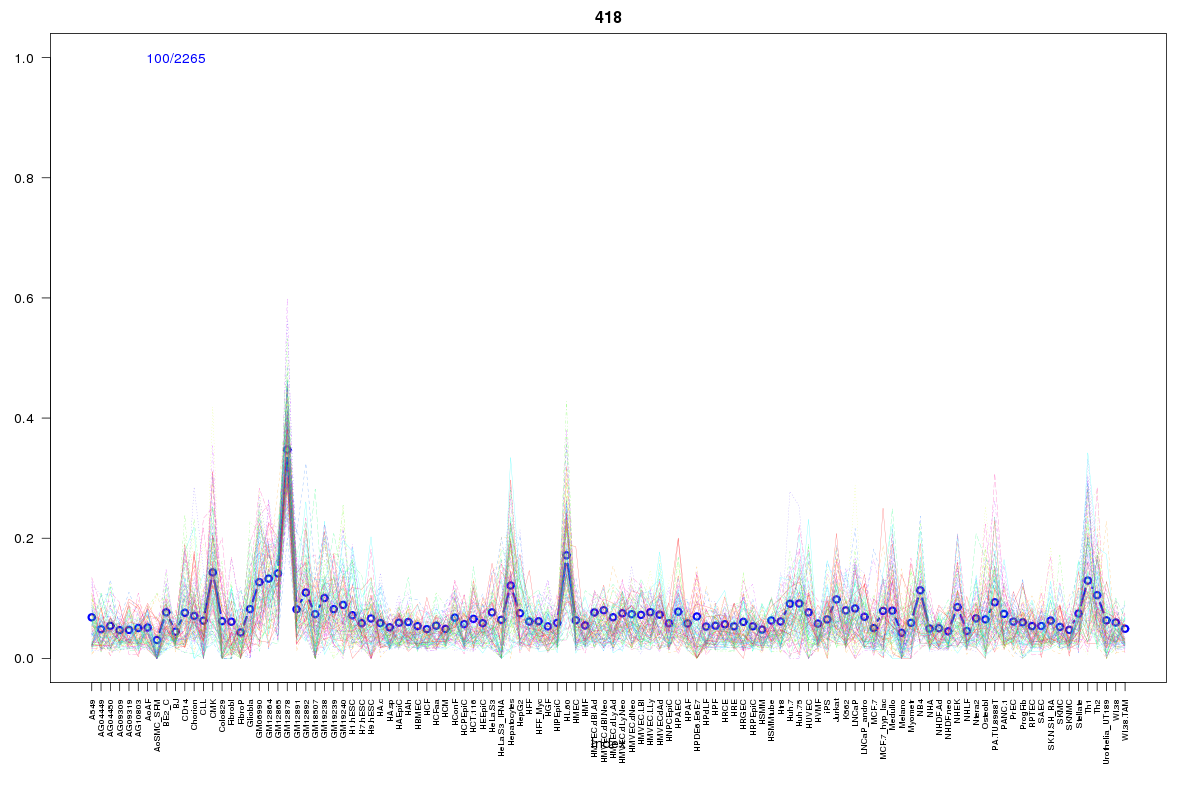 | 418 | 1 |
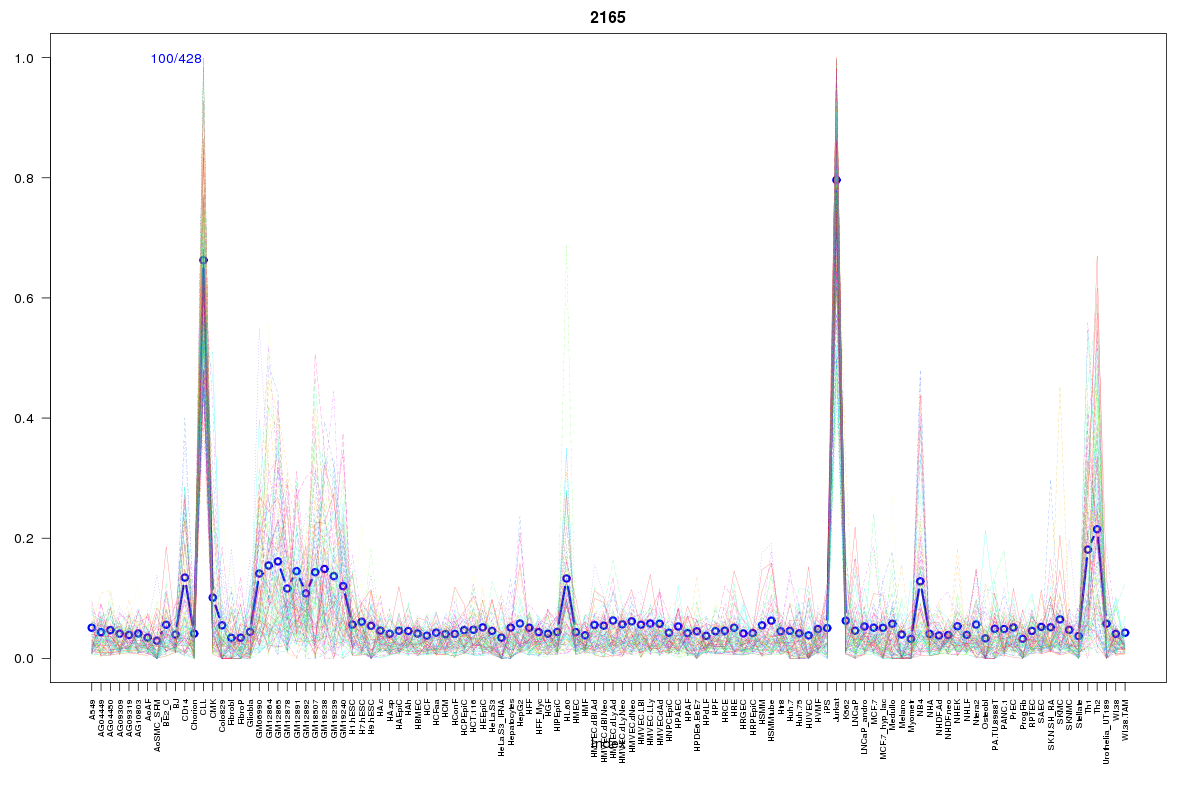 | 2165 | 1 |
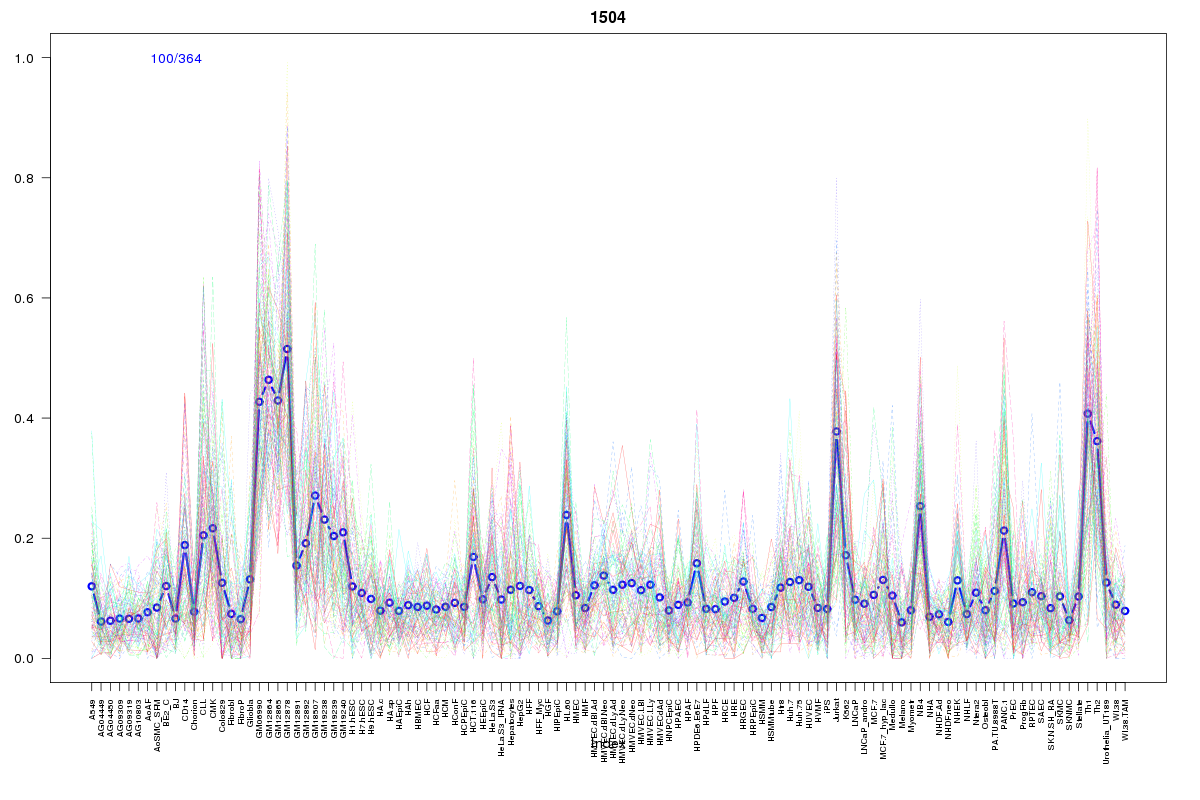 | 1504 | 1 |
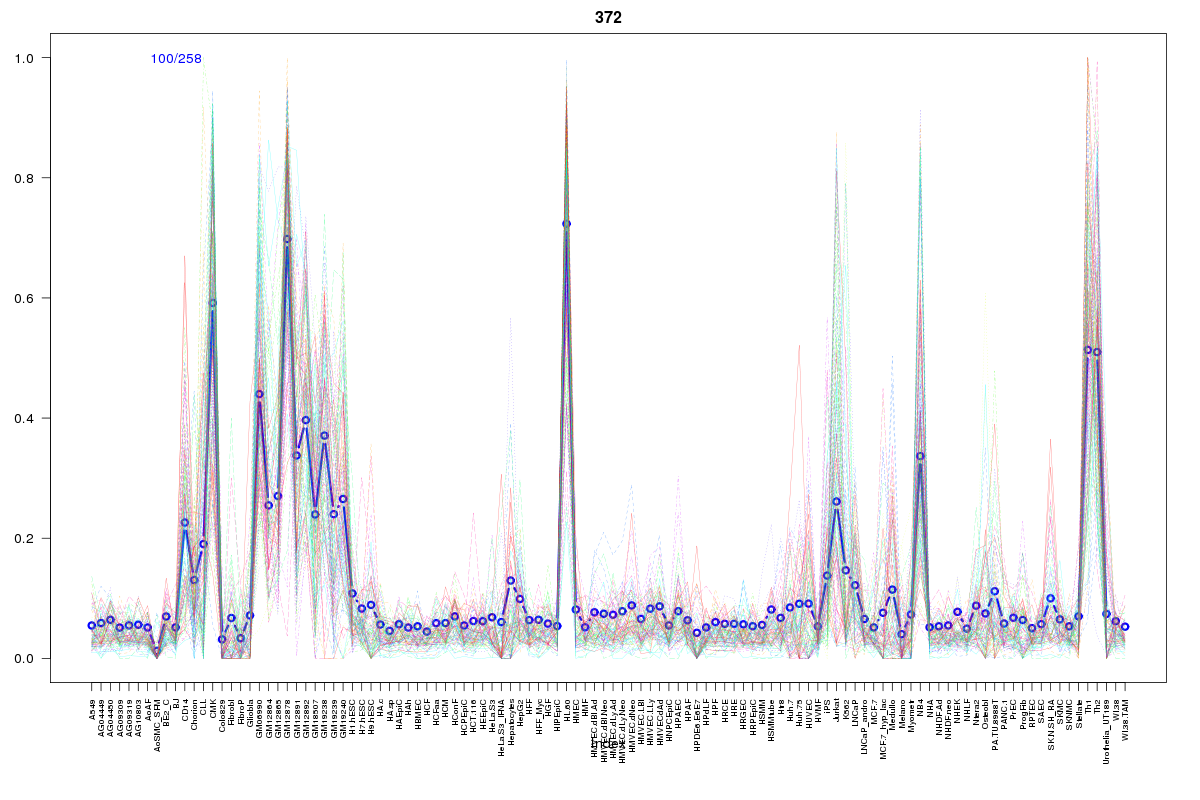 | 372 | 1 |
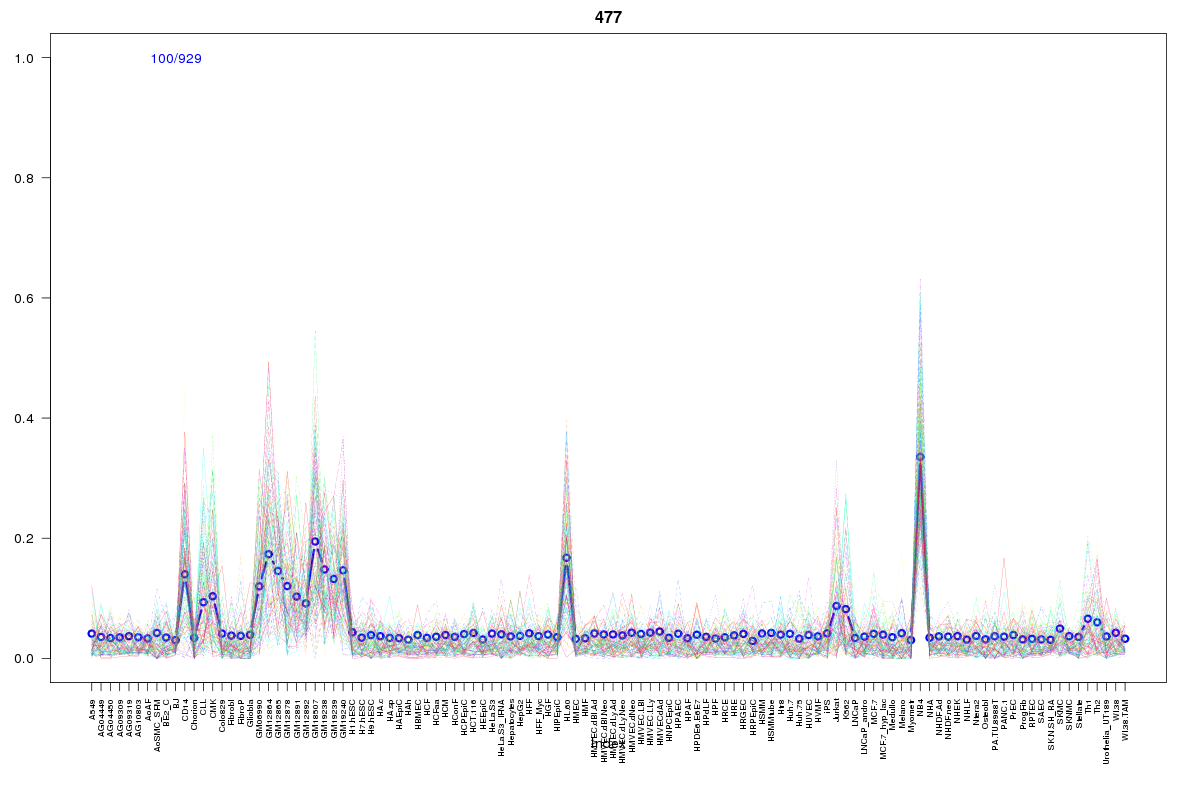 | 477 | 1 |
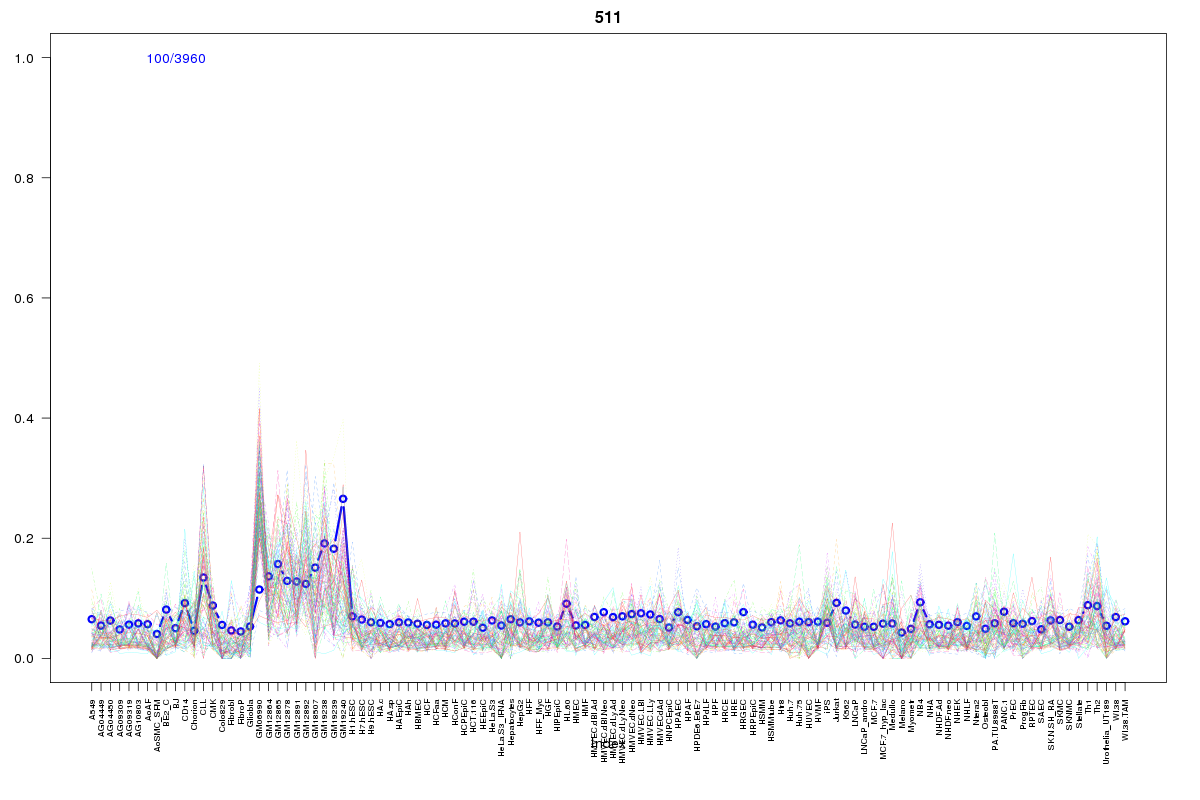 | 511 | 1 |
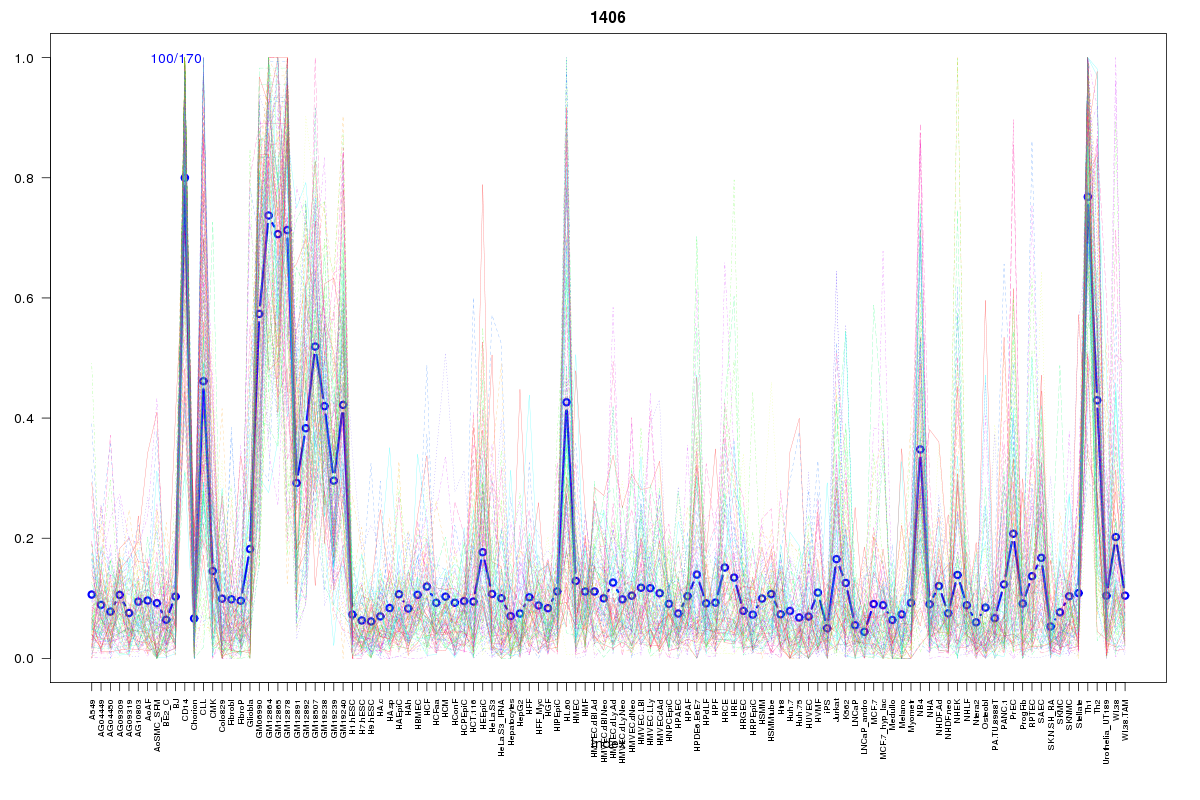 | 1406 | 1 |
 | 430 | 1 |
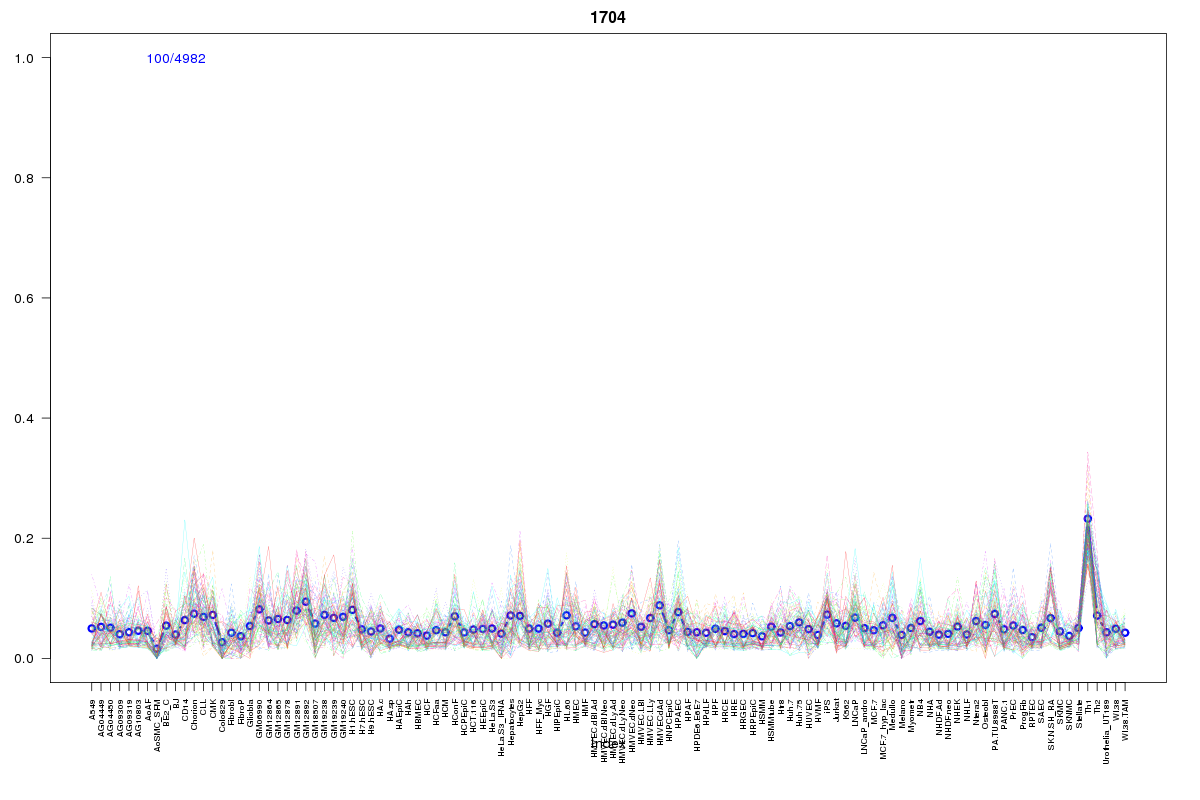 | 1704 | 1 |
 | 579 | 1 |
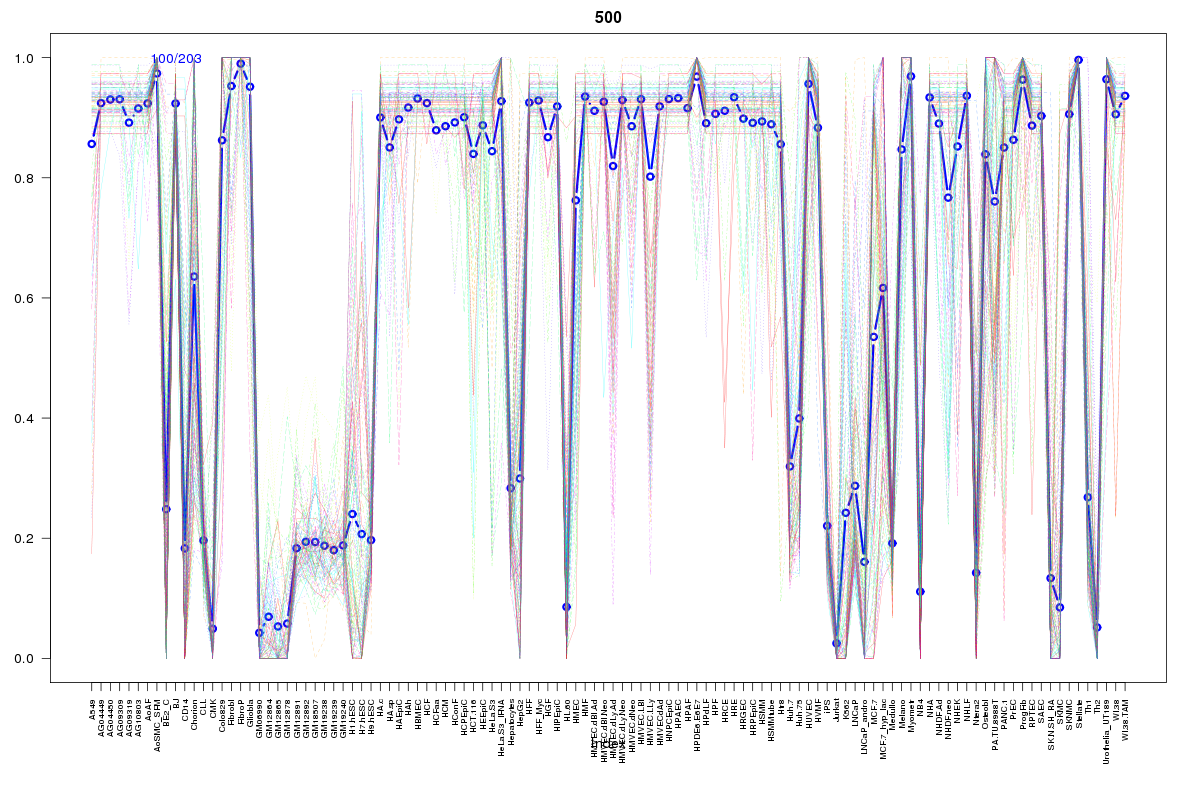 | 500 | 1 |
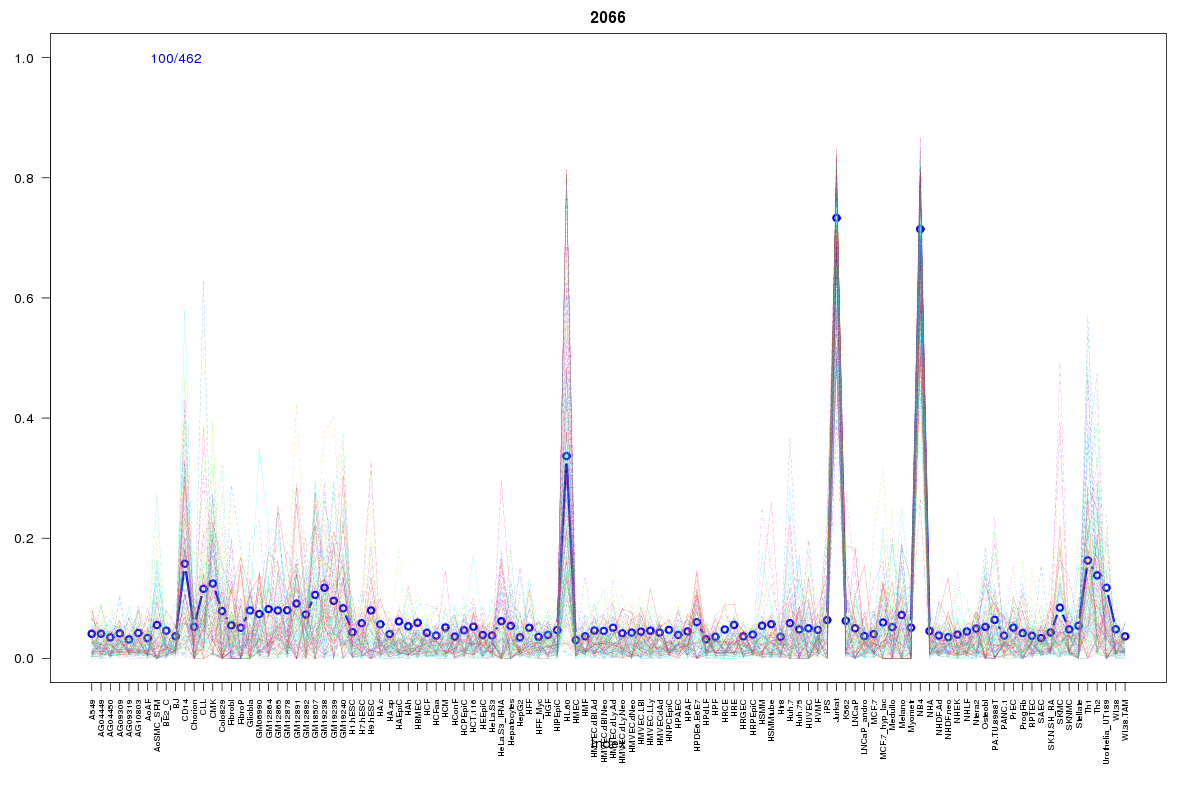 | 2066 | 1 |
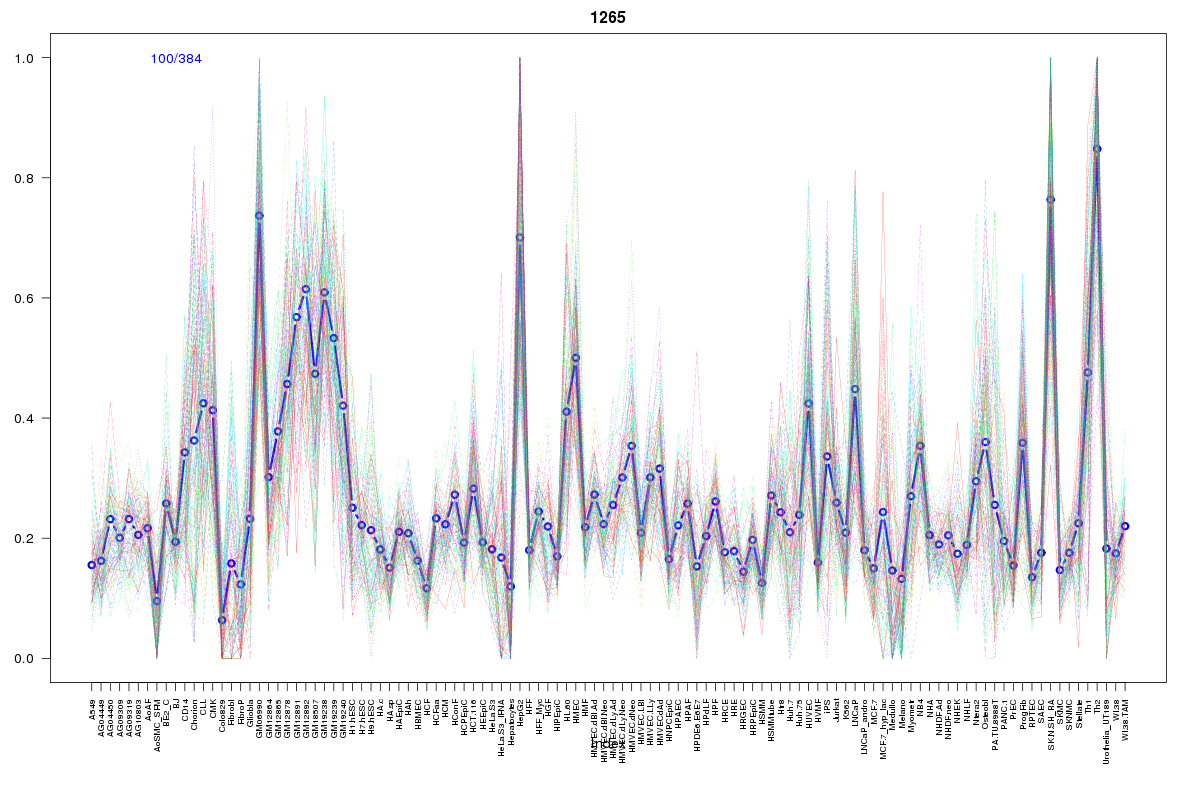 | 1265 | 1 |
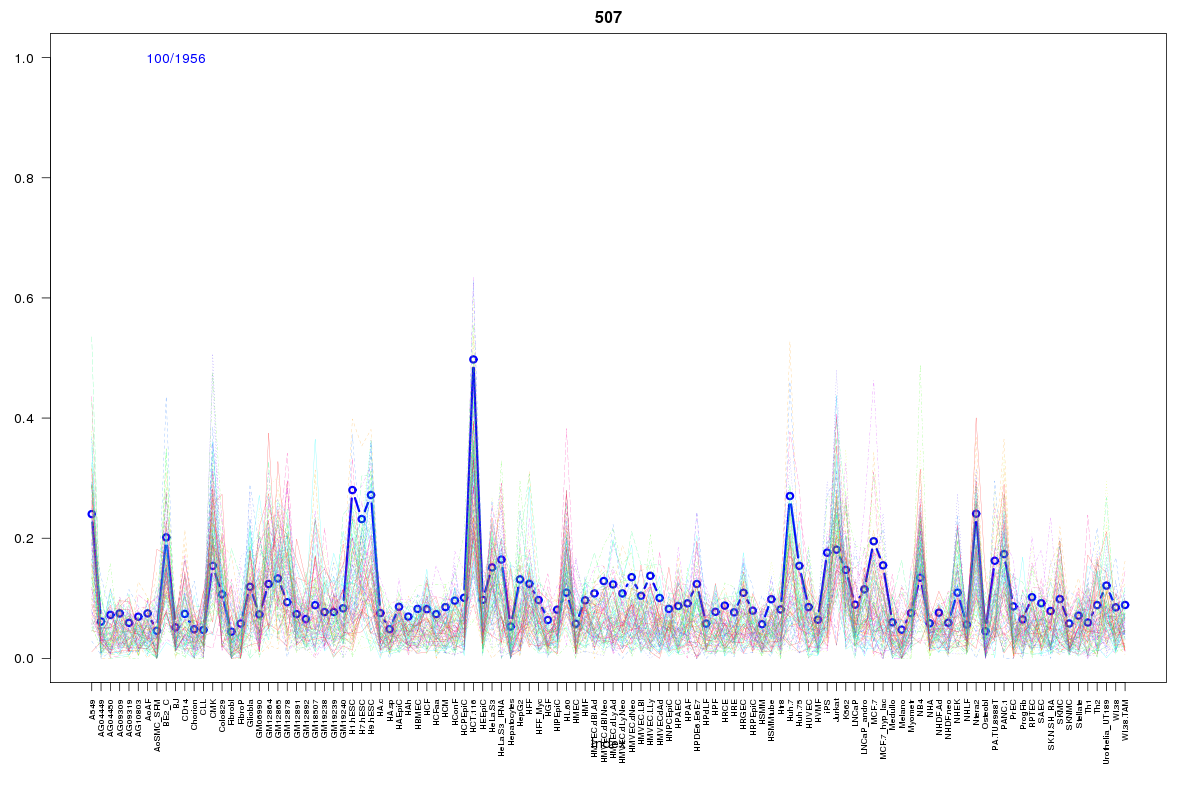 | 507 | 1 |
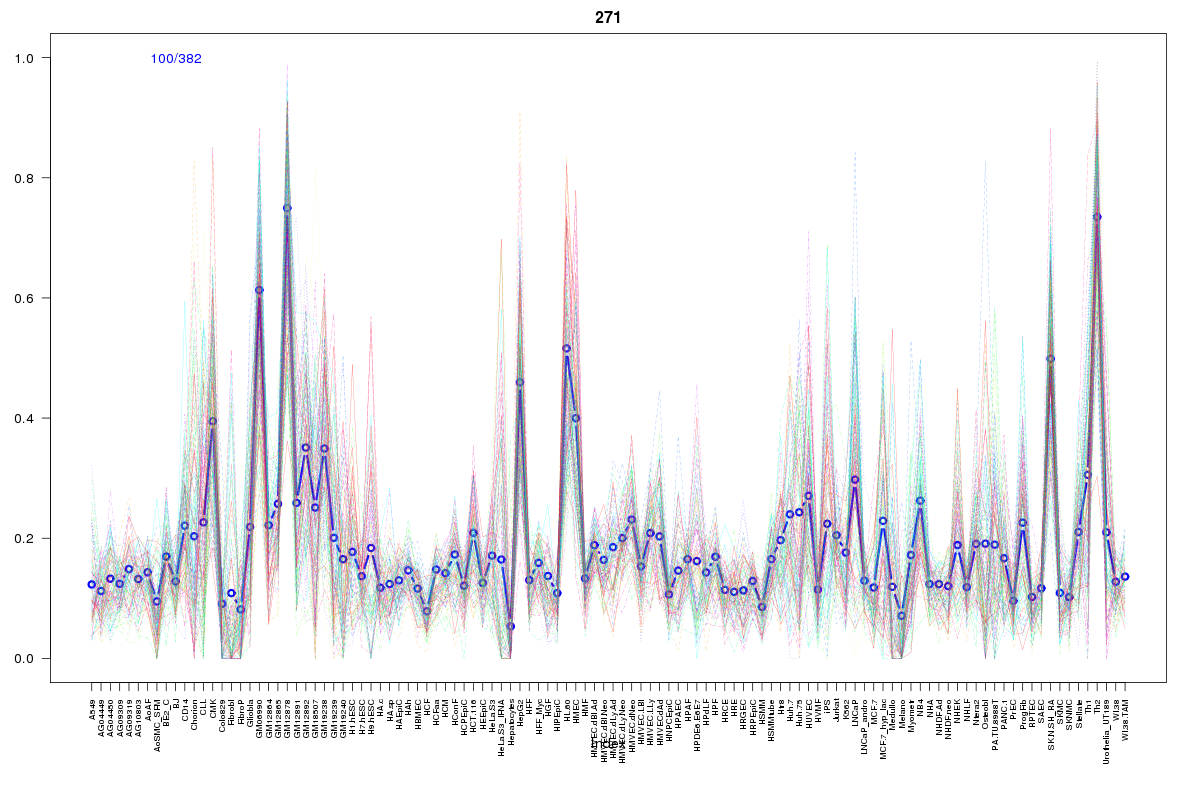 | 271 | 1 |
 | 1078 | 1 |
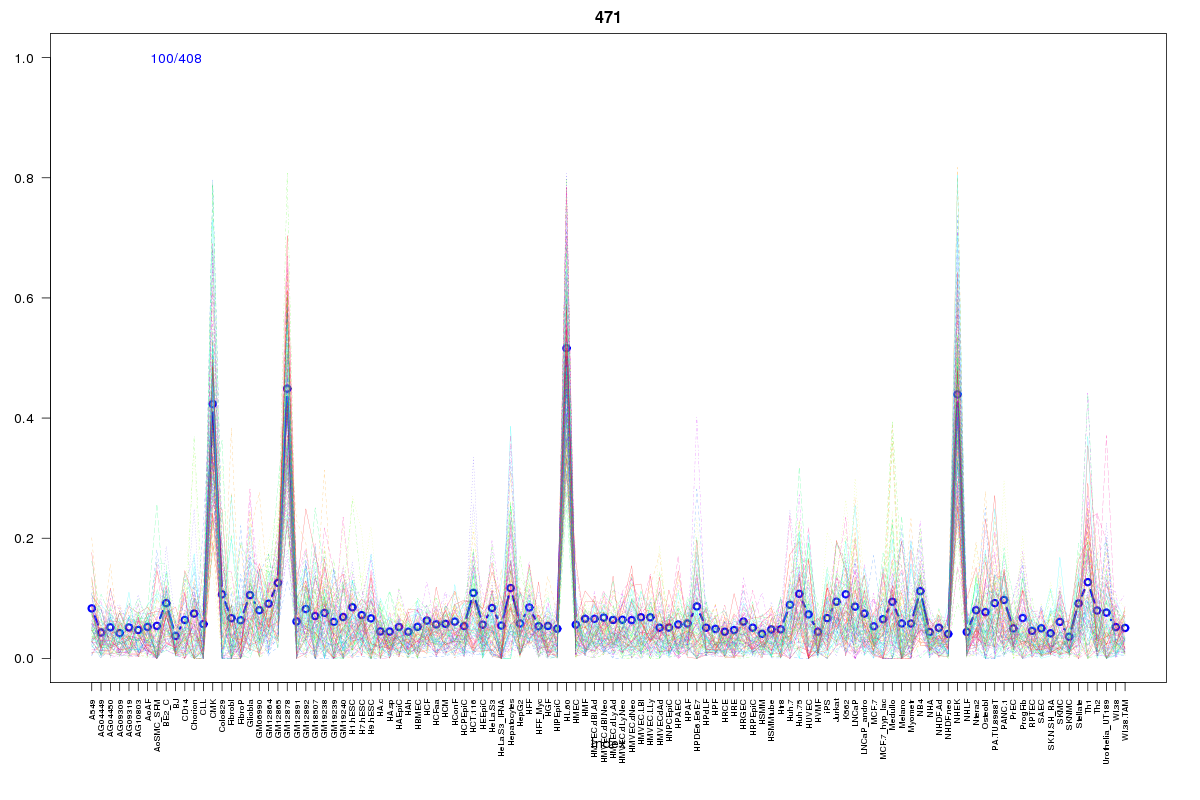 | 471 | 1 |
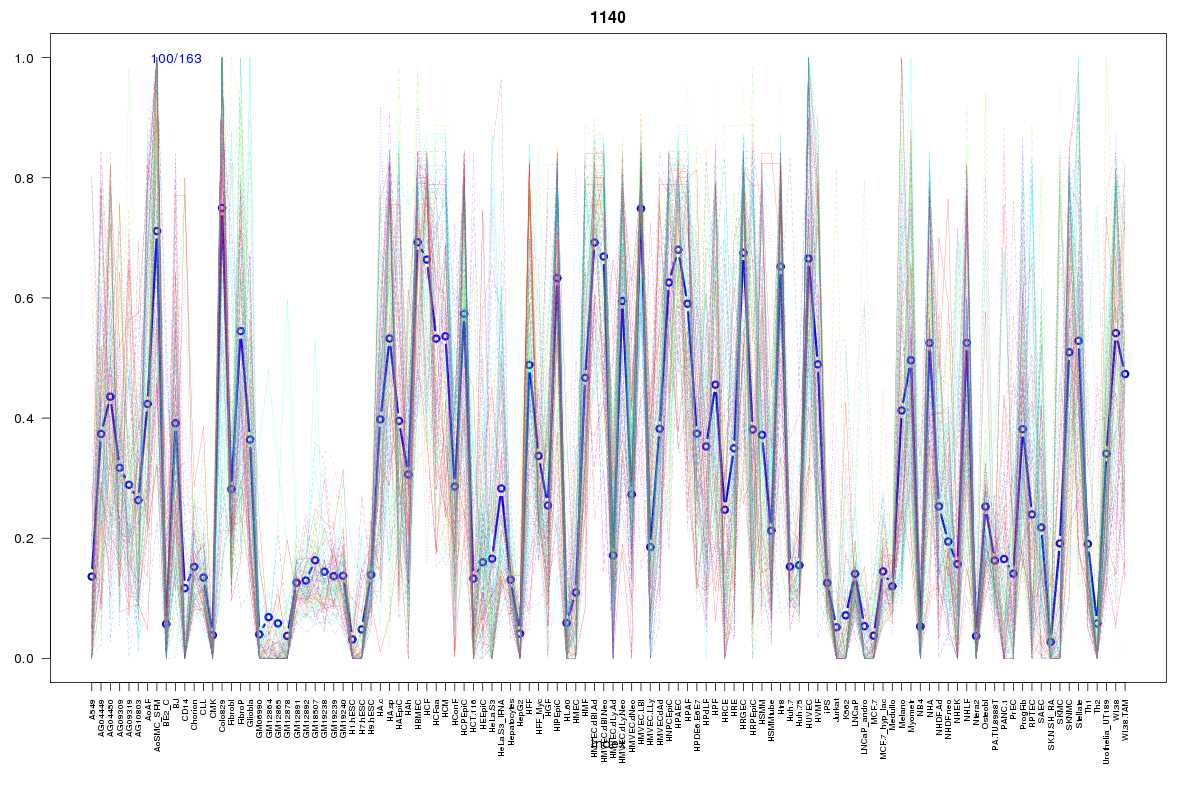 | 1140 | 1 |
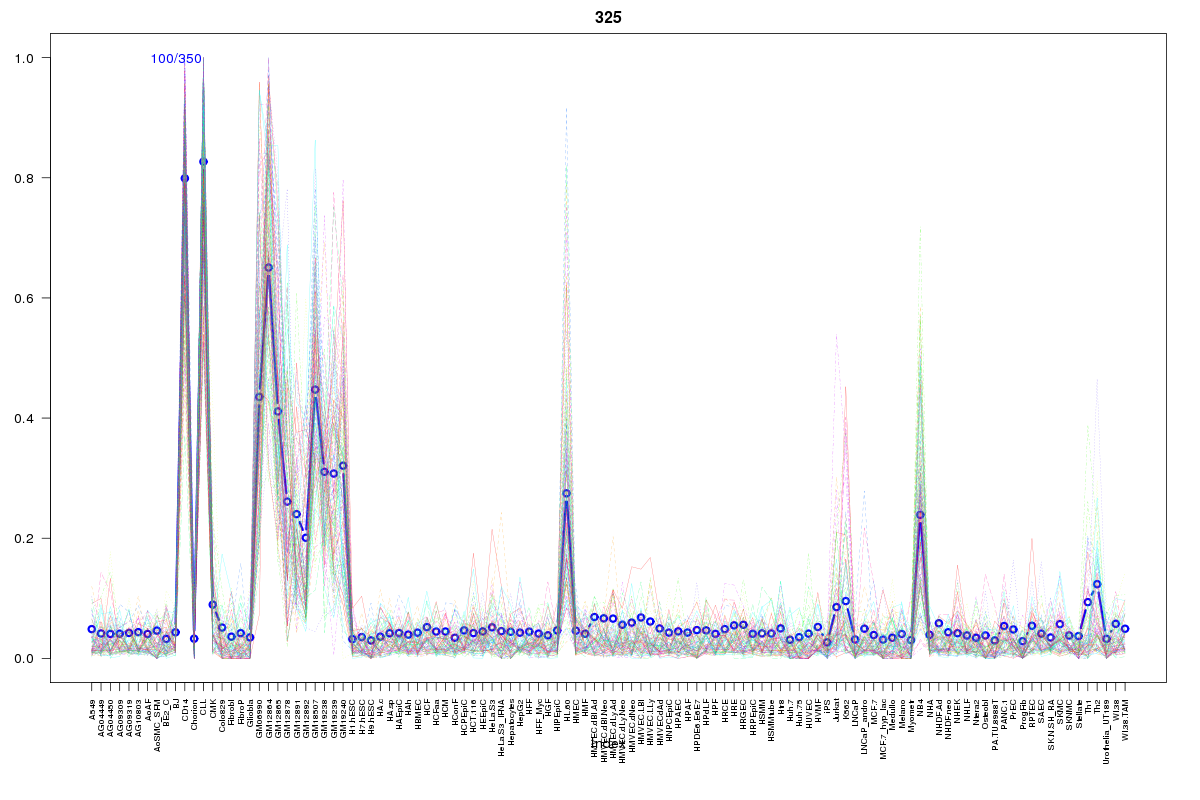 | 325 | 1 |
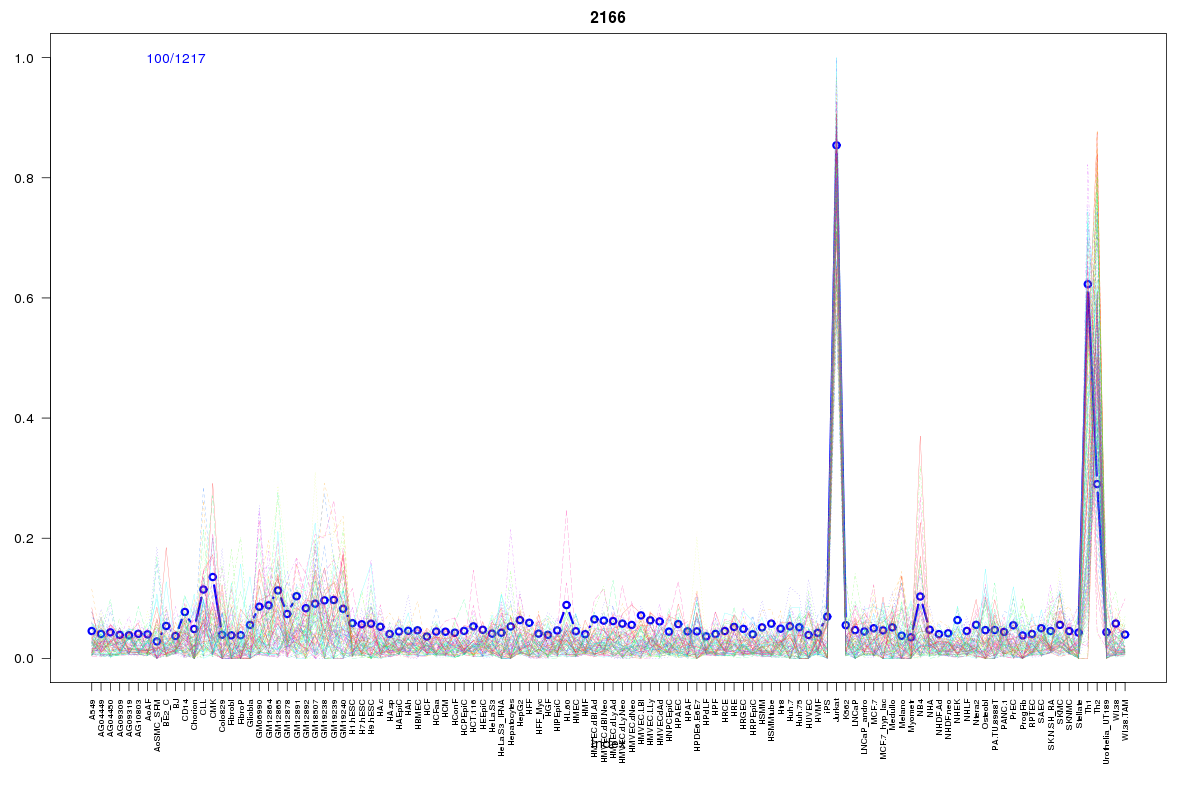 | 2166 | 1 |
 | 2063 | 1 |
 | 324 | 1 |
 | 2012 | 1 |
 | 1056 | 1 |
 | 569 | 1 |
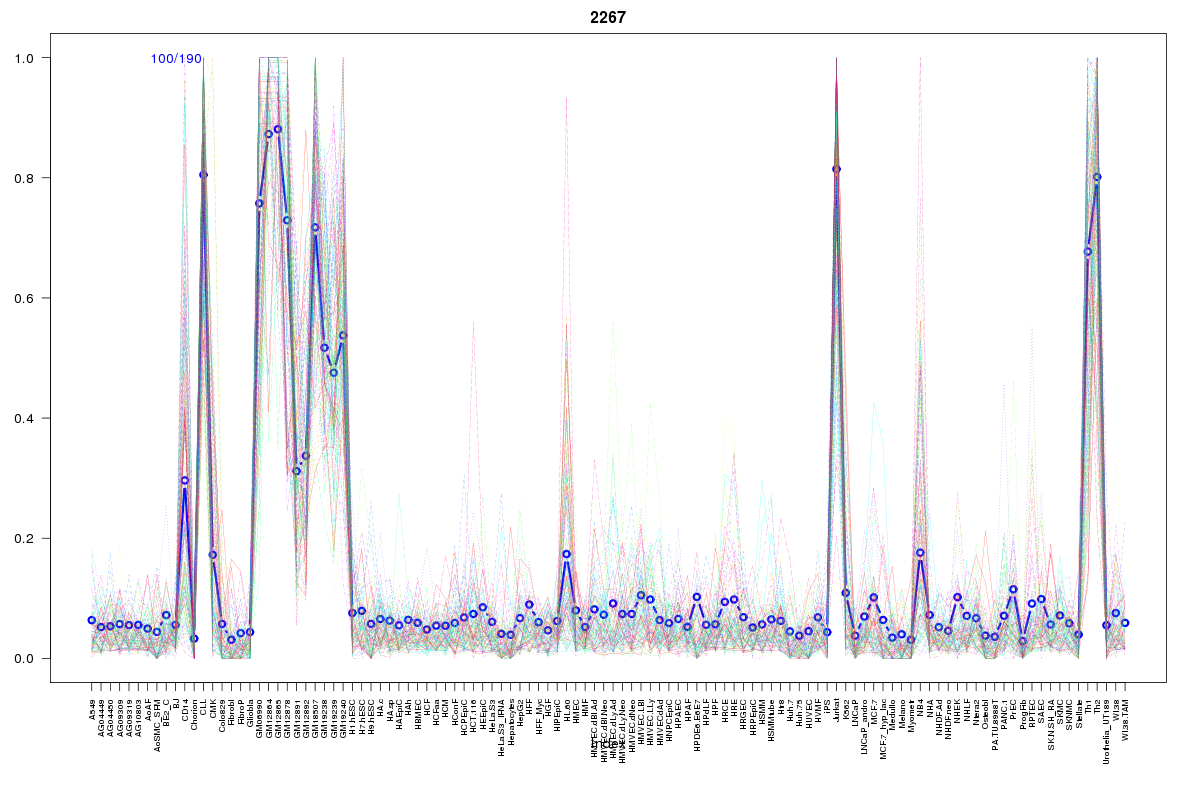 | 2267 | 1 |
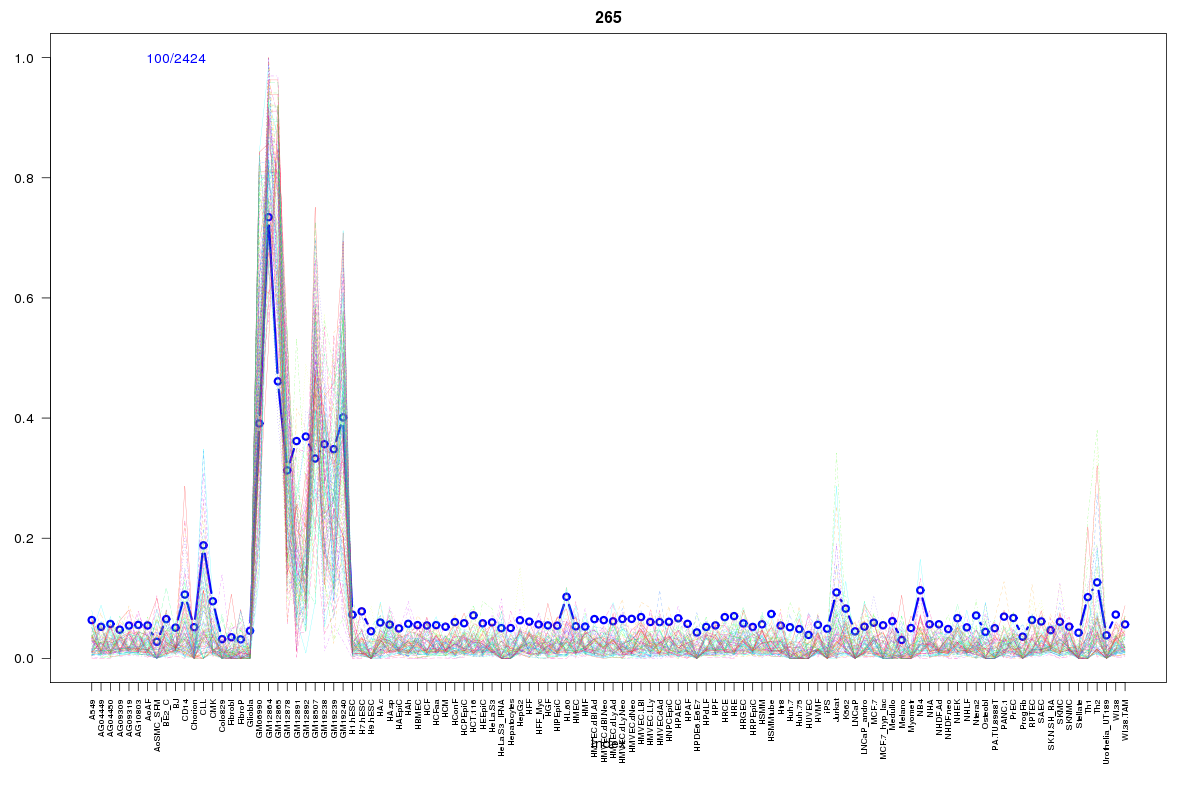 | 265 | 1 |
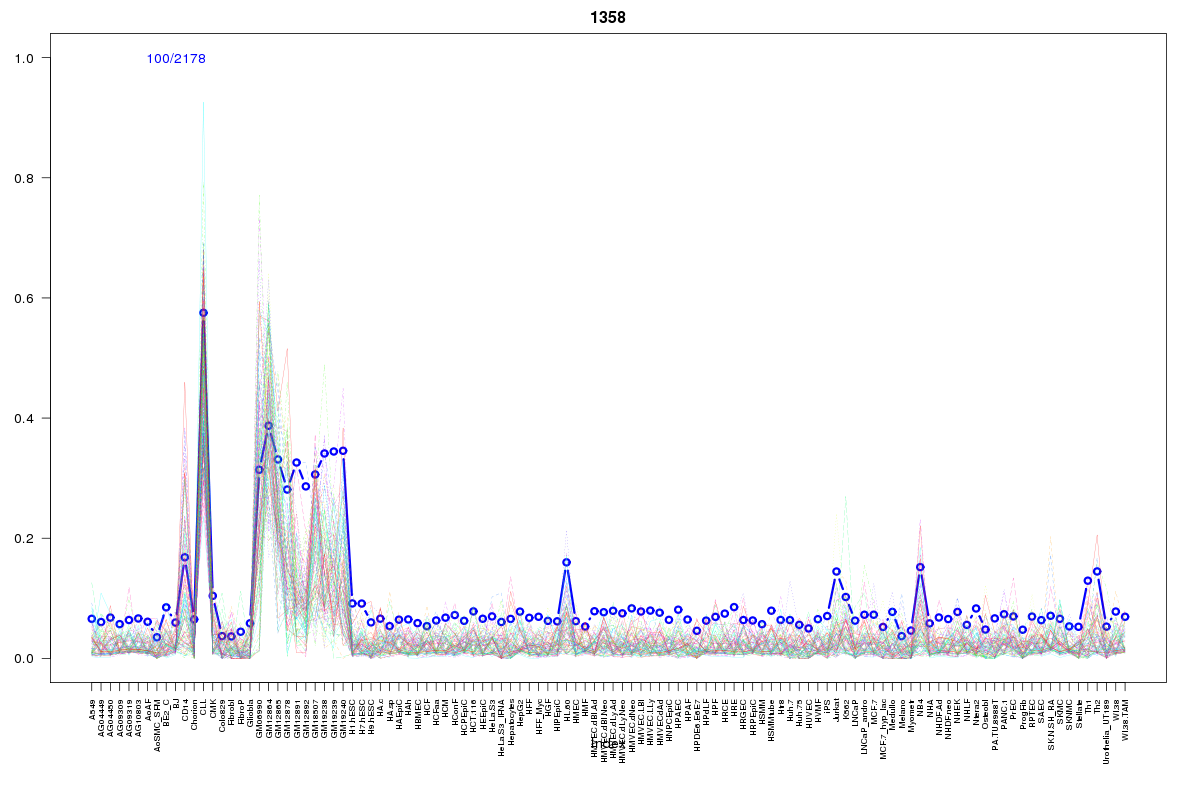 | 1358 | 1 |
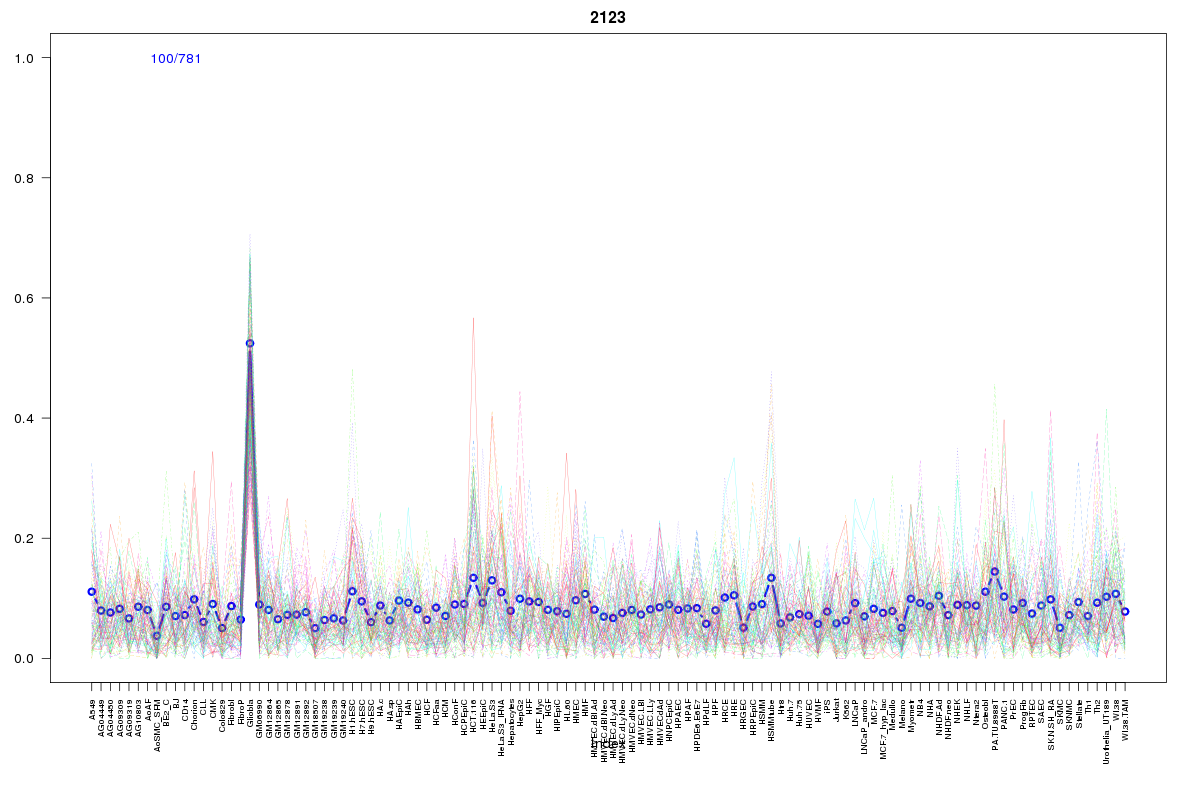 | 2123 | 1 |
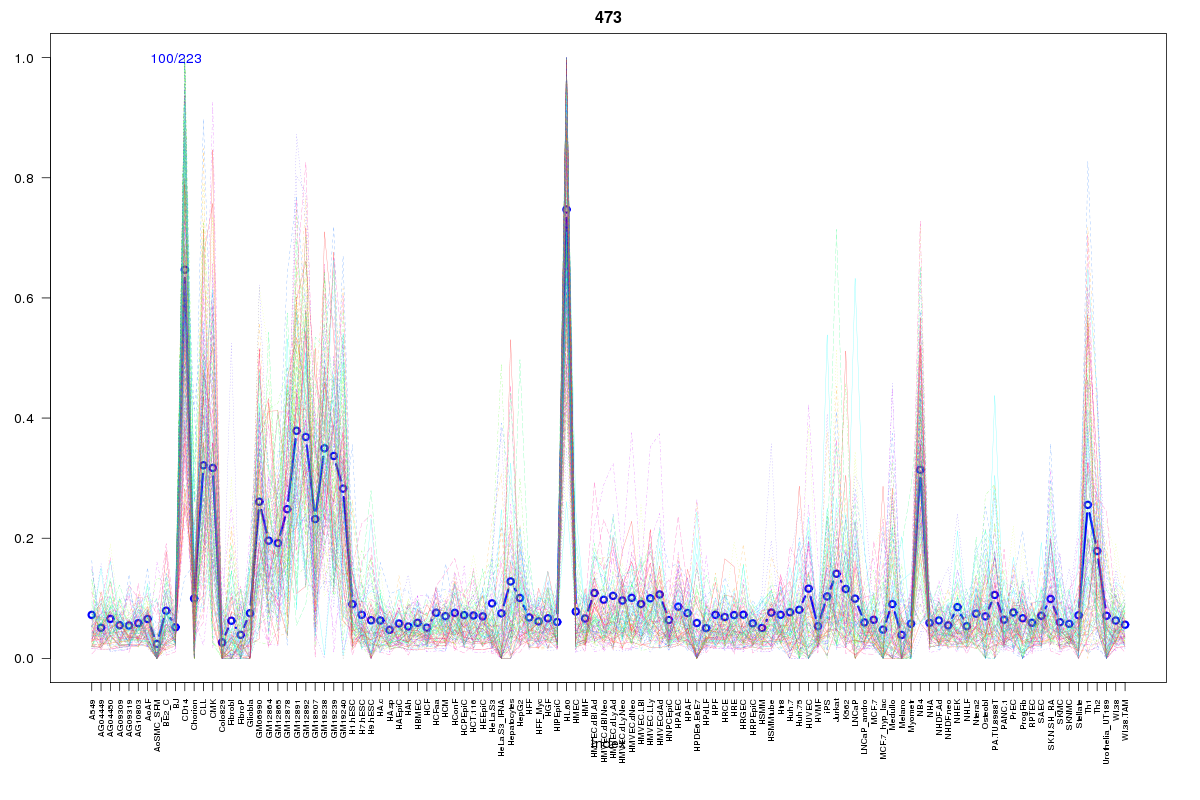 | 473 | 1 |
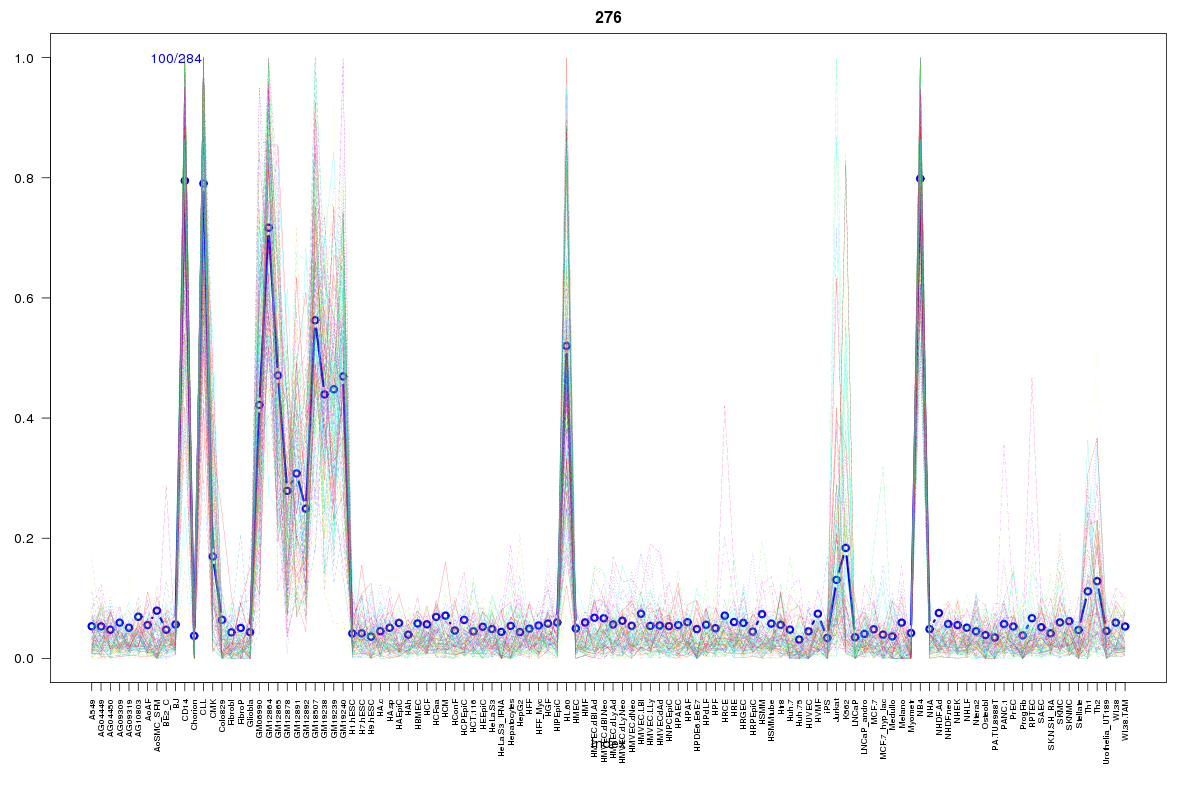 | 276 | 1 |
Resources
BED file downloads
Connects to 79 DHS sitesTop 10 Correlated DHS Sites
p-values indiciate significant higher or lower correlation| Location | Cluster | P-value |
|---|---|---|
| chr7:45018680-45018830 | 25 | 0 |
| chr7:45018525-45018675 | 25 | 0 |
| chr7:45004825-45004975 | 2062 | 0.001 |
| chr7:45017000-45017150 | 25 | 0.001 |
| chr7:45018260-45018410 | 372 | 0.001 |
| chr7:45001885-45002035 | 1604 | 0.002 |
| chr7:45001525-45001675 | 2062 | 0.002 |
| chr7:45001365-45001515 | 1078 | 0.002 |
| chr7:45066600-45066750 | 276 | 0.002 |
| chr7:45020400-45020550 | 2219 | 0.002 |
| chr7:45004605-45004755 | 2122 | 0.002 |
External Databases
UCSCEnsembl (ENSG00000136286)