Gene: AGTPBP1
chr9: 88161454-88356944Expression Profile
(log scale)
Graphical Connections
Distribution of linked clusters:
You may find it interesting if many of the connected DHS sites belong to the same cluster.| Cluster Profile | Cluster ID | Number of DHS sites in this cluster |
|---|---|---|
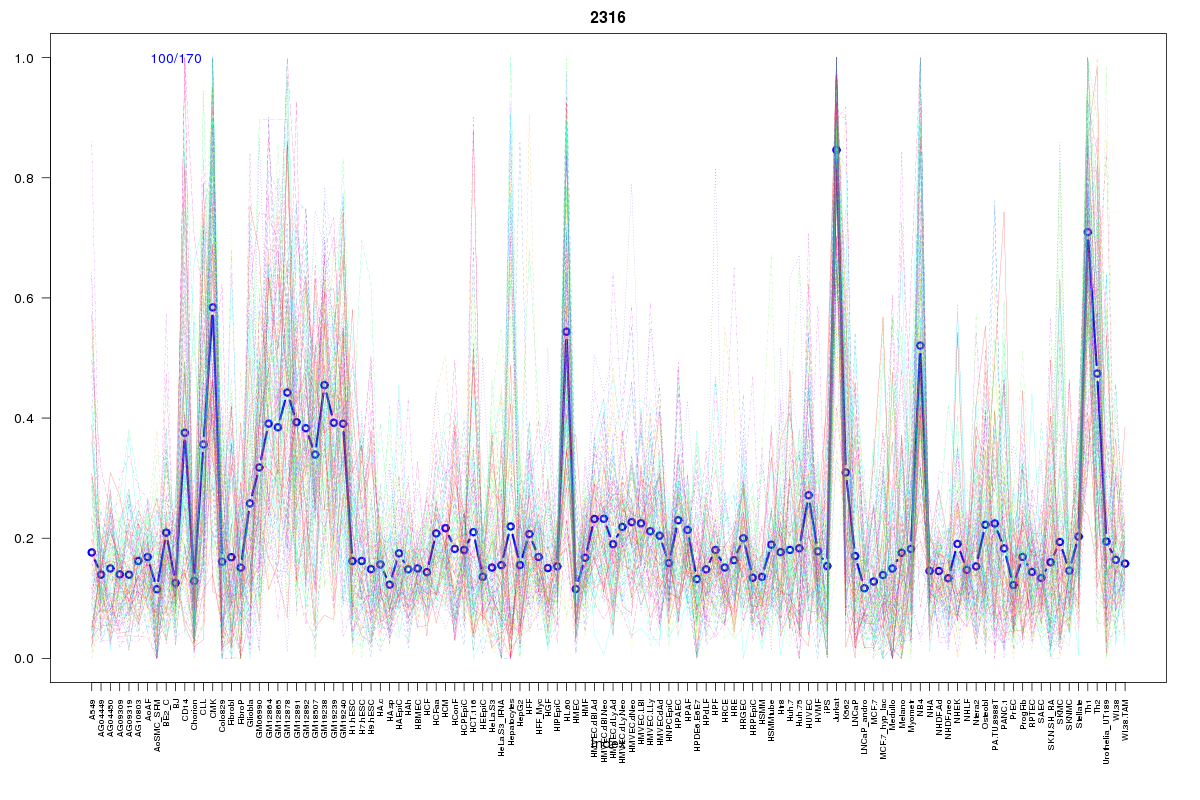 | 2316 | 1 |
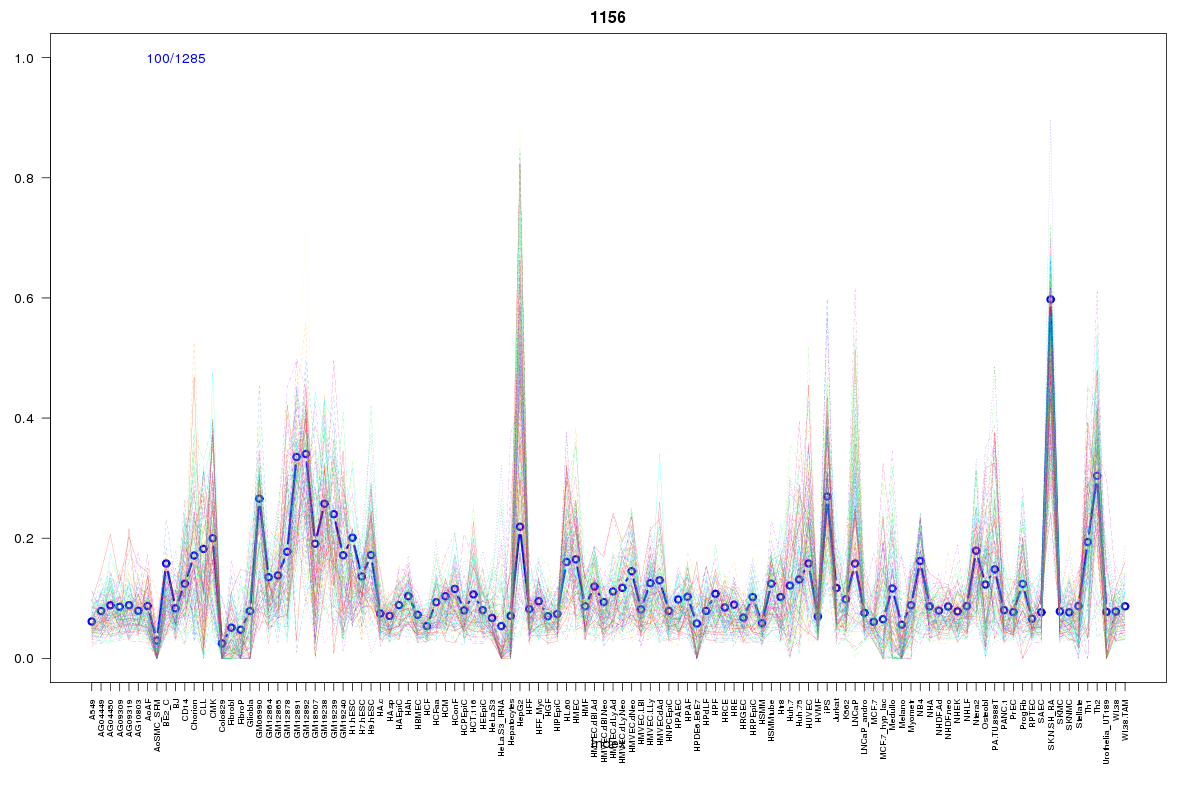 | 1156 | 1 |
 | 1213 | 1 |
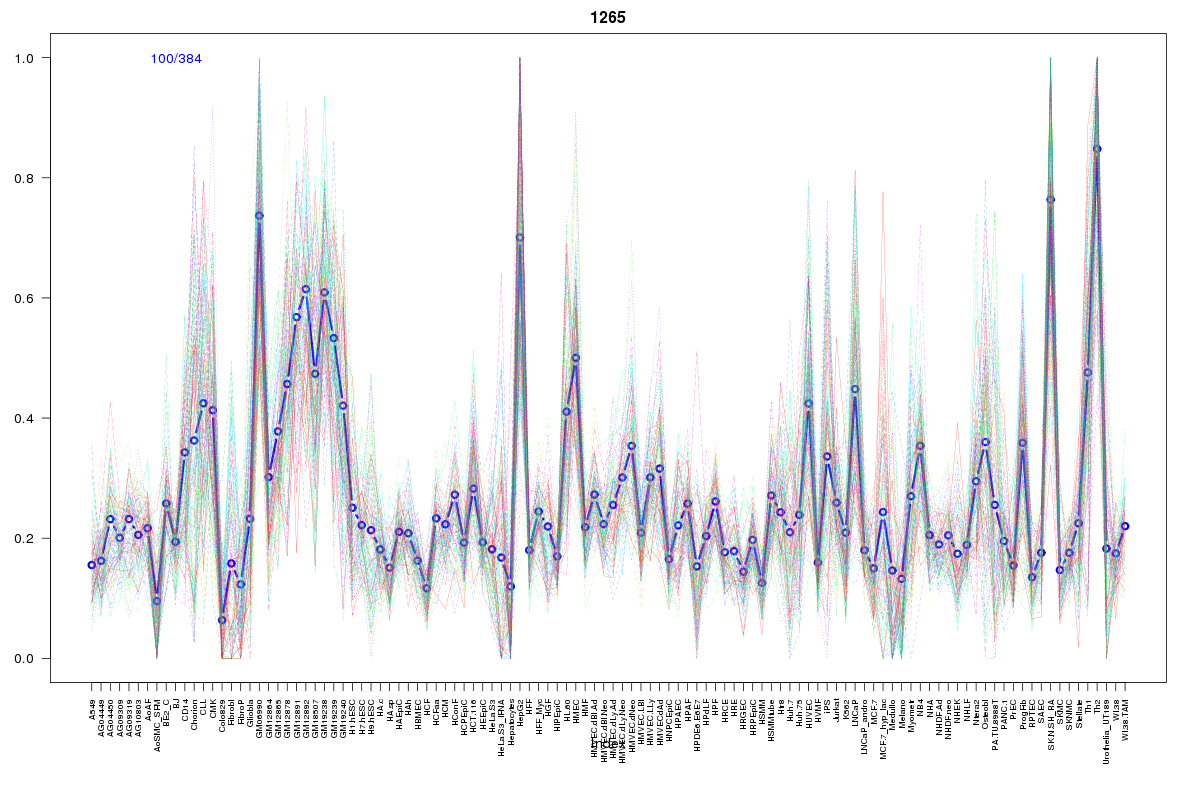 | 1265 | 1 |
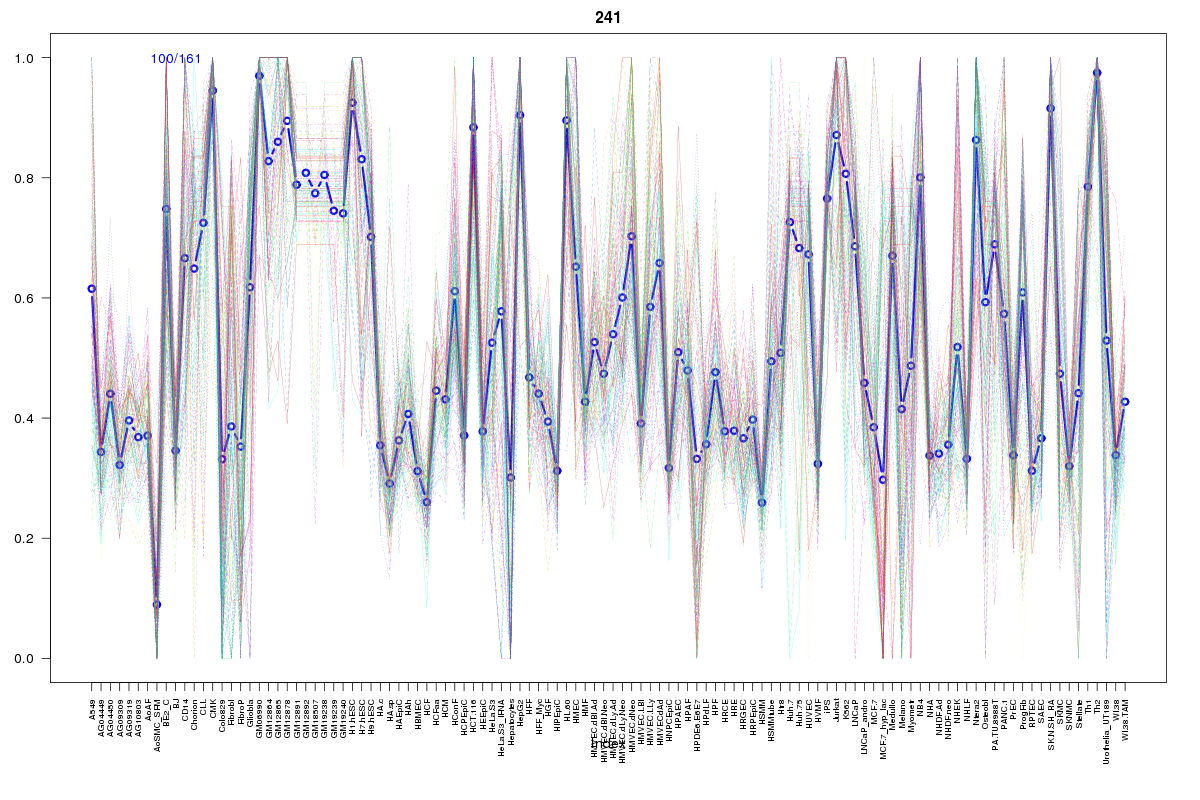 | 241 | 1 |
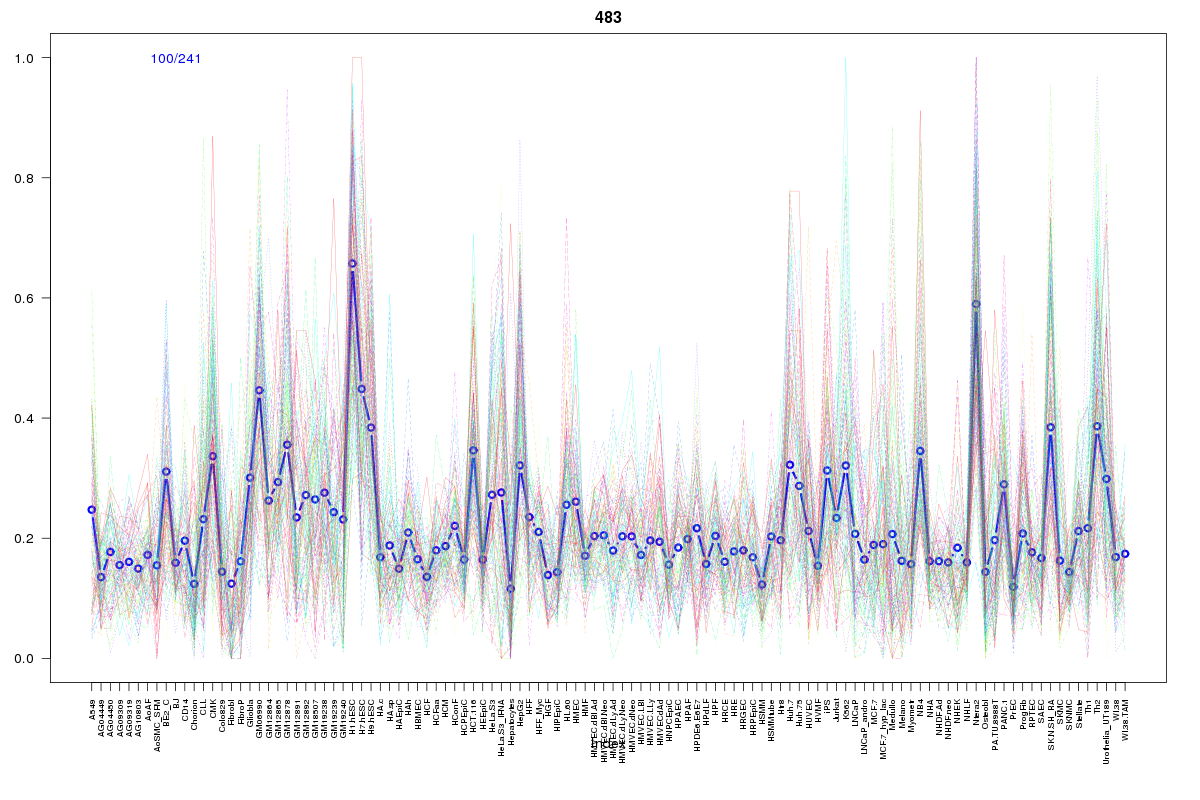 | 483 | 1 |
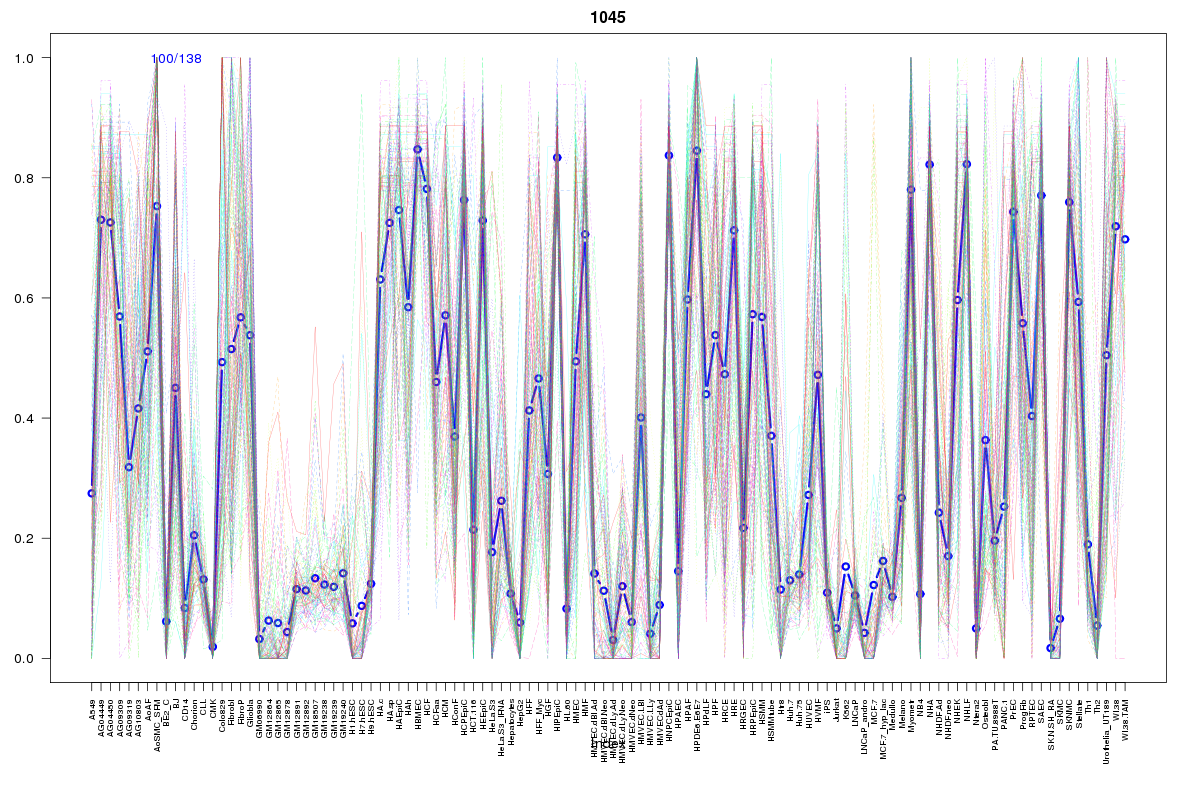 | 1045 | 1 |
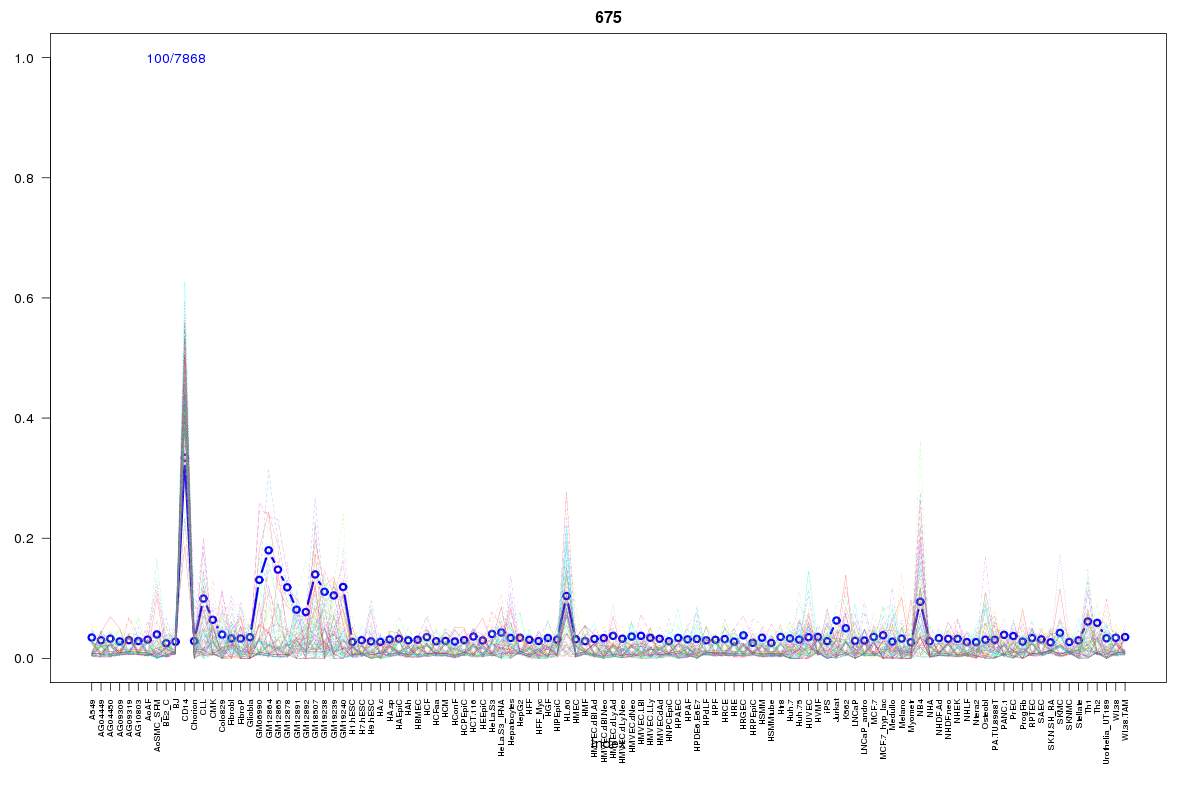 | 675 | 1 |
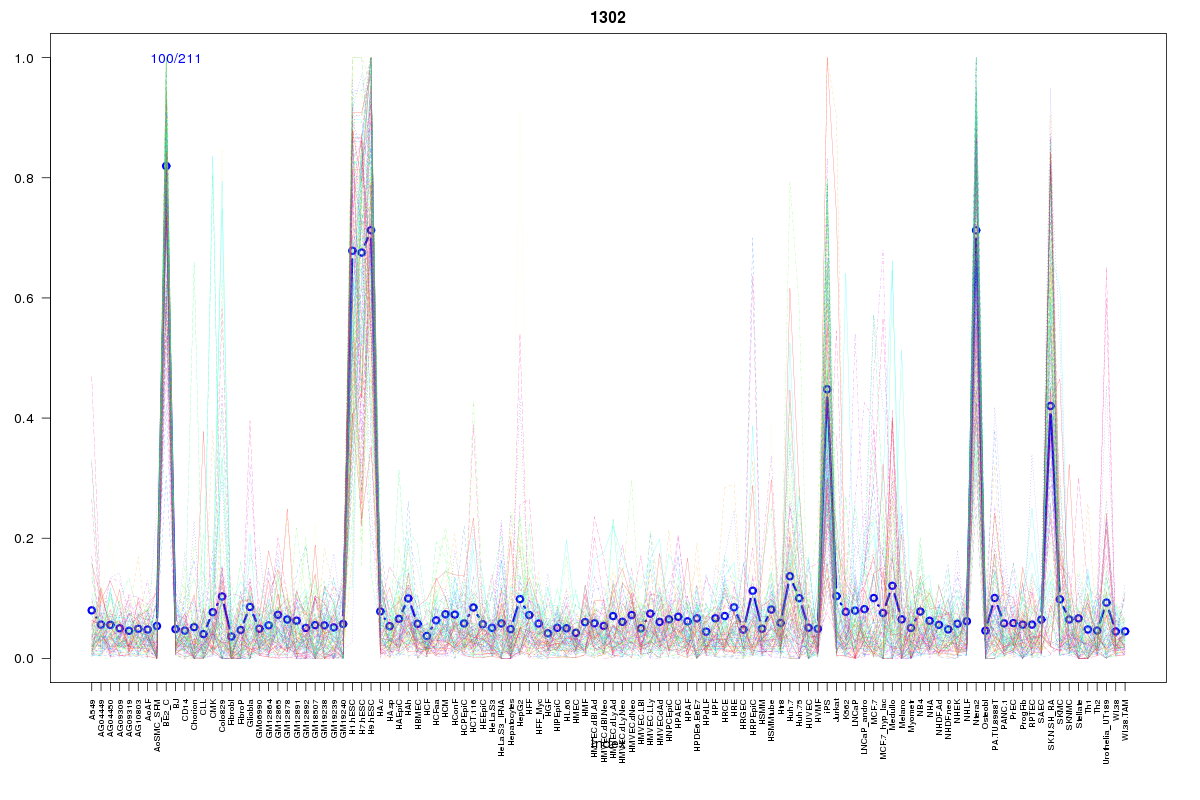 | 1302 | 1 |
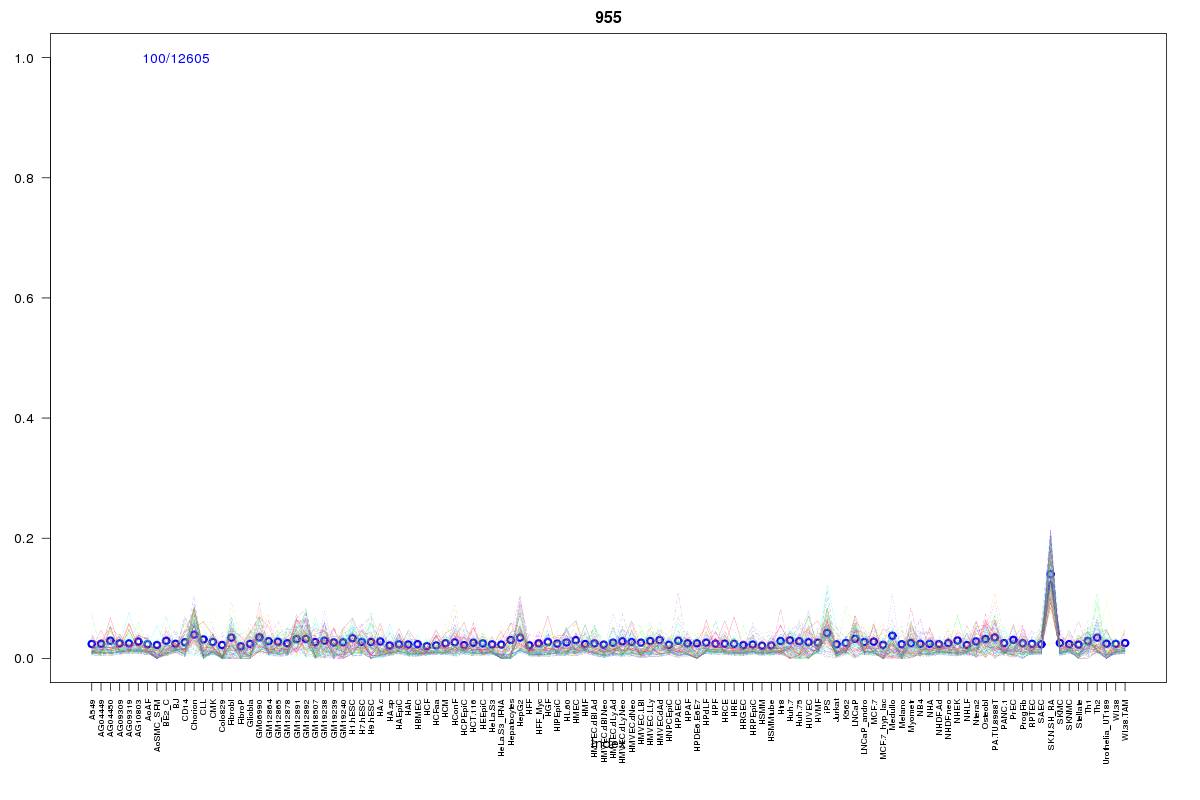 | 955 | 1 |
 | 555 | 1 |
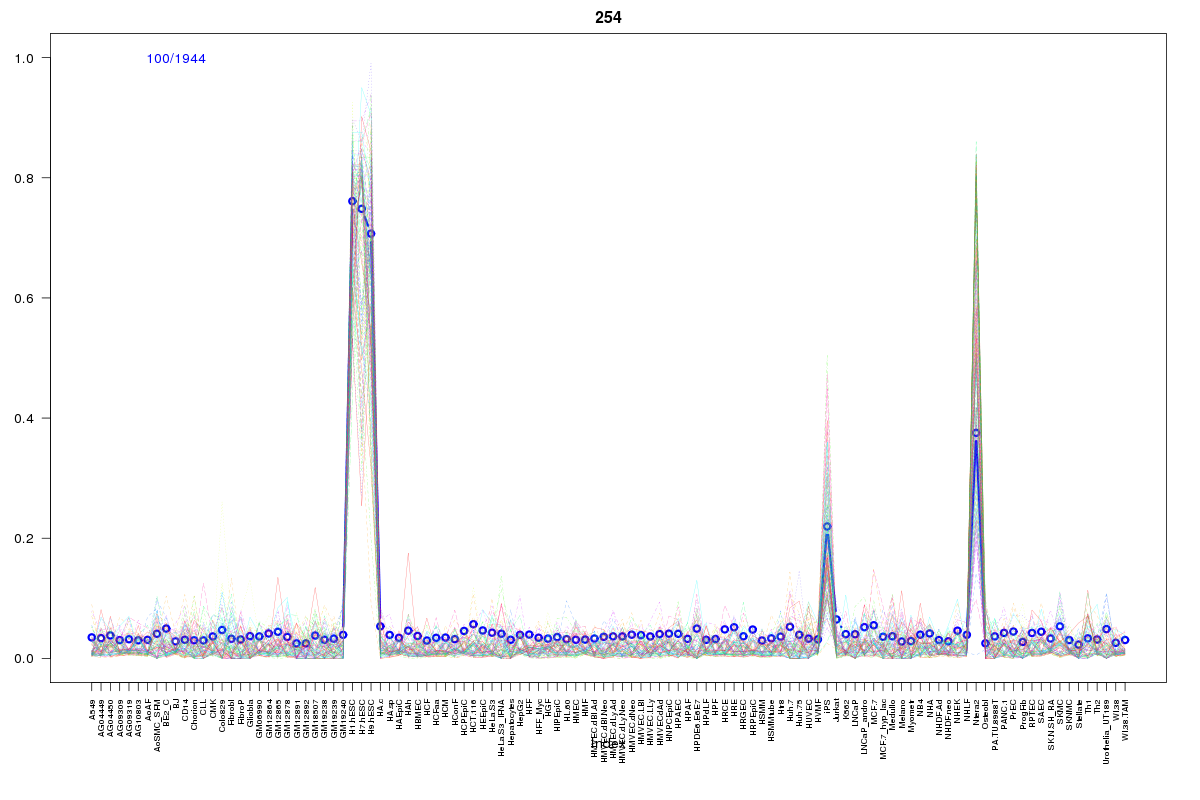 | 254 | 1 |
 | 626 | 1 |
 | 775 | 1 |
Resources
BED file downloads
Connects to 14 DHS sitesTop 10 Correlated DHS Sites
p-values indiciate significant higher or lower correlation| Location | Cluster | P-value |
|---|---|---|
| chr9:88357080-88357230 | 241 | 0 |
| chr9:88355980-88356130 | 2316 | 0 |
| chr9:88357280-88357430 | 483 | 0.007 |
| chr9:88356245-88356395 | 1156 | 0.008 |
| chr9:88355800-88355950 | 775 | 0.01 |
| chr9:88356560-88356710 | 1265 | 0.013 |
| chr9:88356400-88356550 | 1213 | 0.013 |
| chr9:88216020-88216170 | 1302 | 0.014 |
| chr9:88313360-88313510 | 555 | 0.016 |
| chr9:88359500-88359650 | 675 | 0.016 |
| chr9:88338300-88338450 | 254 | 0.022 |
External Databases
UCSCEnsembl (ENSG00000135049)