Gene: AGAP3
chr7: 150782917-150814863Expression Profile
(log scale)
Graphical Connections
Distribution of linked clusters:
You may find it interesting if many of the connected DHS sites belong to the same cluster.| Cluster Profile | Cluster ID | Number of DHS sites in this cluster |
|---|---|---|
 | 615 | 3 |
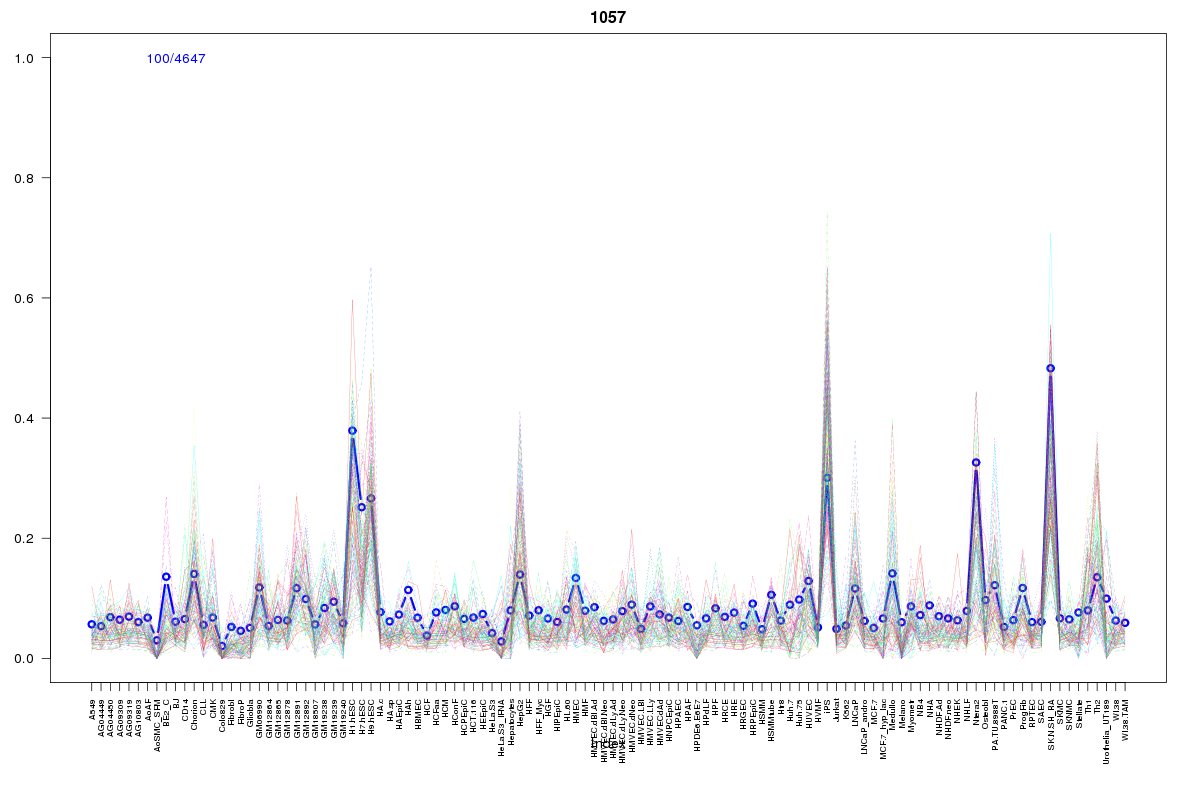 | 1057 | 2 |
 | 1078 | 2 |
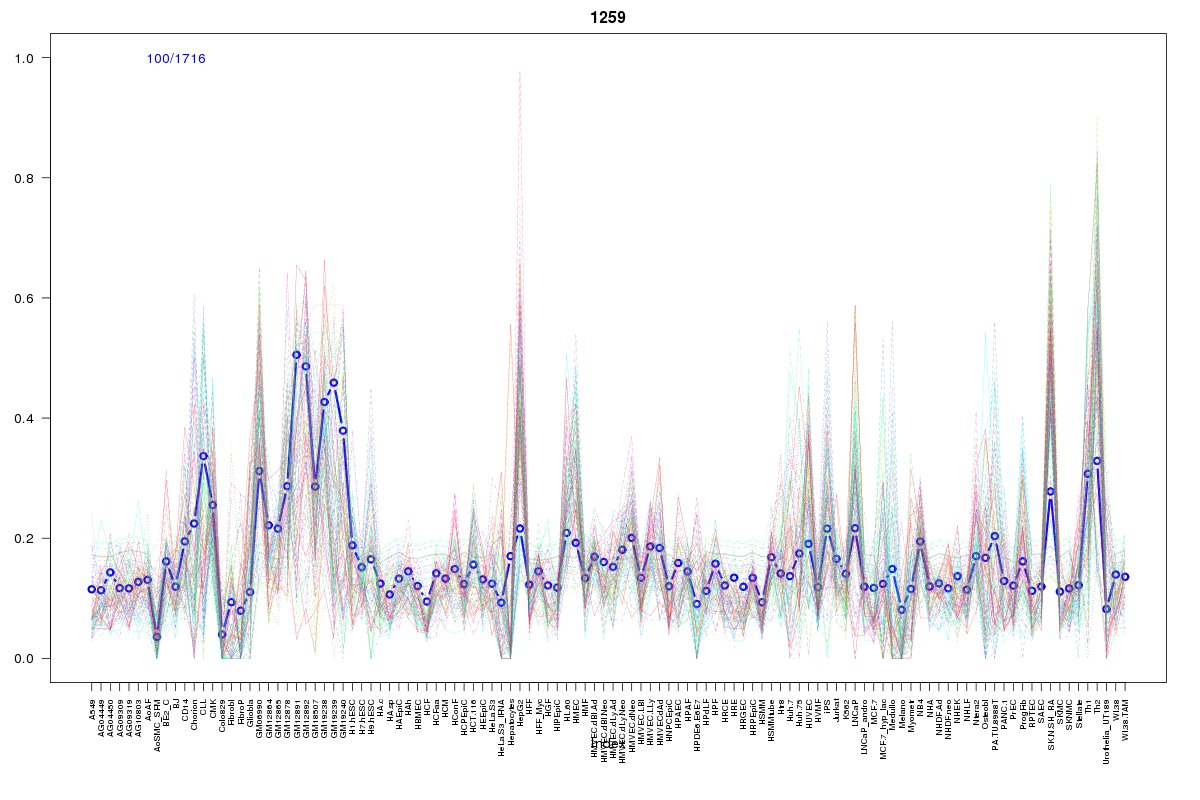 | 1259 | 2 |
 | 1970 | 2 |
 | 2055 | 2 |
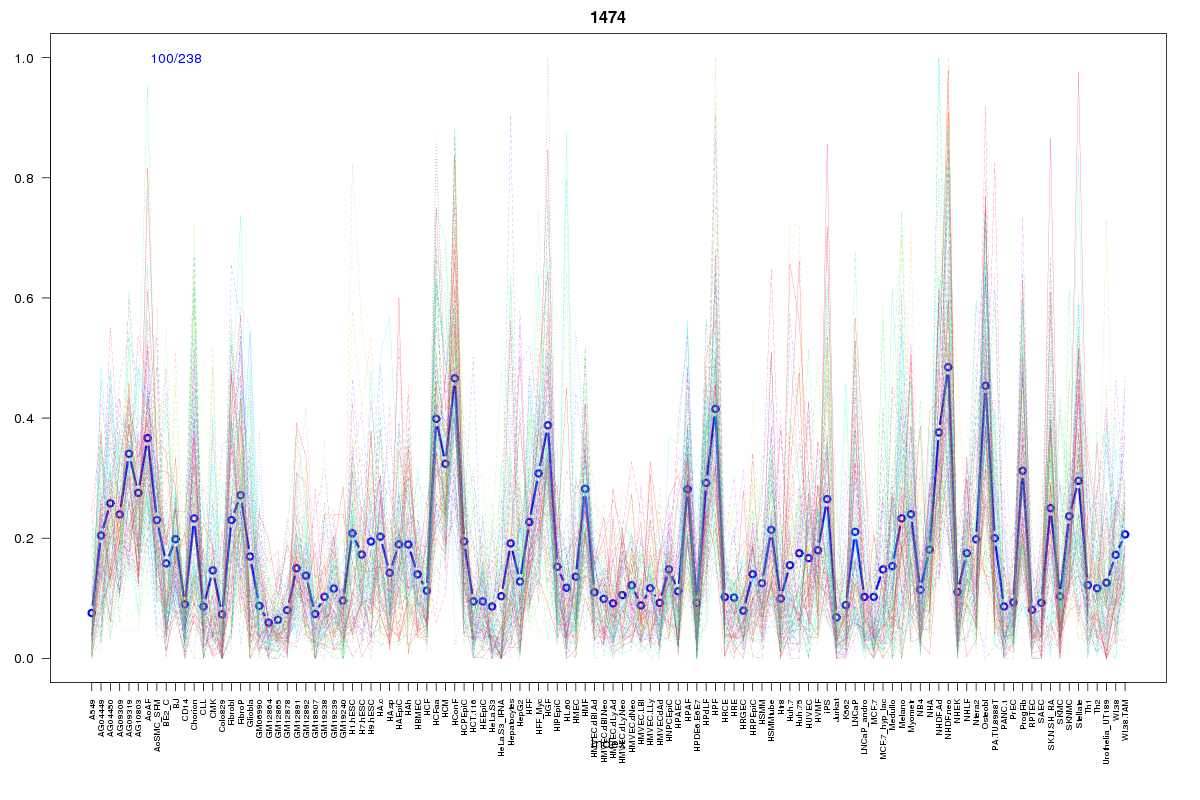 | 1474 | 1 |
 | 881 | 1 |
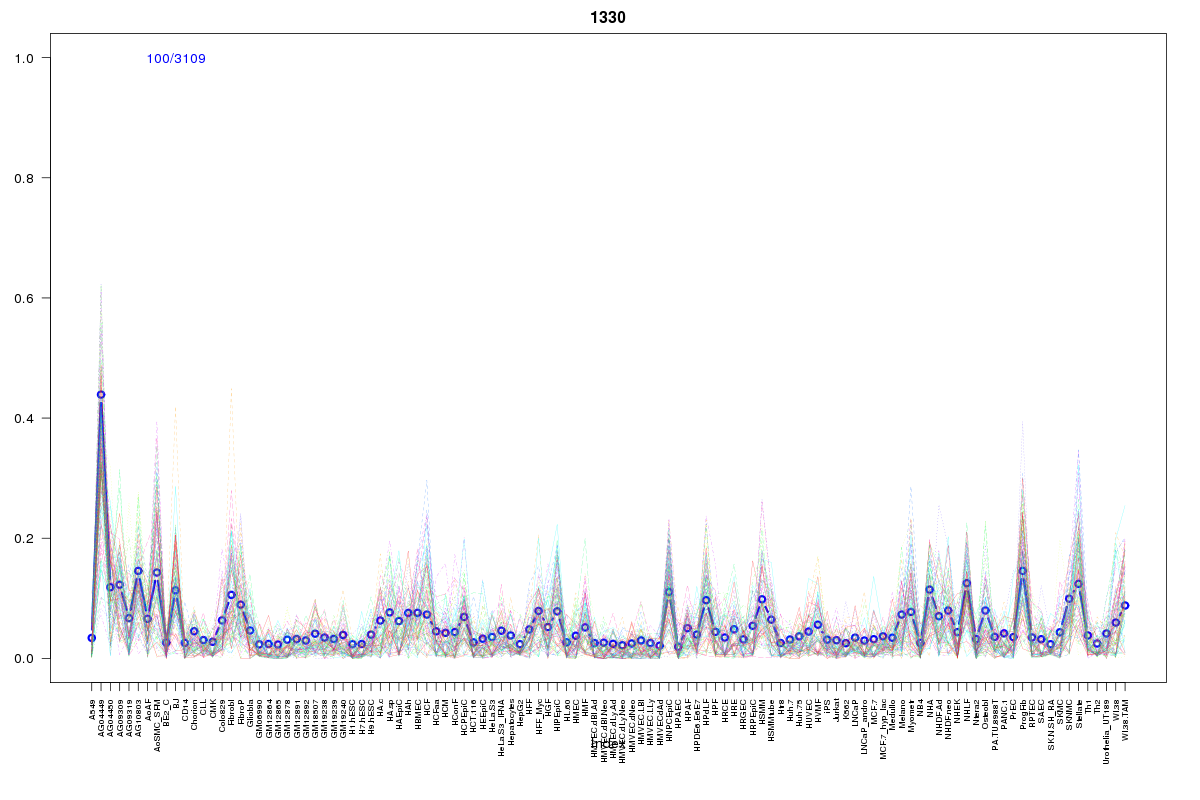 | 1330 | 1 |
 | 2052 | 1 |
 | 1213 | 1 |
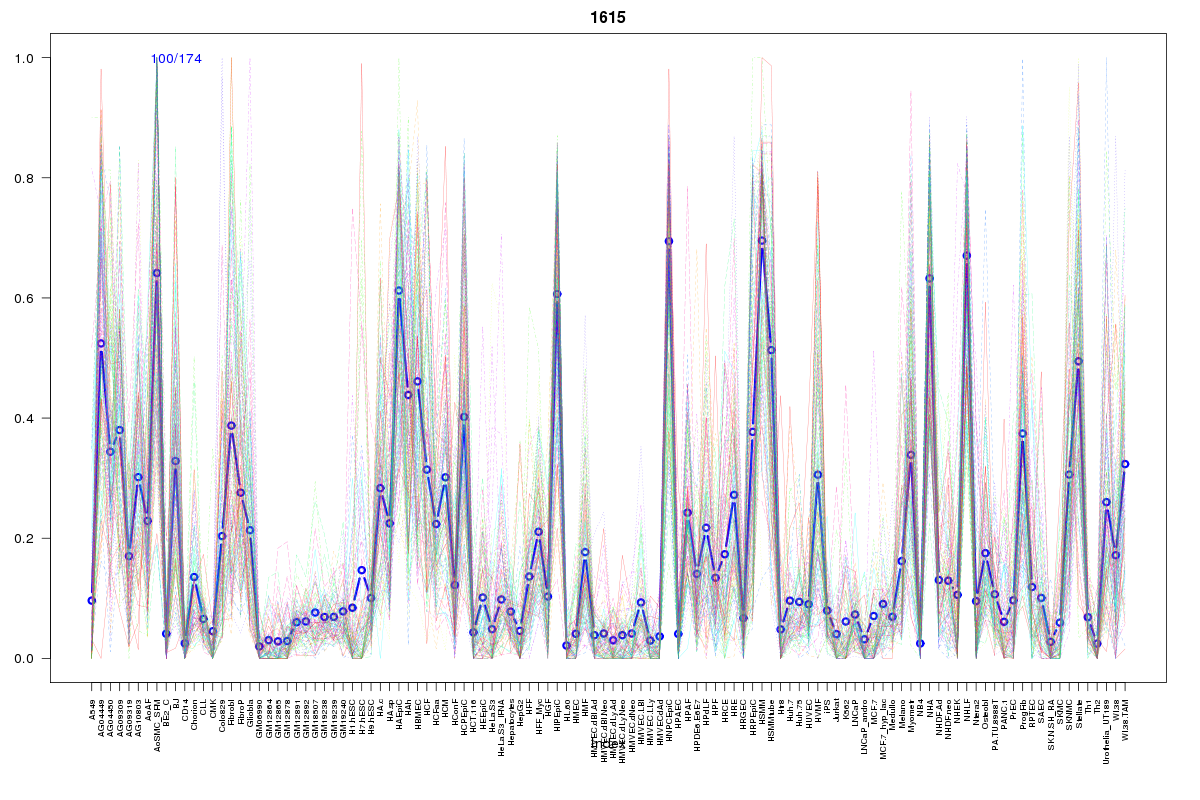 | 1615 | 1 |
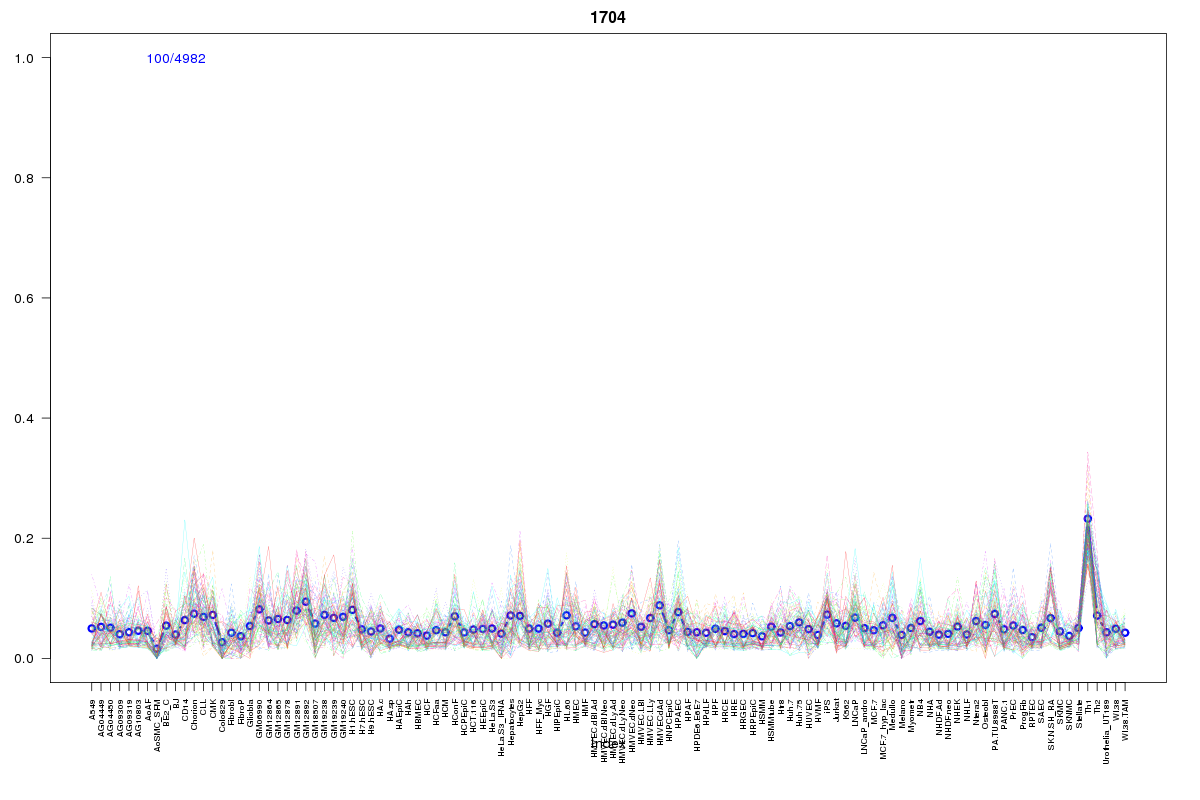 | 1704 | 1 |
 | 1225 | 1 |
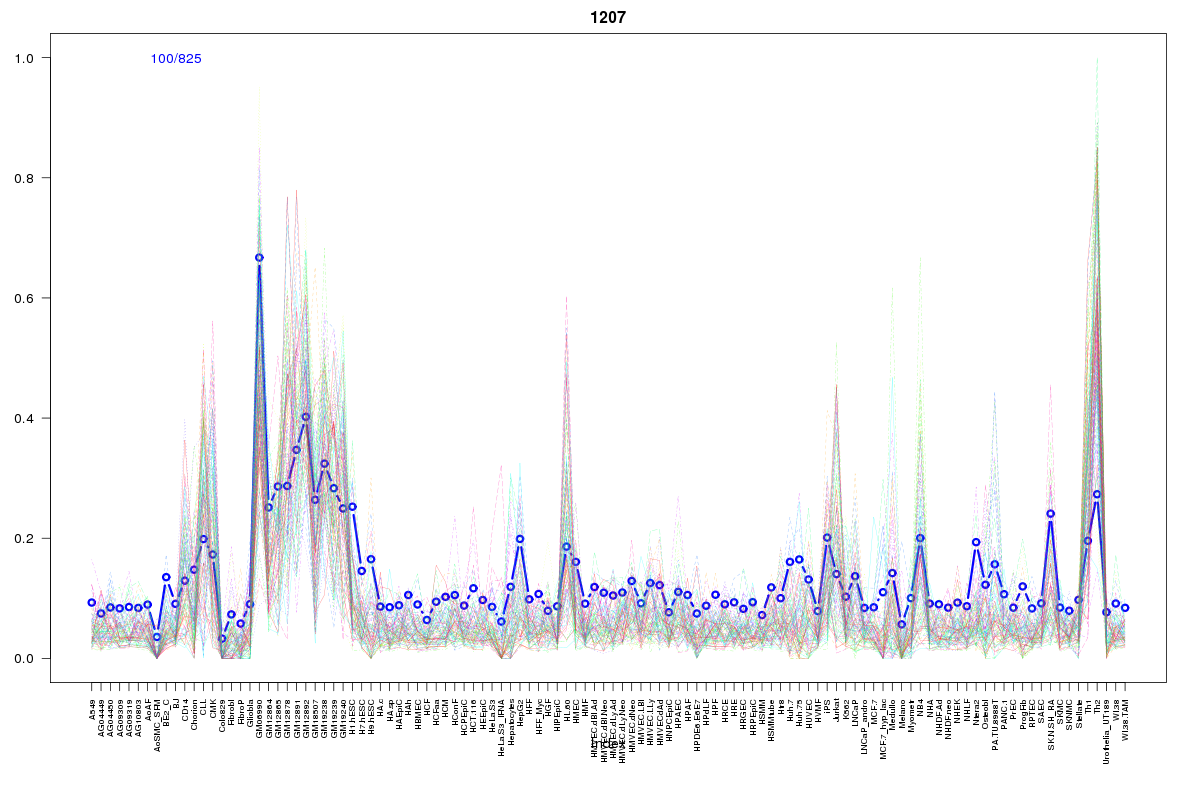 | 1207 | 1 |
 | 687 | 1 |
 | 2122 | 1 |
 | 739 | 1 |
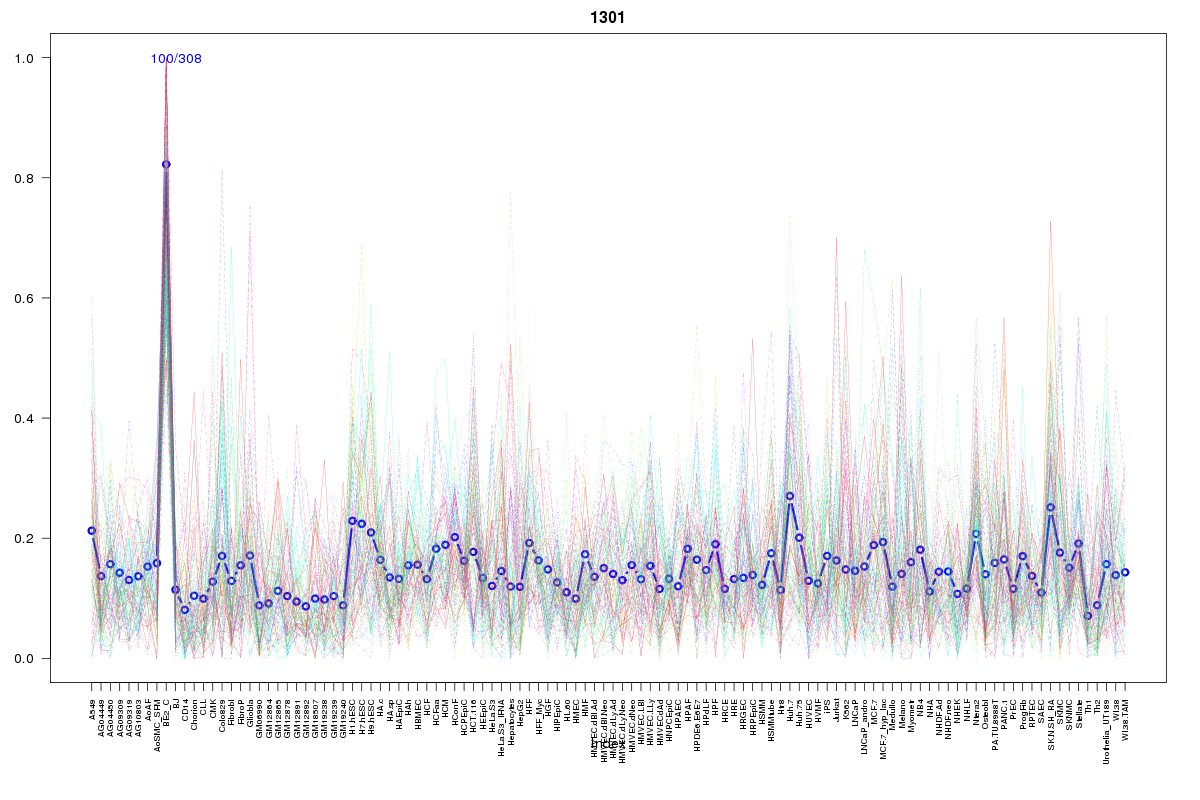 | 1301 | 1 |
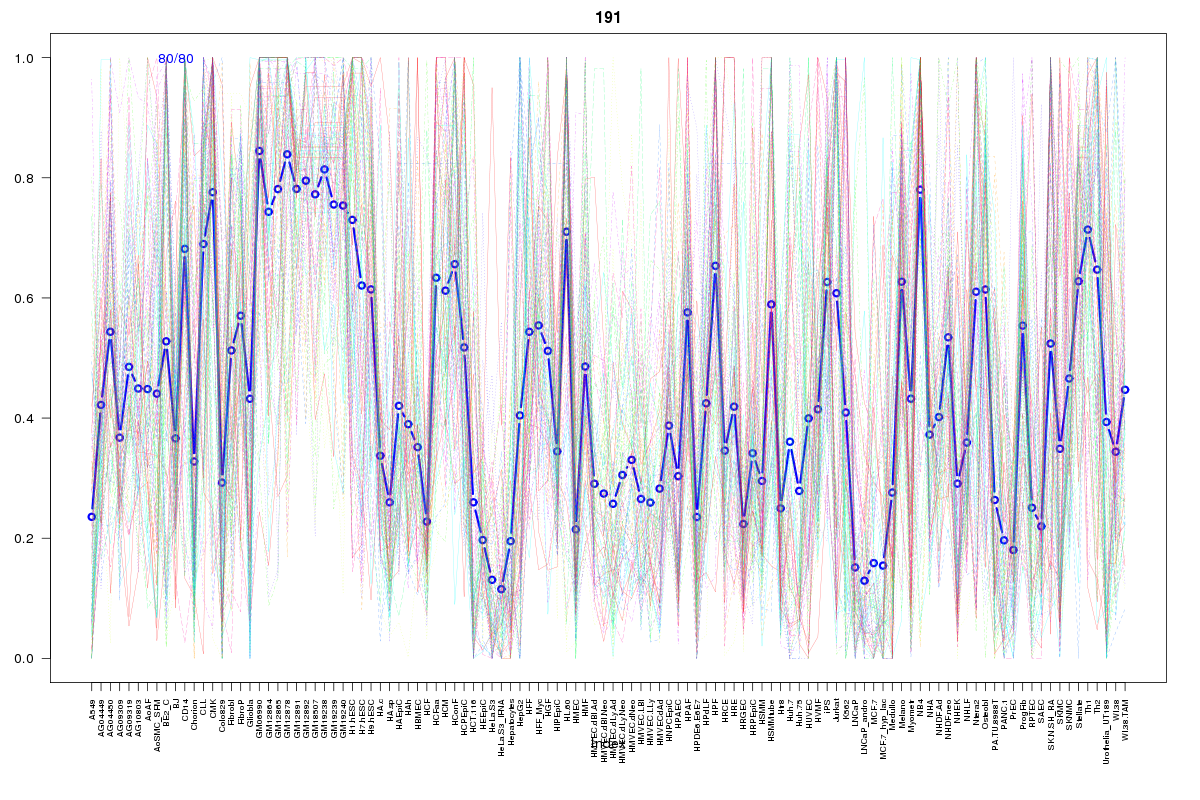 | 191 | 1 |
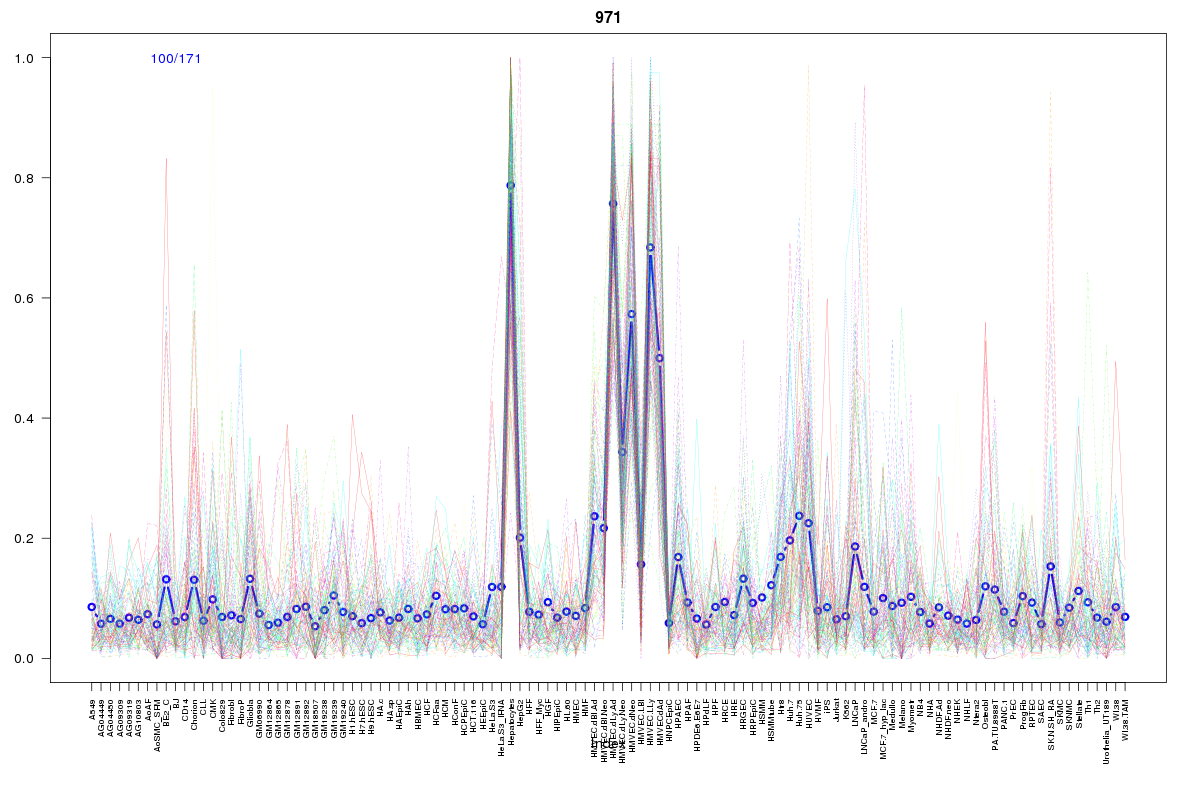 | 971 | 1 |
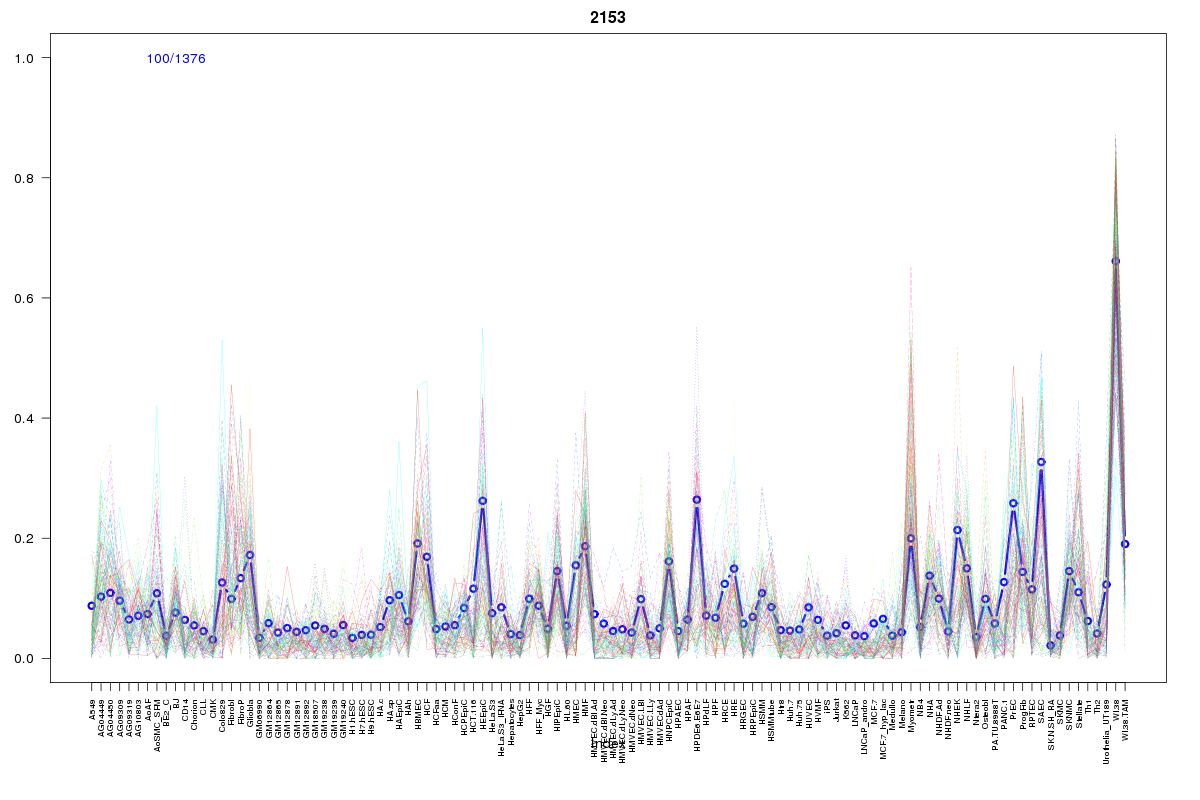 | 2153 | 1 |
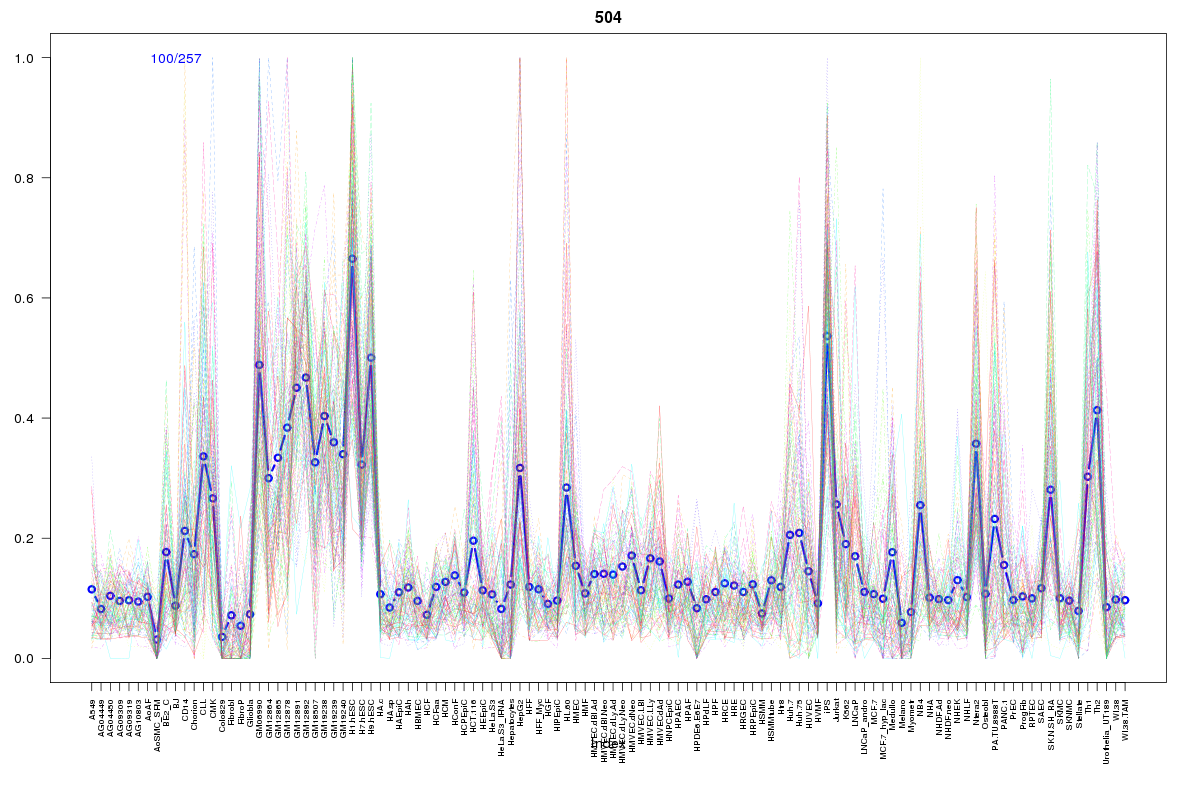 | 504 | 1 |
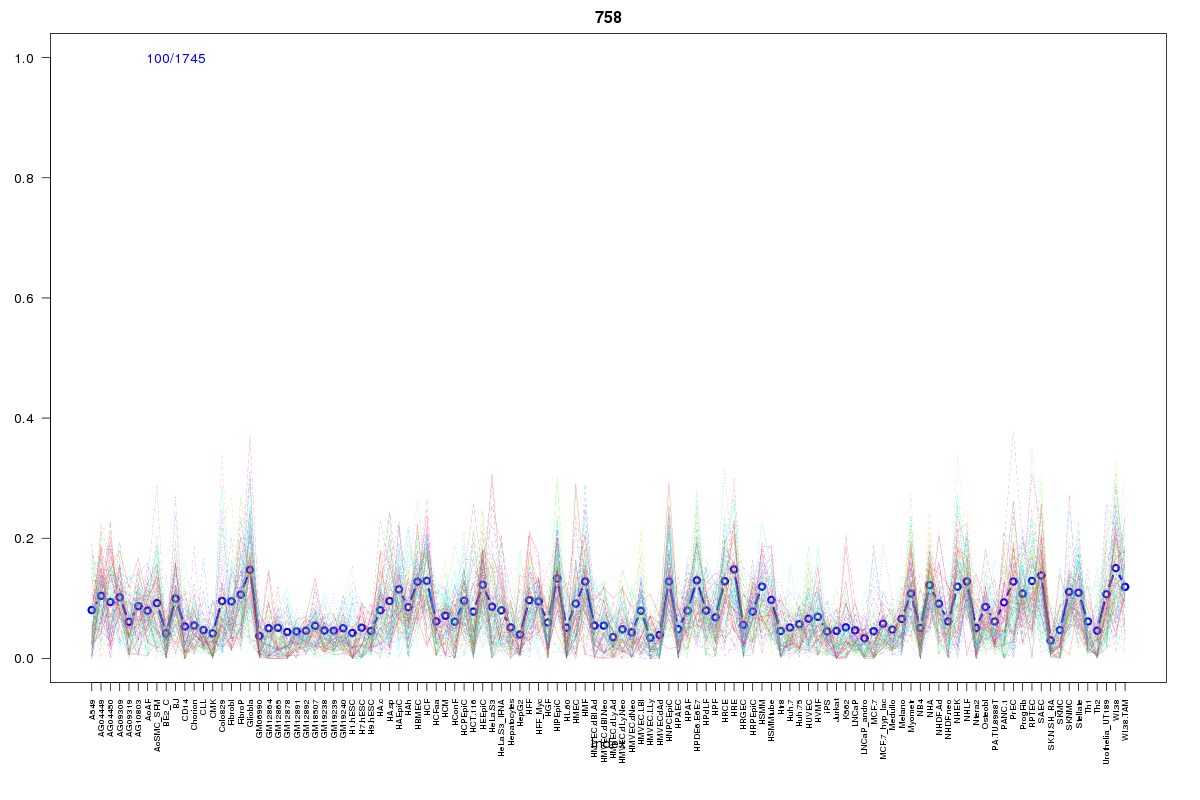 | 758 | 1 |
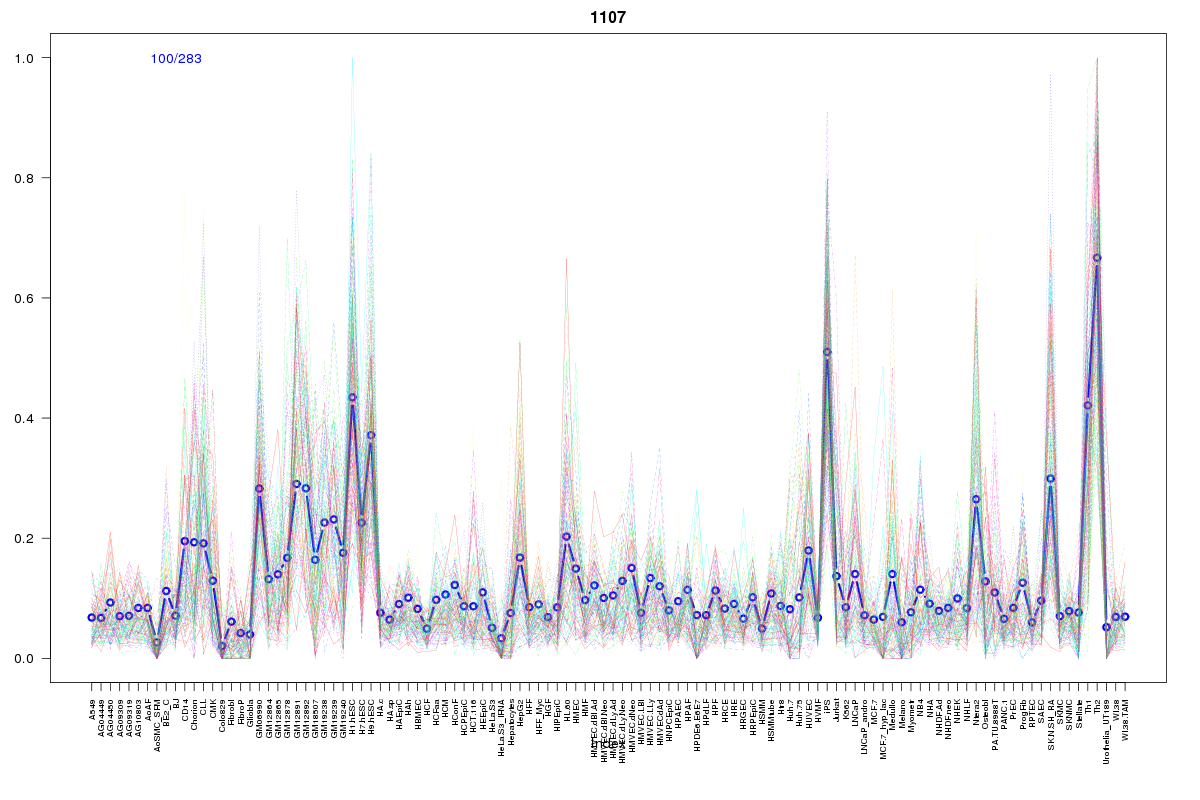 | 1107 | 1 |
 | 570 | 1 |
 | 2195 | 1 |
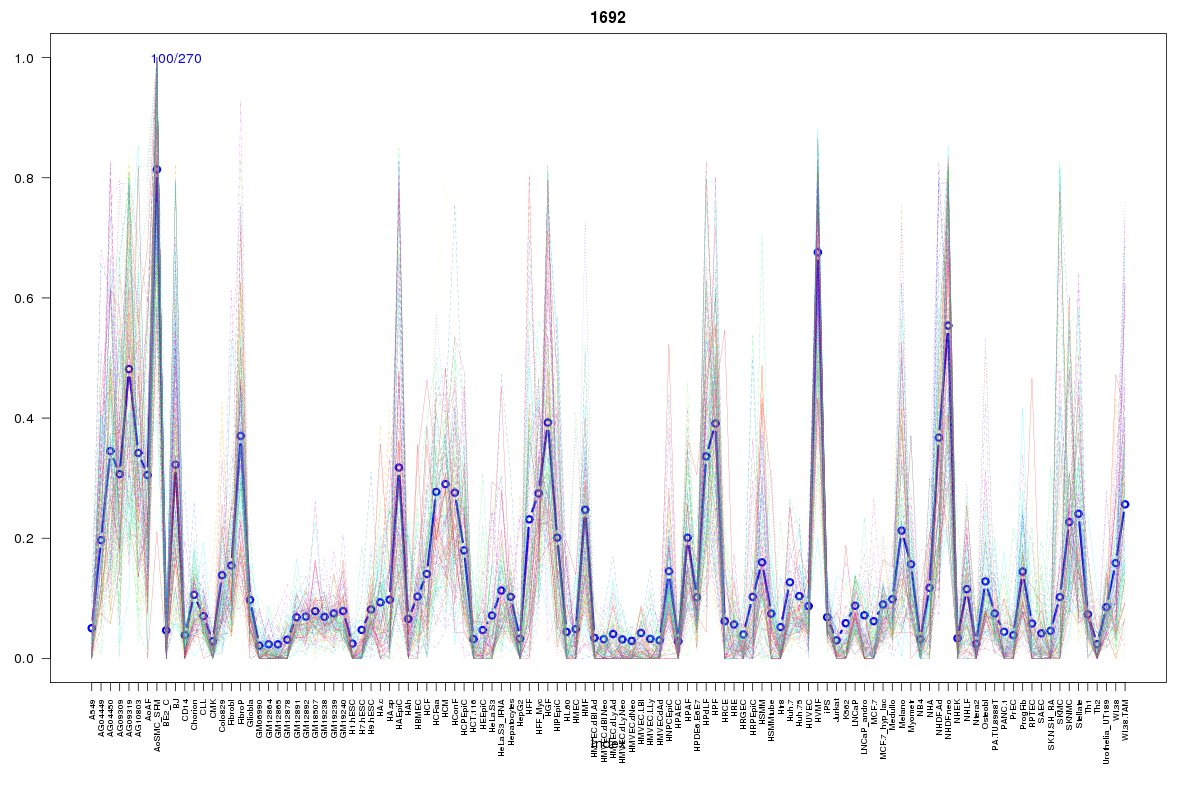 | 1692 | 1 |
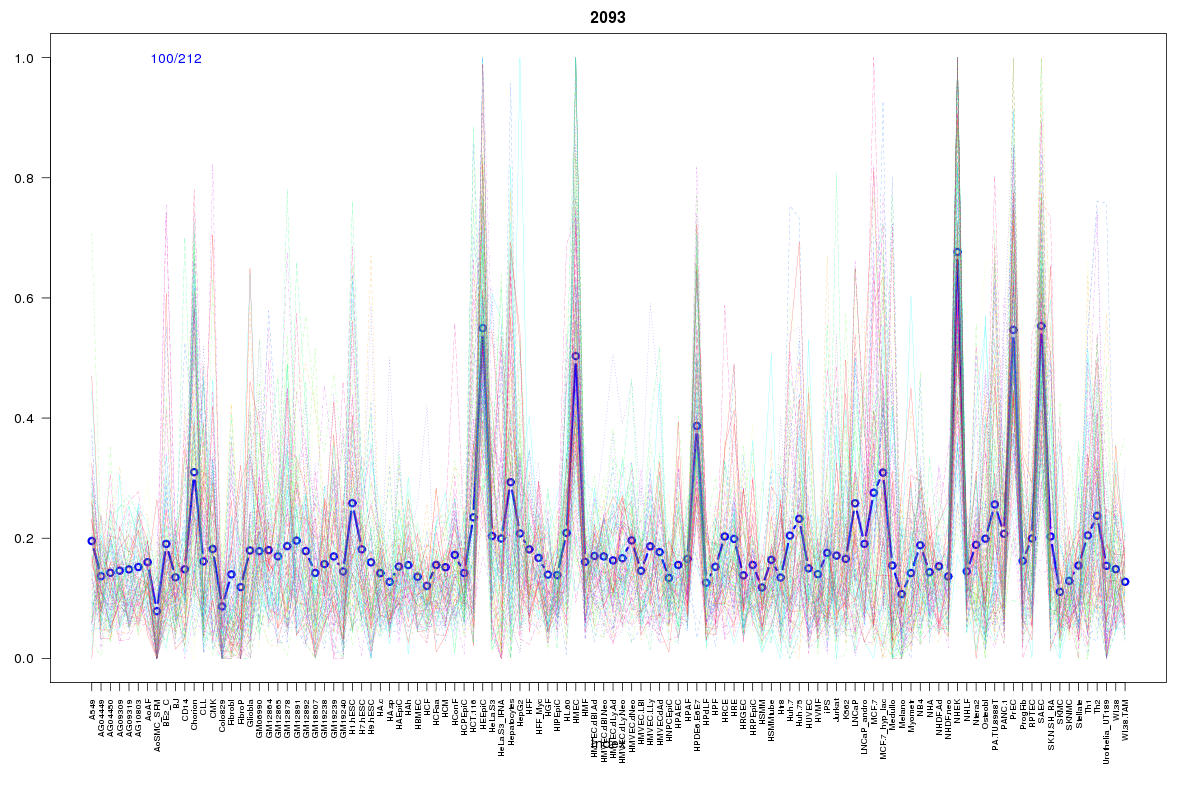 | 2093 | 1 |
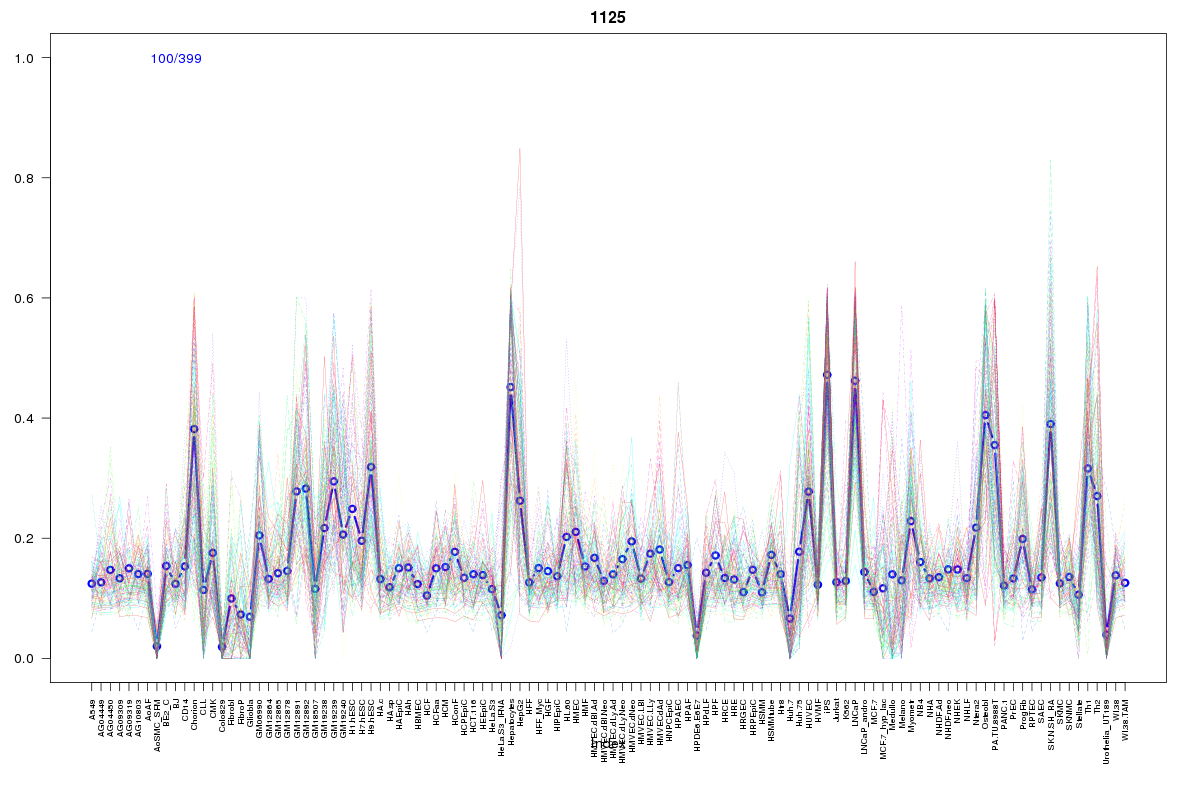 | 1125 | 1 |
 | 860 | 1 |
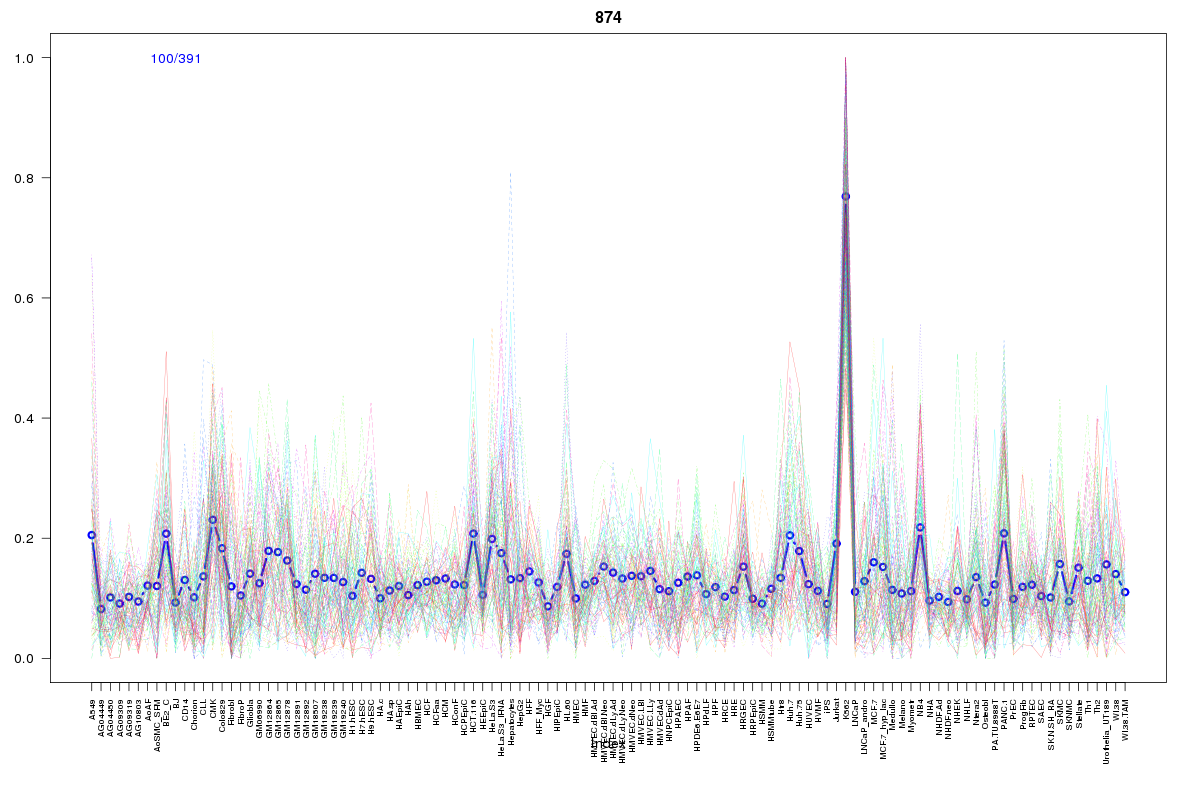 | 874 | 1 |
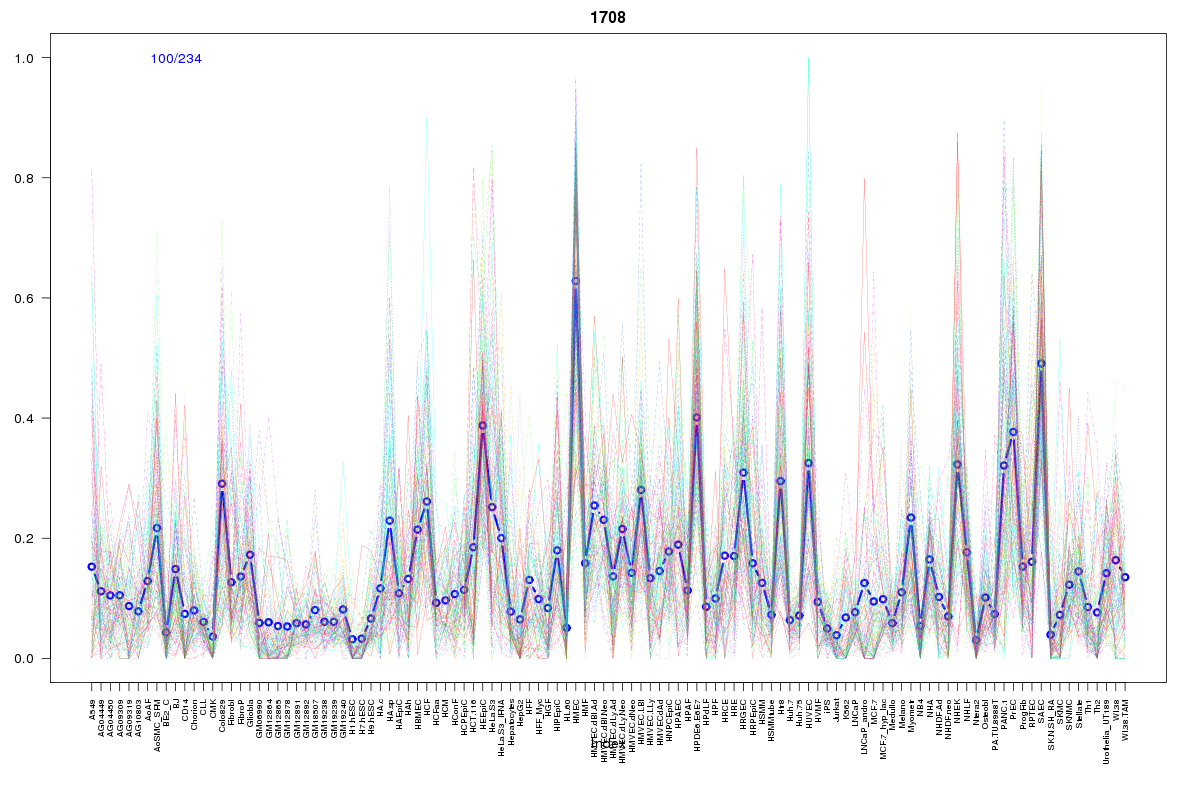 | 1708 | 1 |
Resources
BED file downloads
Connects to 40 DHS sitesTop 10 Correlated DHS Sites
p-values indiciate significant higher or lower correlation| Location | Cluster | P-value |
|---|---|---|
| chr7:150691160-150691310 | 687 | 0.001 |
| chr7:150778940-150779090 | 1301 | 0.001 |
| chr7:150887365-150887515 | 2055 | 0.001 |
| chr7:150846200-150846350 | 860 | 0.003 |
| chr7:150845120-150845270 | 615 | 0.003 |
| chr7:150723140-150723290 | 2195 | 0.003 |
| chr7:150723920-150724070 | 615 | 0.003 |
| chr7:150843860-150844010 | 615 | 0.01 |
| chr7:150791980-150792130 | 2153 | 0.01 |
| chr7:150793420-150793570 | 758 | 0.01 |
| chr7:150854820-150854970 | 1708 | 0.011 |
External Databases
UCSCEnsembl (ENSG00000133612)