Gene: PIAS3
chr1: 145575232-145580322Expression Profile
(log scale)
Graphical Connections
Distribution of linked clusters:
You may find it interesting if many of the connected DHS sites belong to the same cluster.| Cluster Profile | Cluster ID | Number of DHS sites in this cluster |
|---|---|---|
 | 469 | 2 |
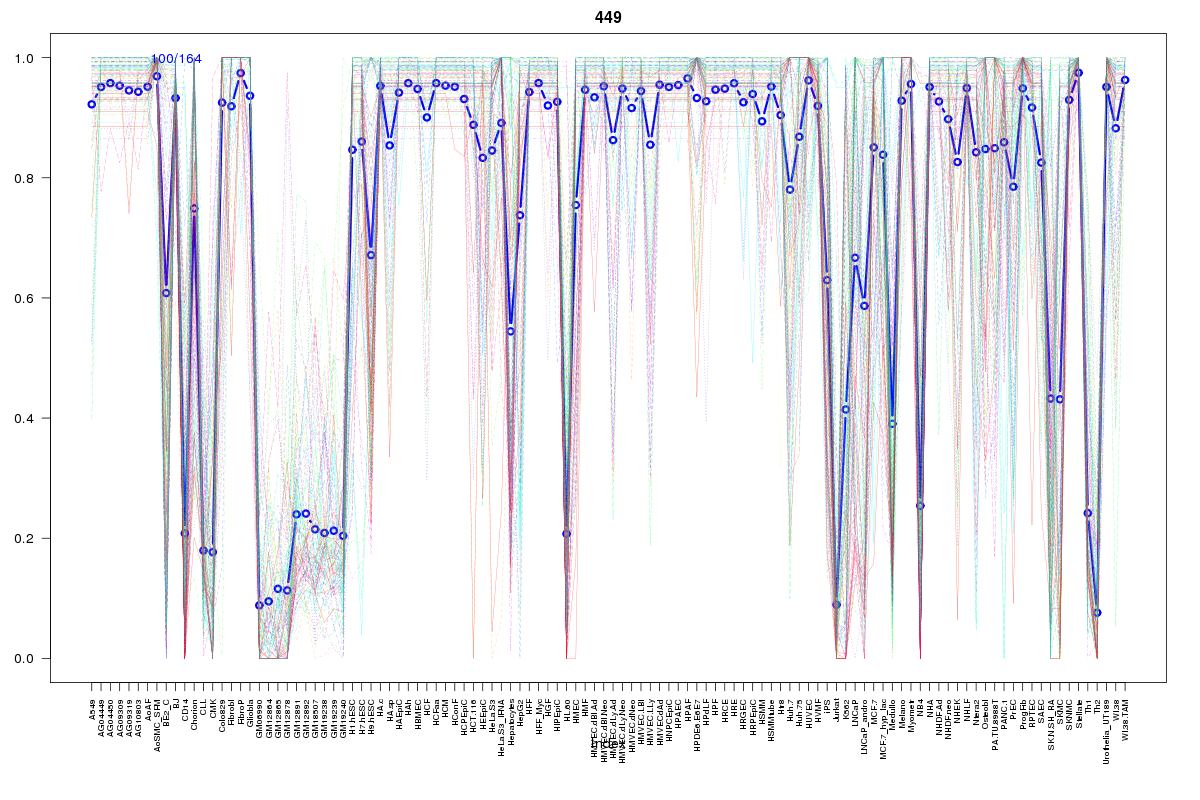 | 449 | 2 |
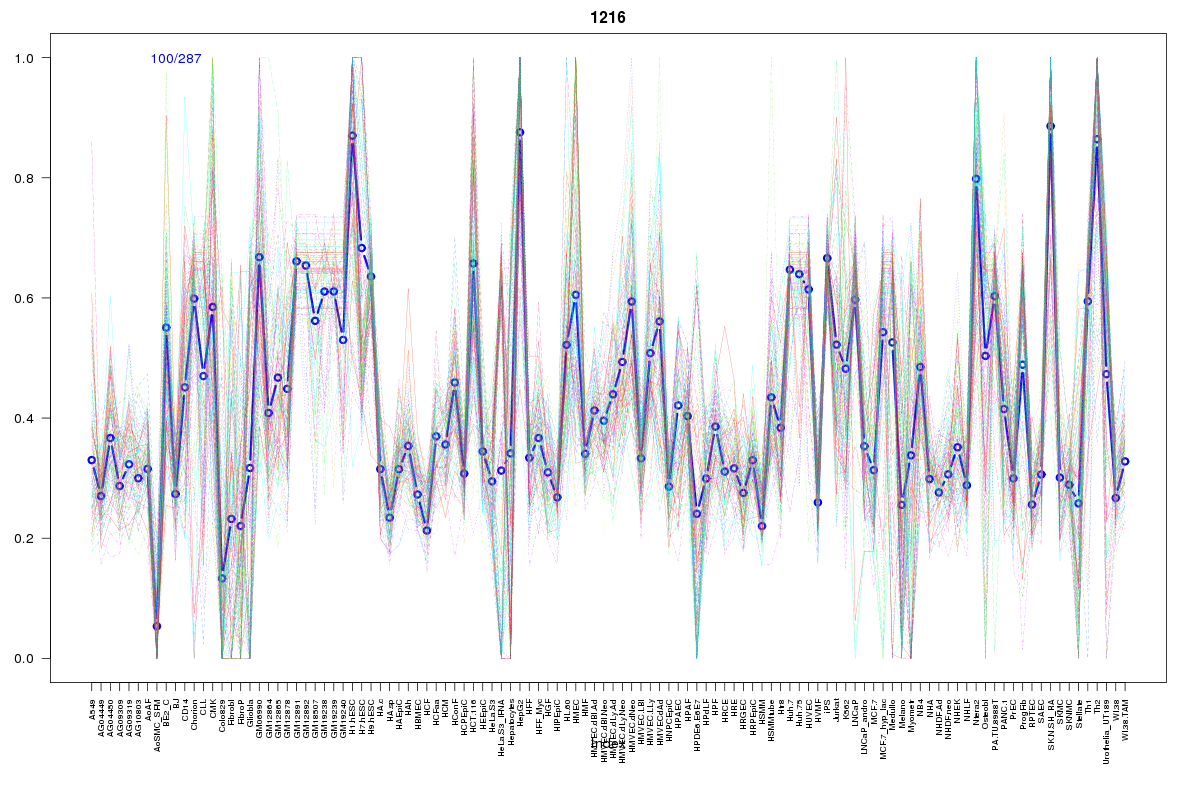 | 1216 | 2 |
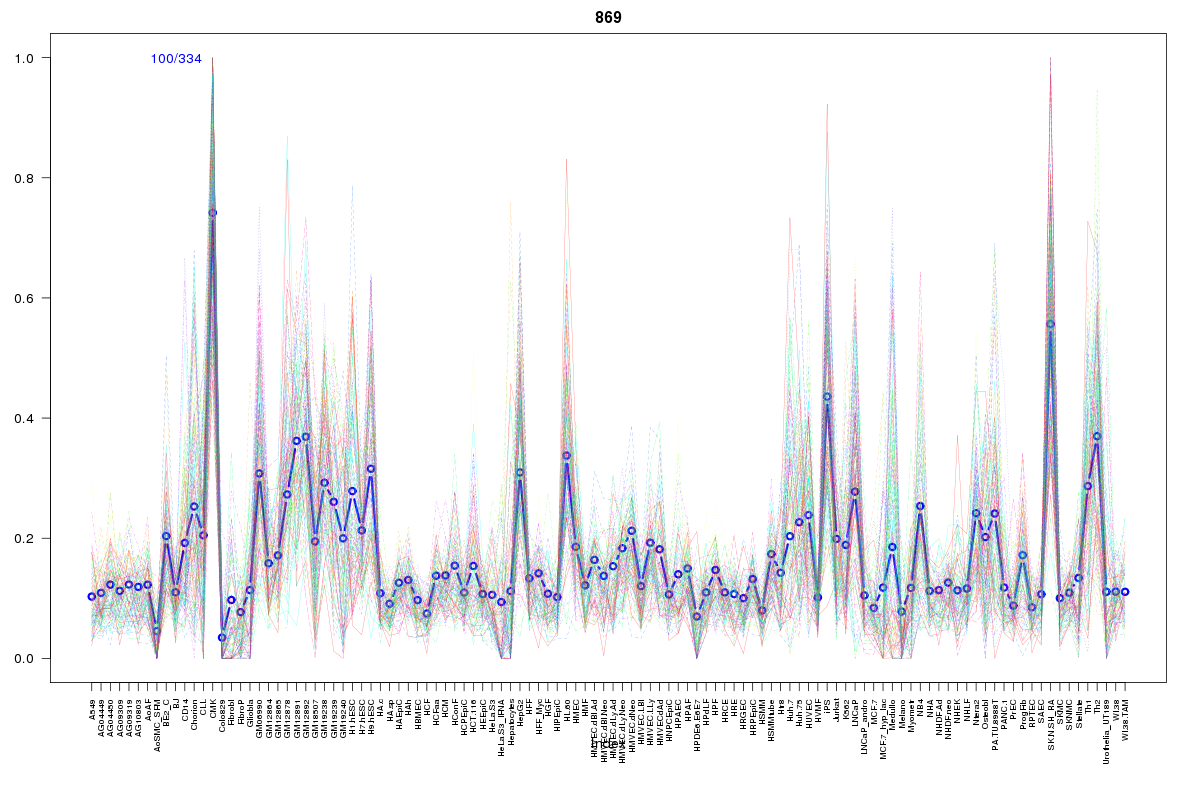 | 869 | 1 |
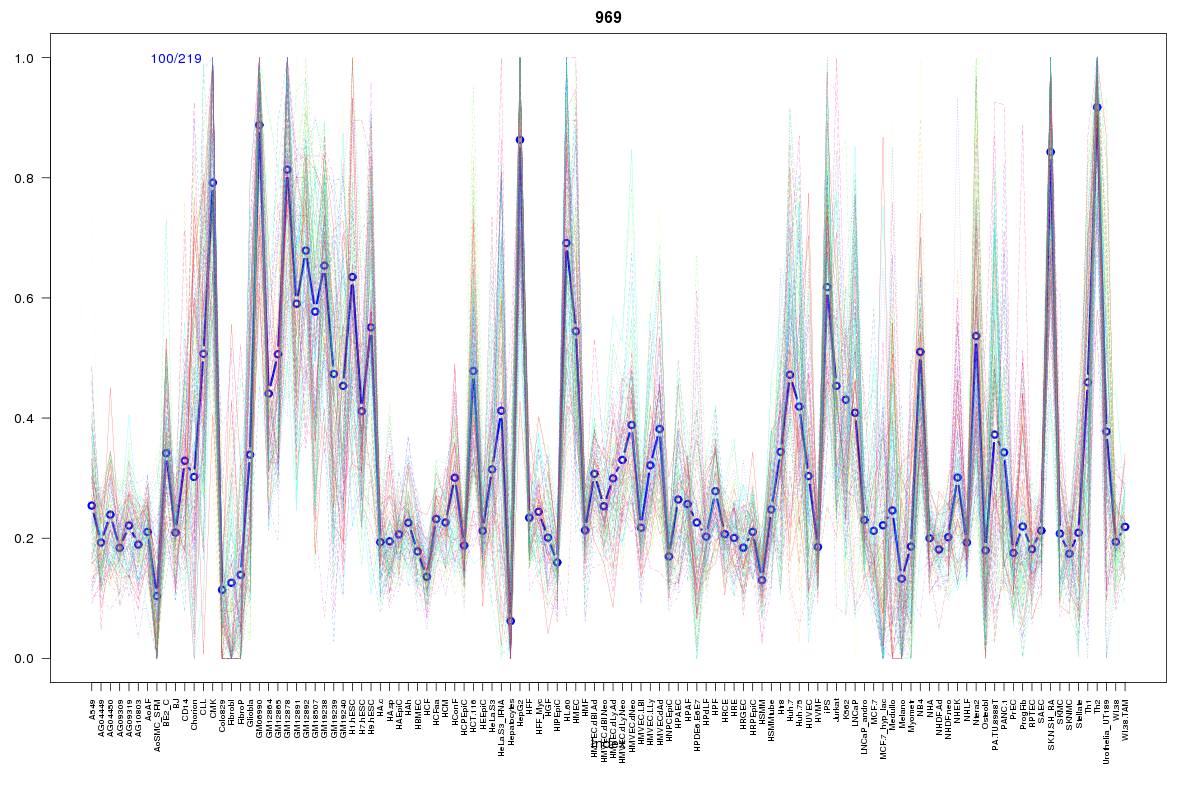 | 969 | 1 |
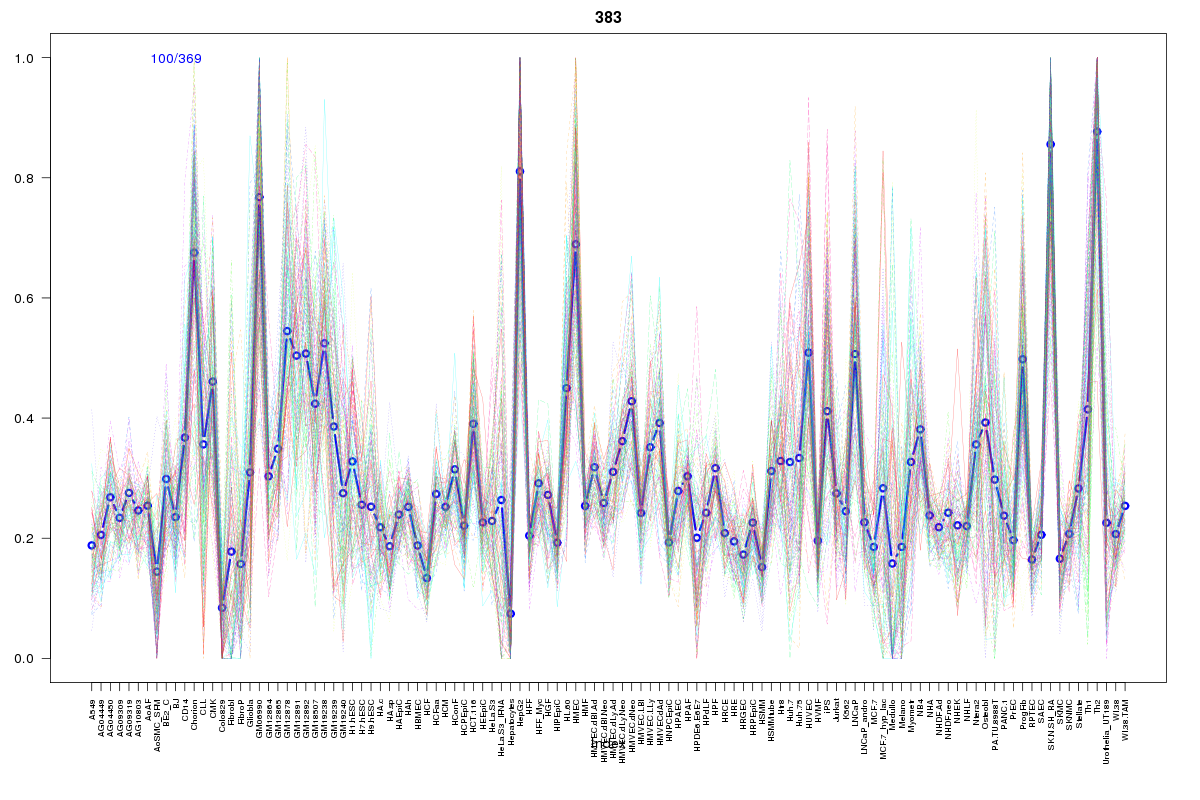 | 383 | 1 |
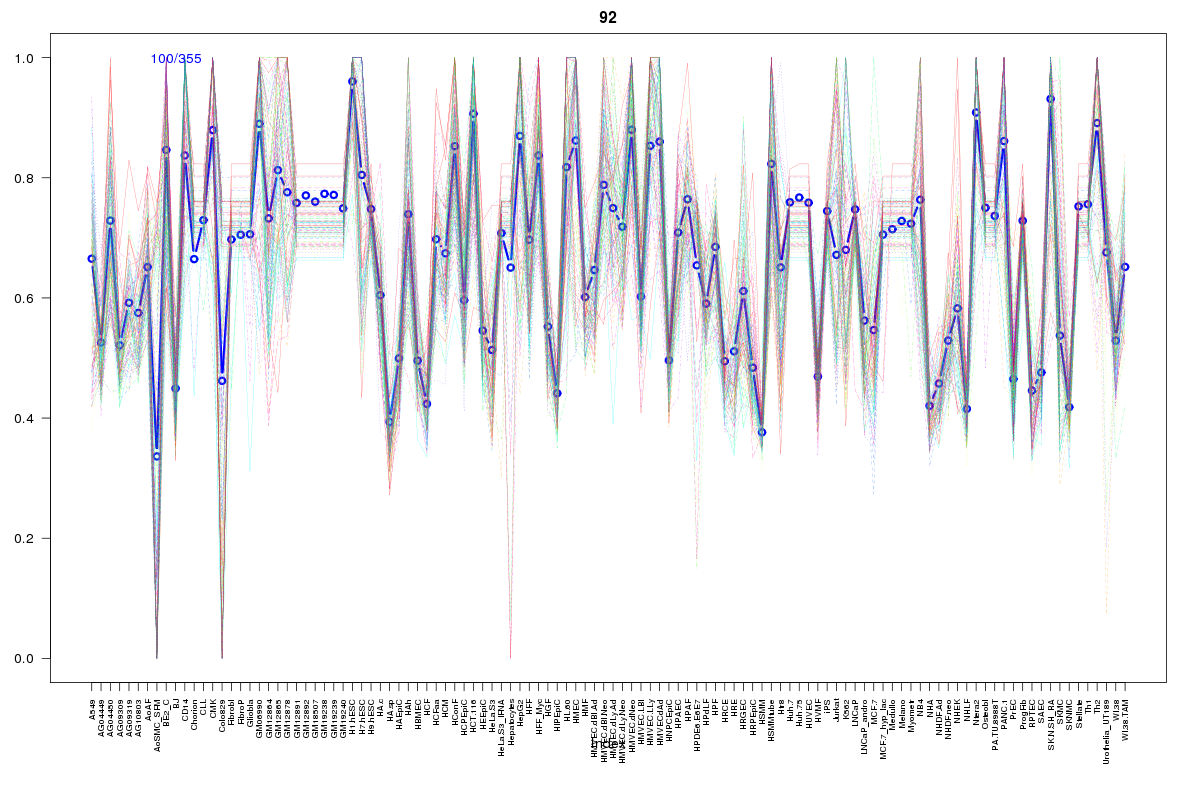 | 92 | 1 |
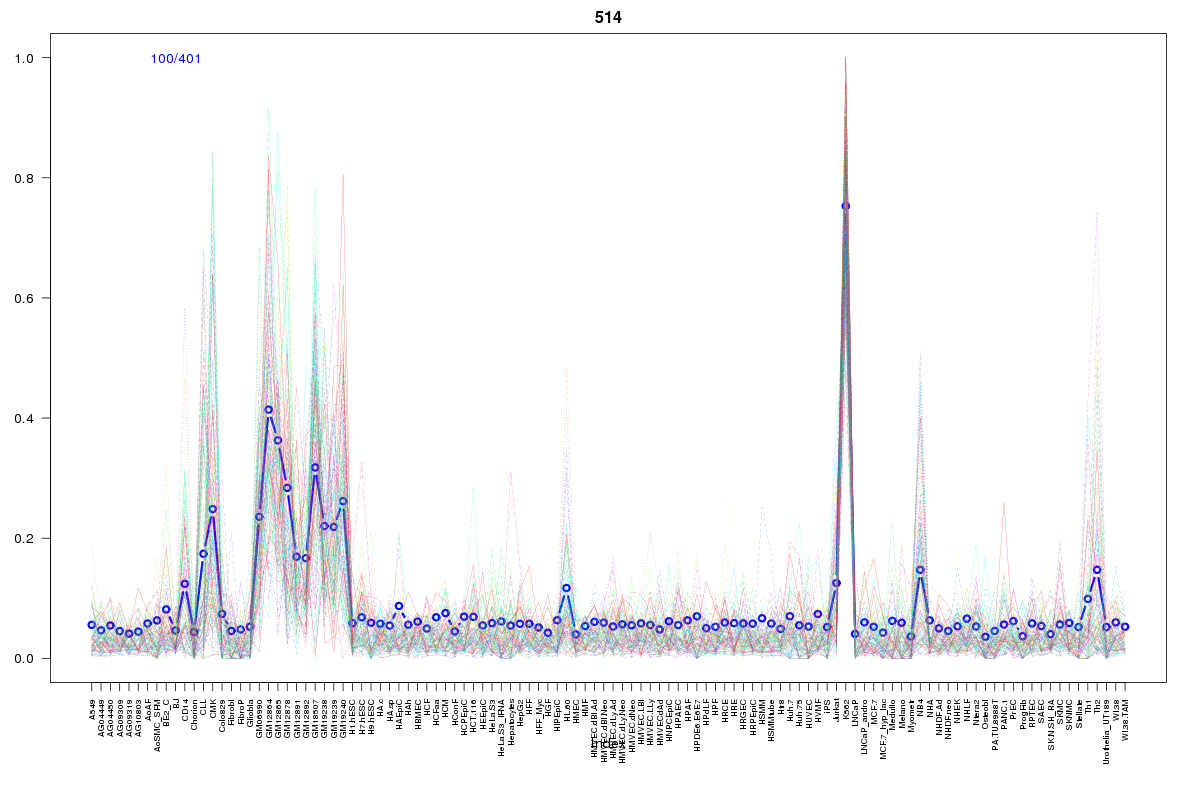 | 514 | 1 |
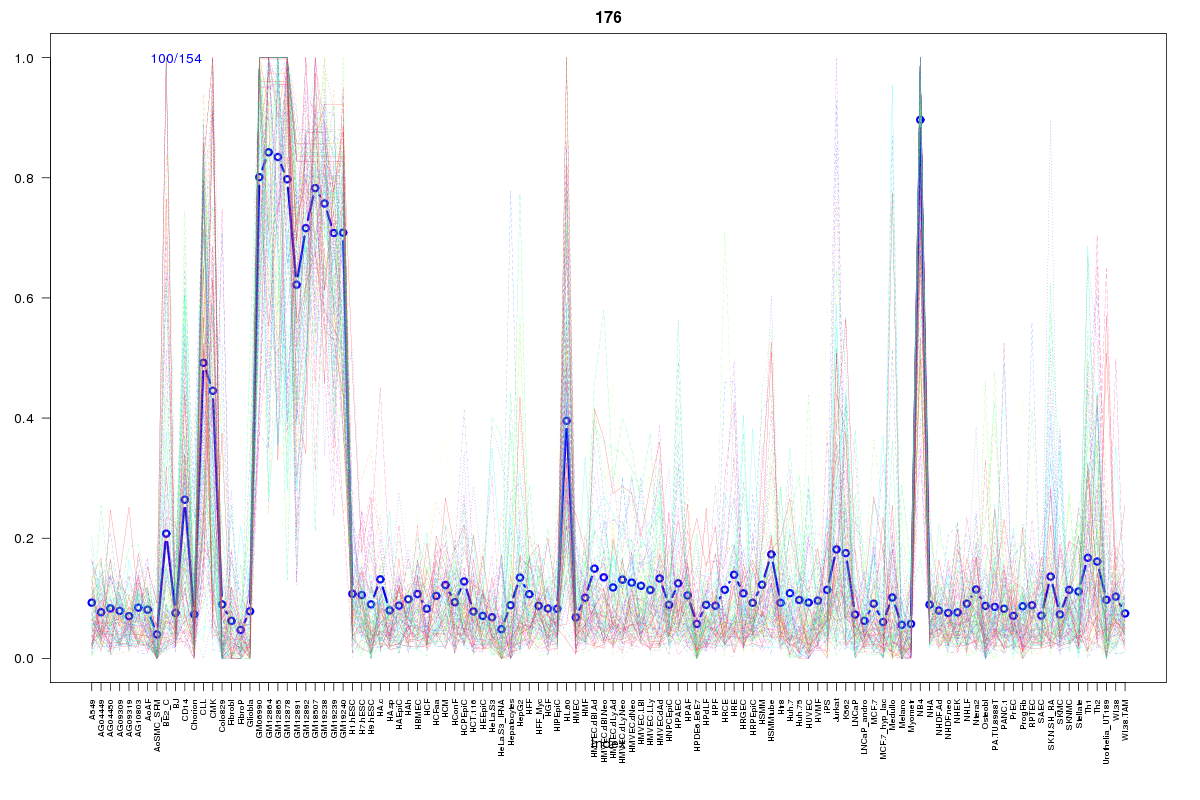 | 176 | 1 |
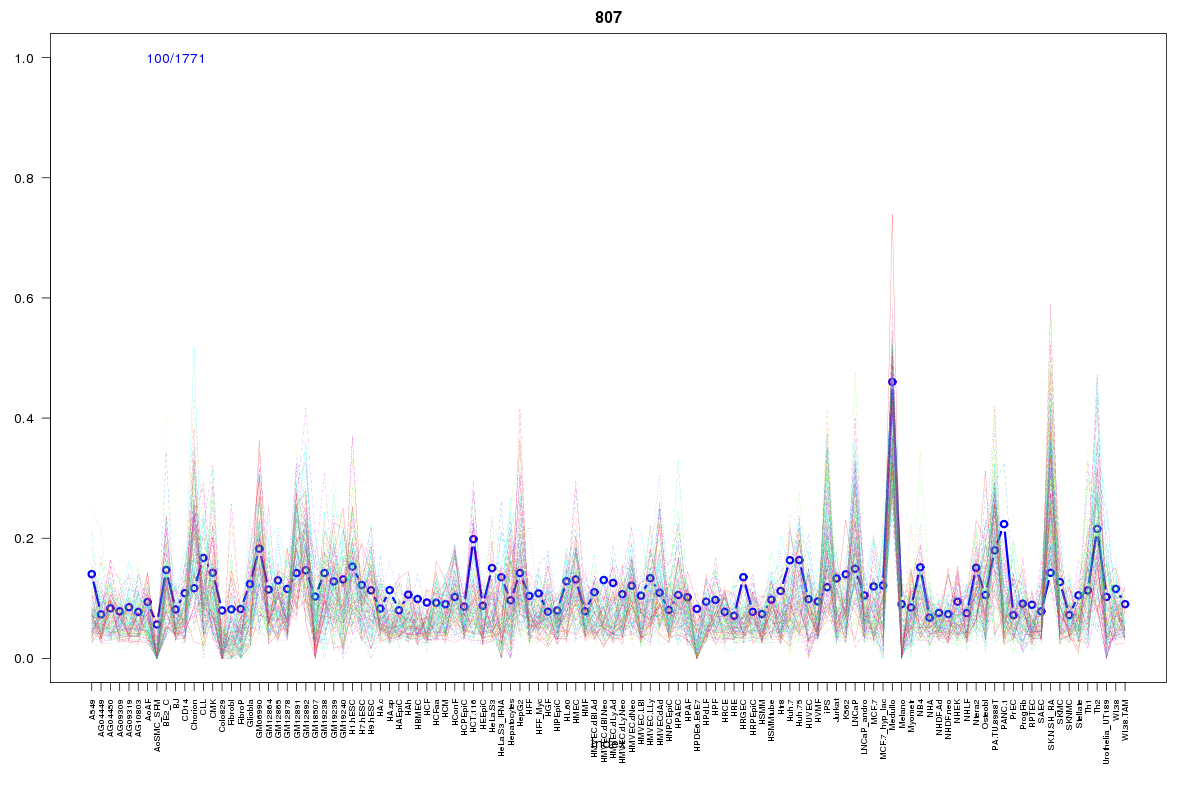 | 807 | 1 |
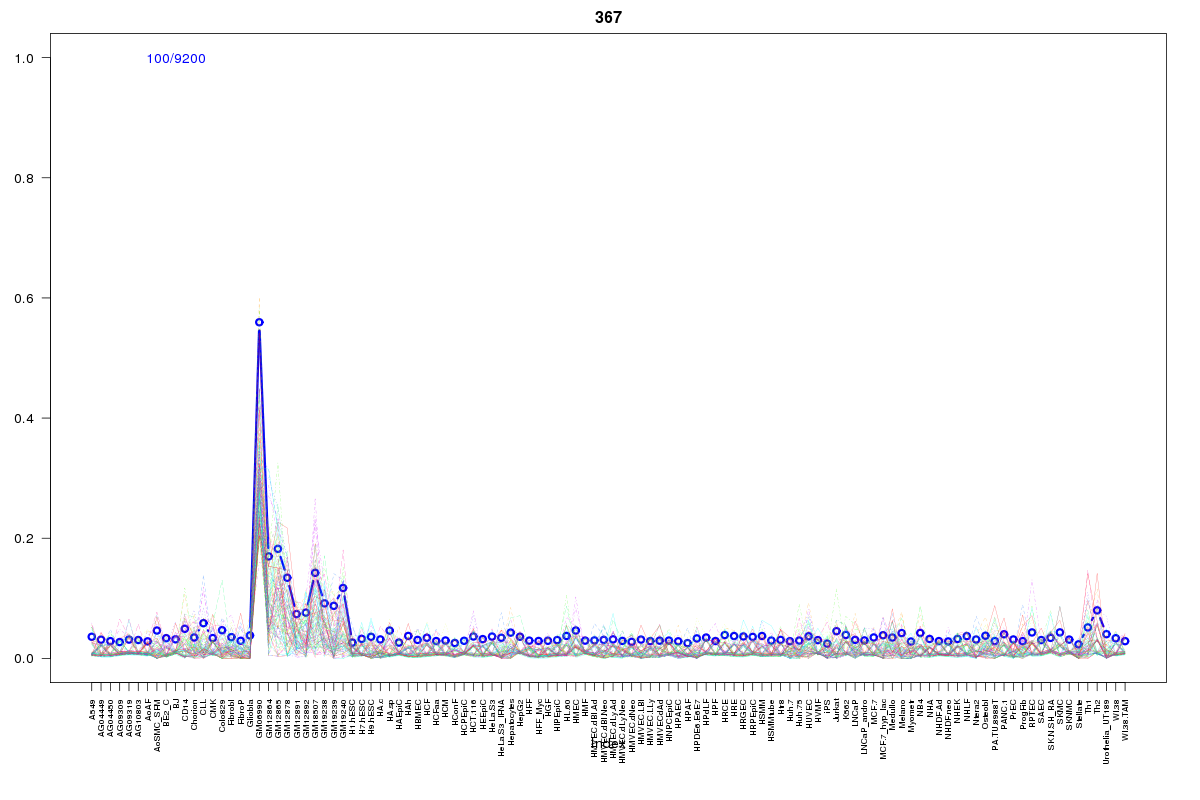 | 367 | 1 |
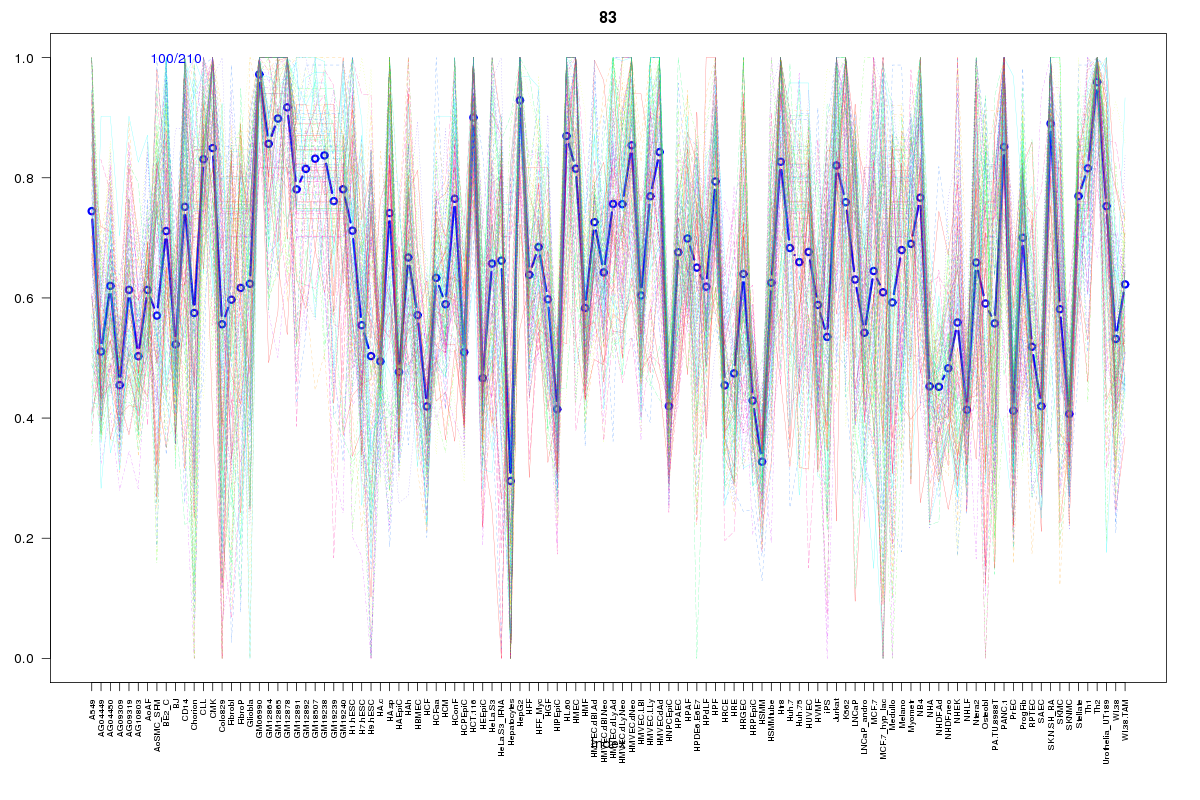 | 83 | 1 |
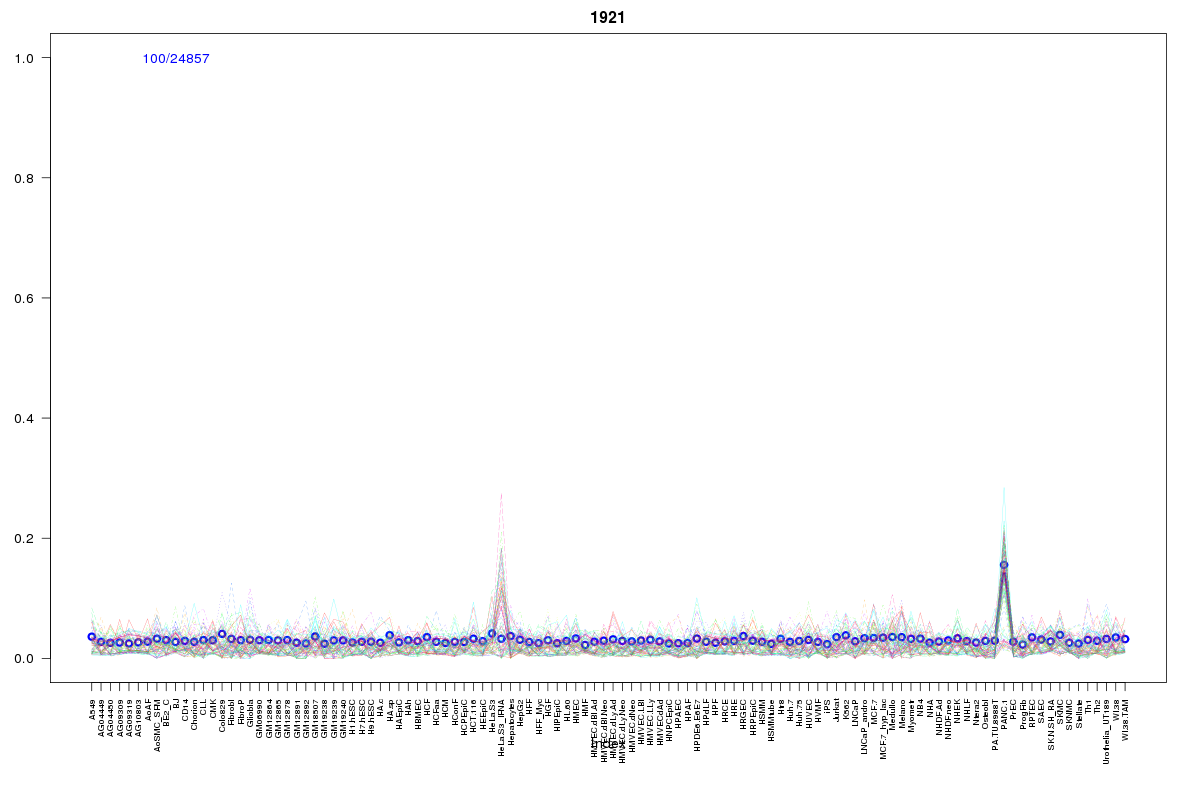 | 1921 | 1 |
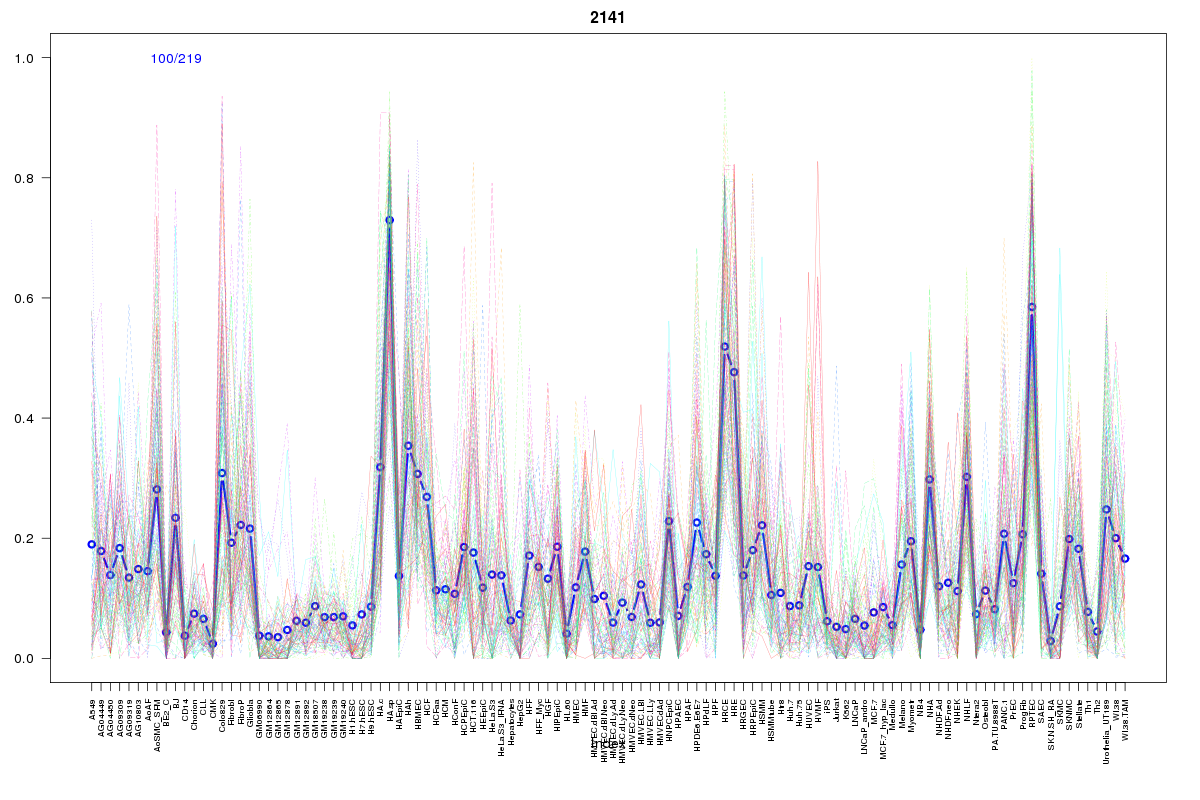 | 2141 | 1 |
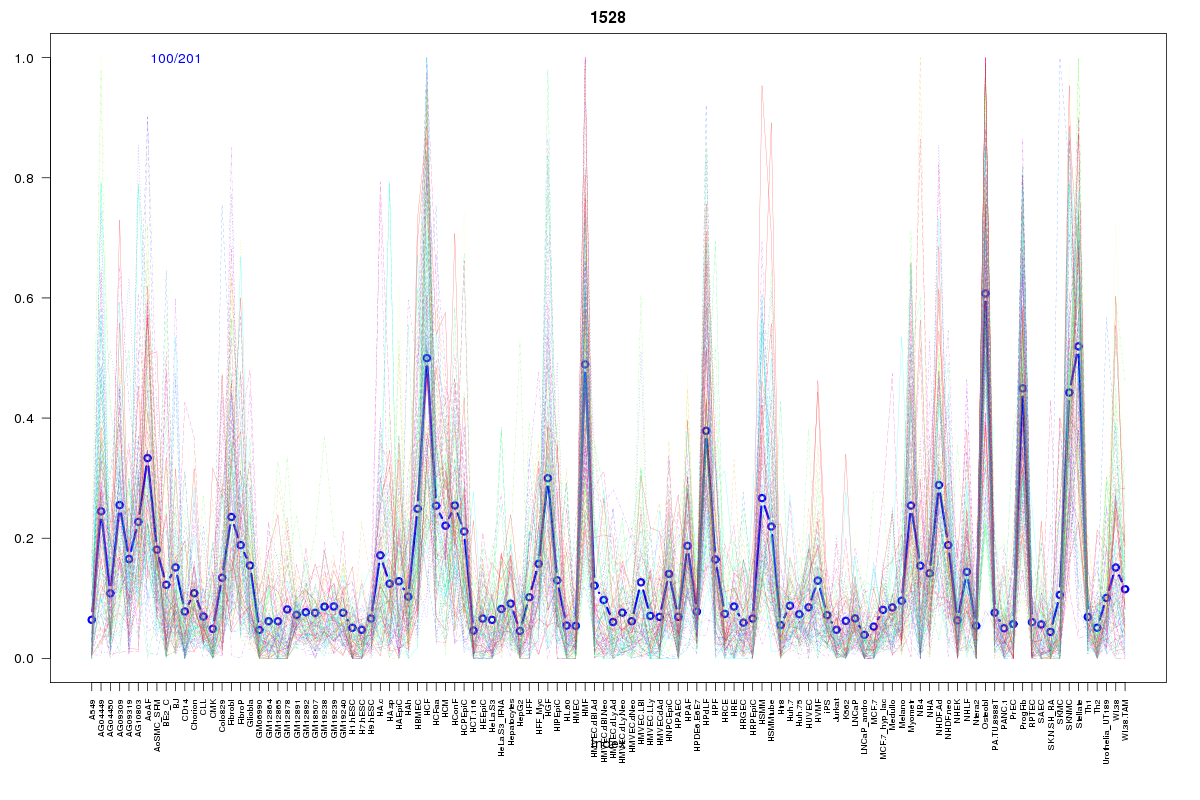 | 1528 | 1 |
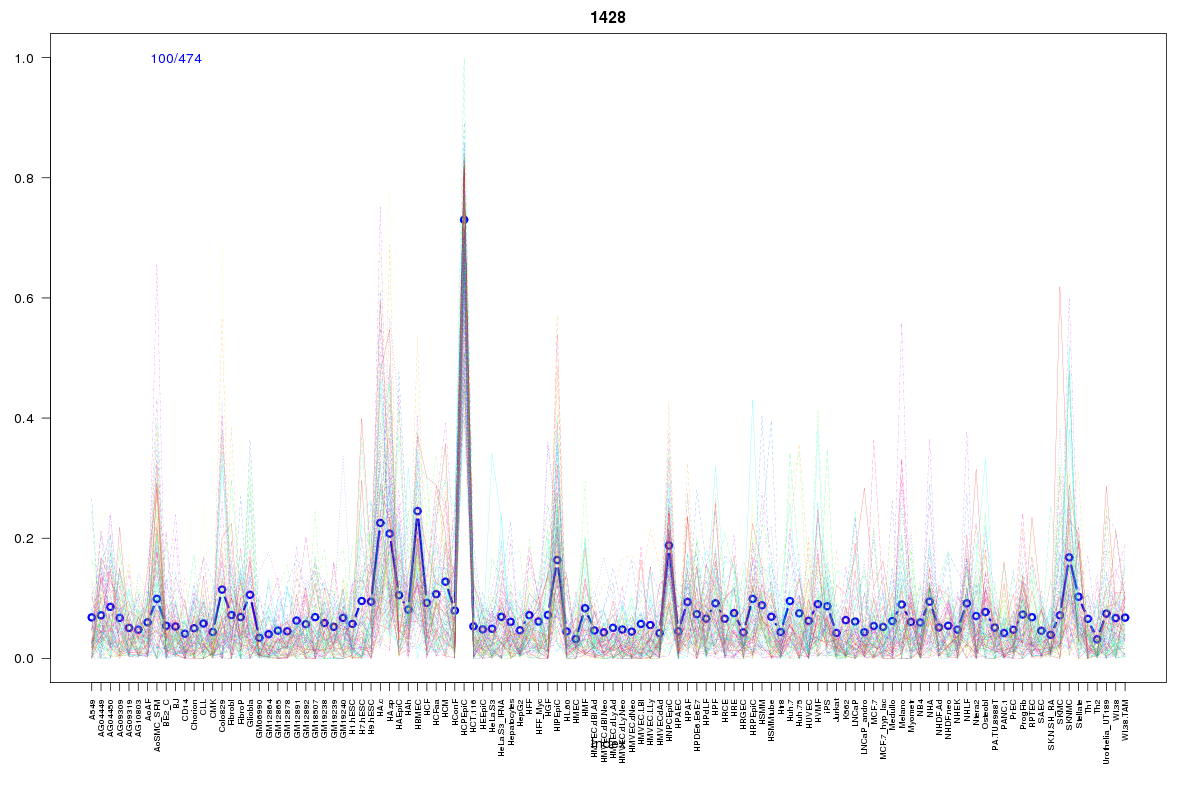 | 1428 | 1 |
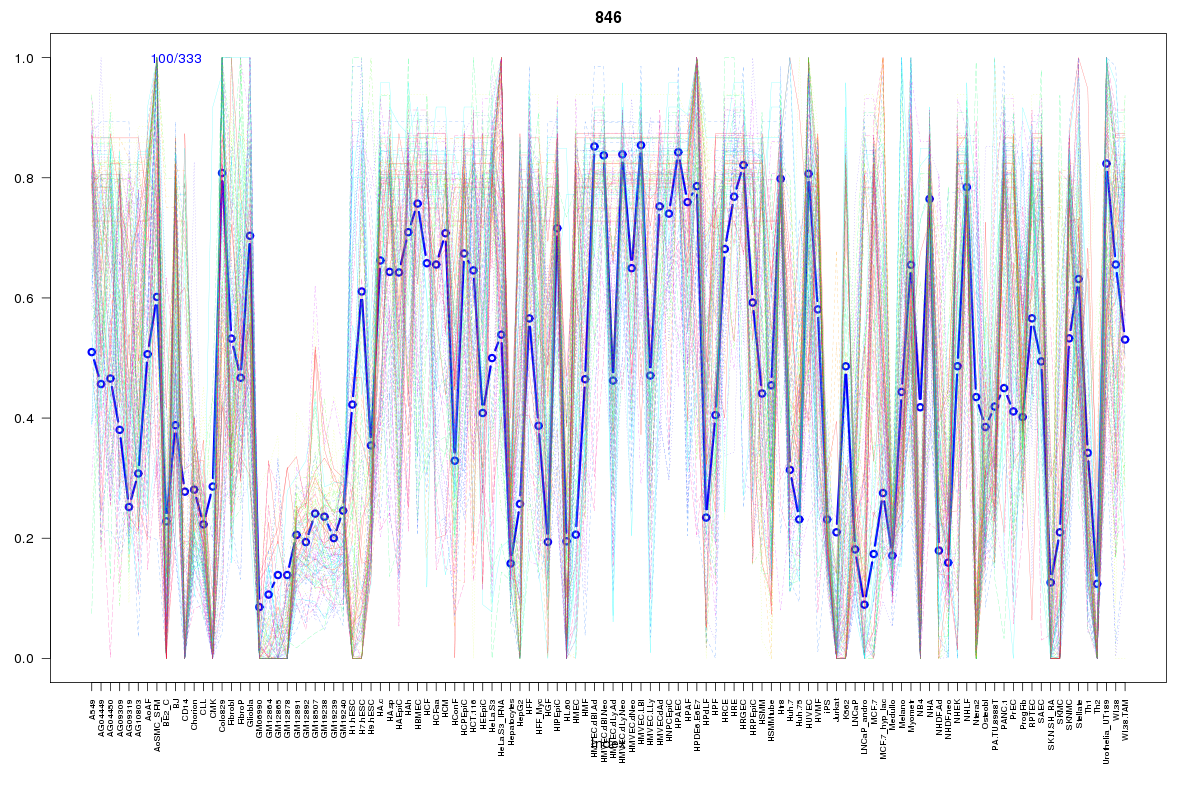 | 846 | 1 |
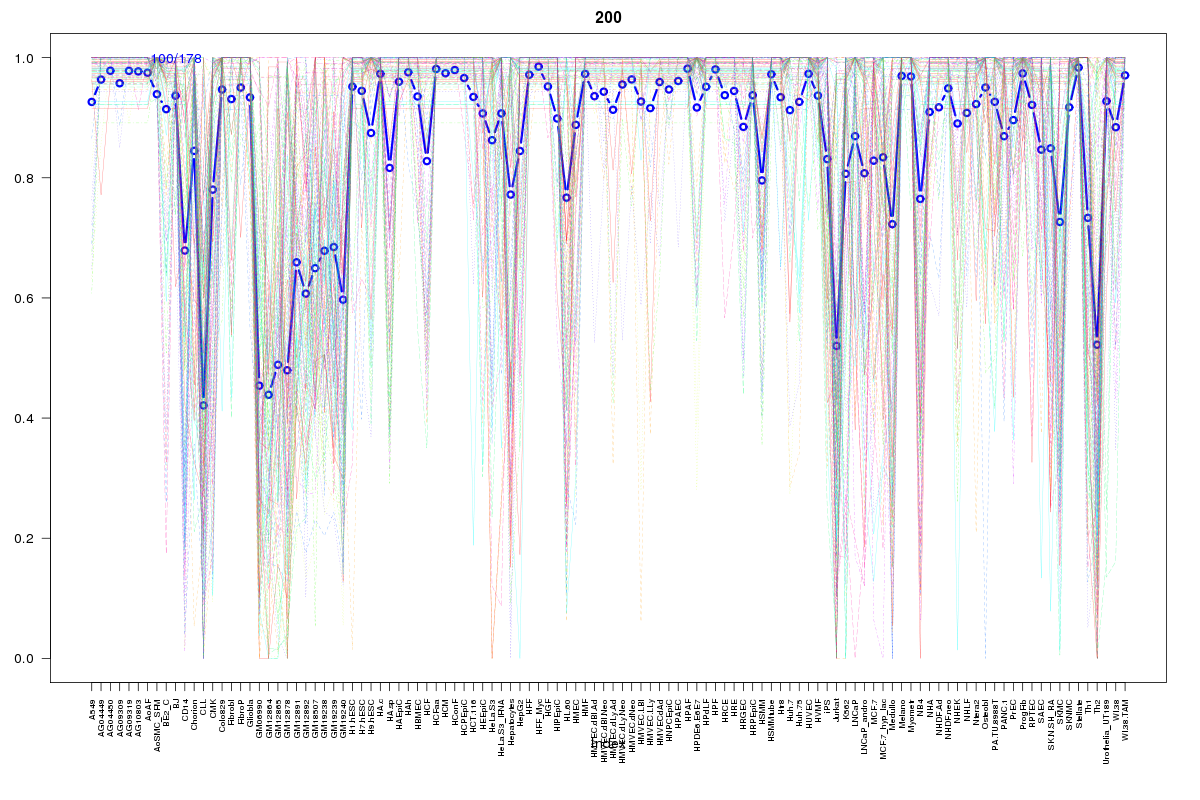 | 200 | 1 |
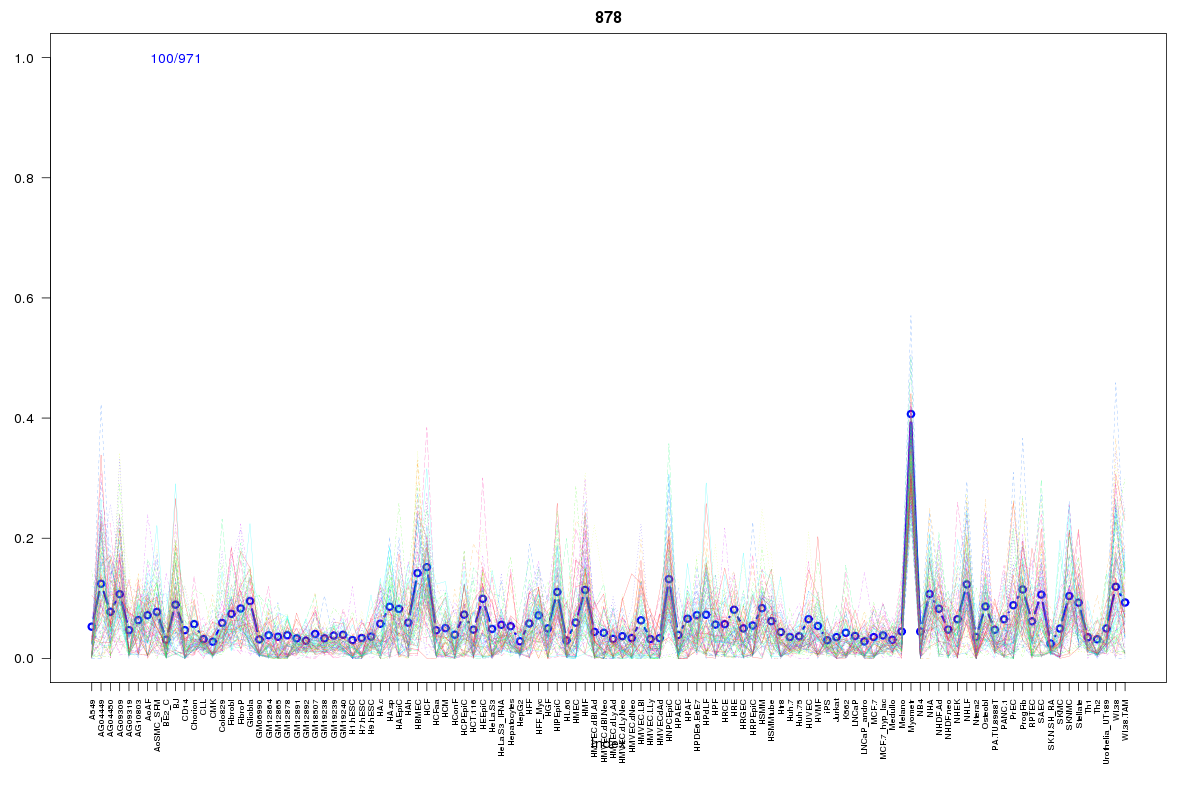 | 878 | 1 |
 | 2283 | 1 |
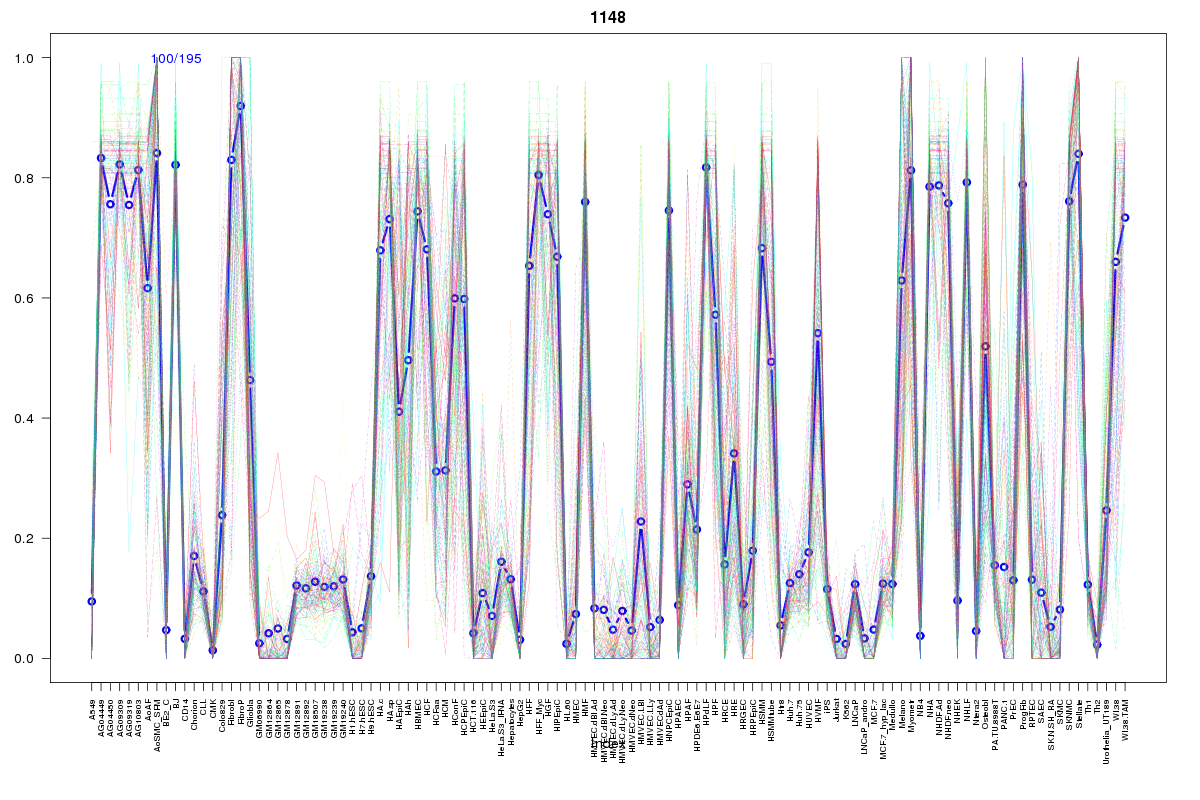 | 1148 | 1 |
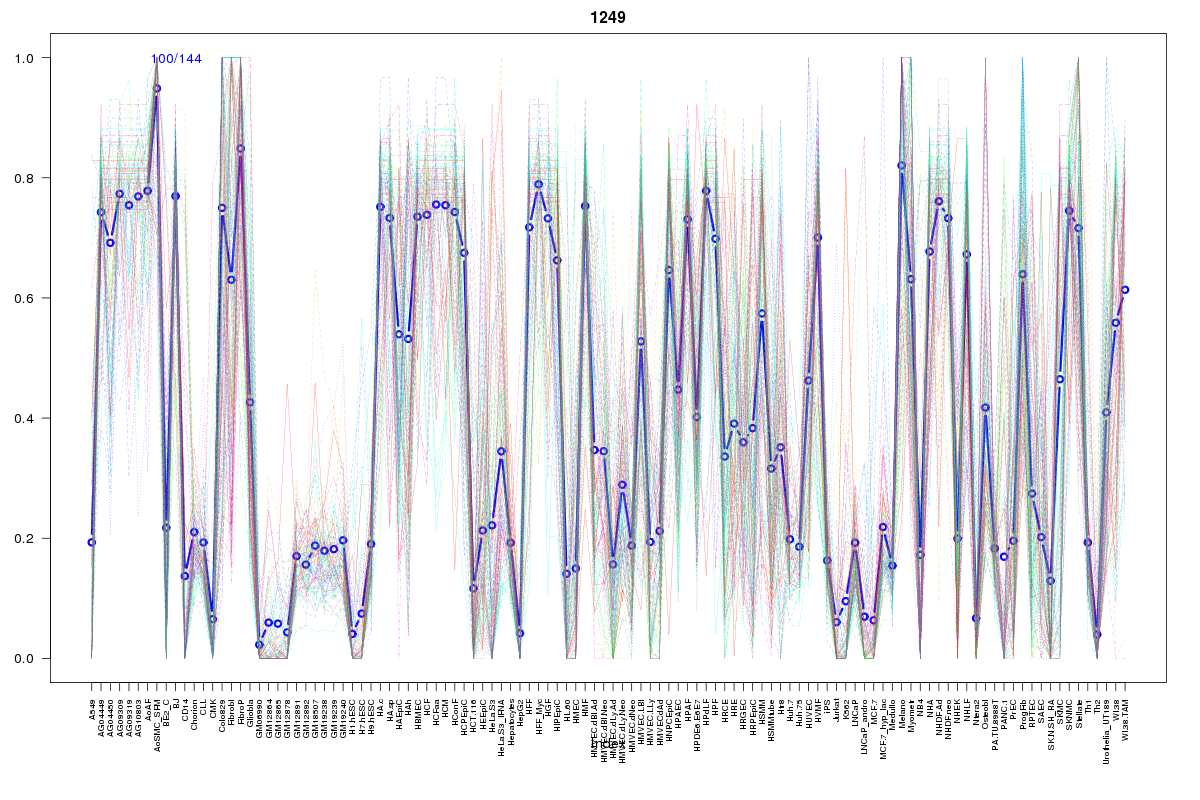 | 1249 | 1 |
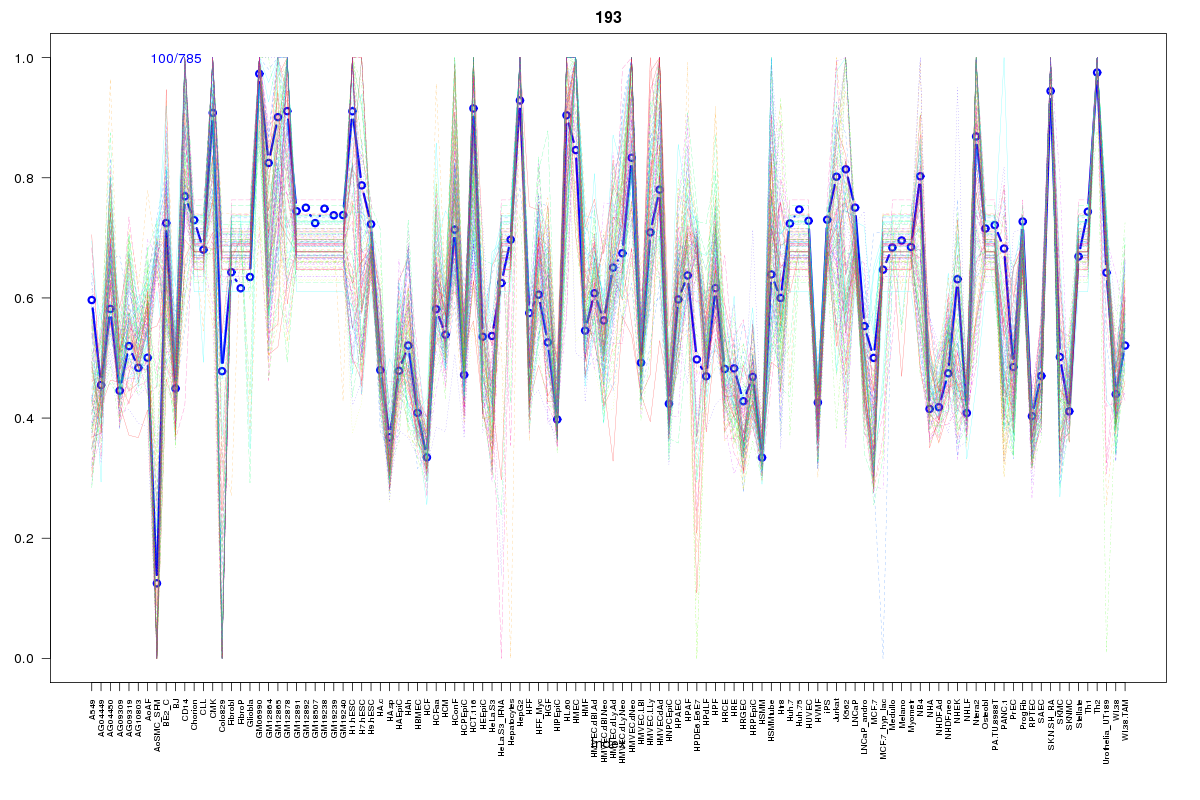 | 193 | 1 |
 | 2452 | 1 |
 | 928 | 1 |
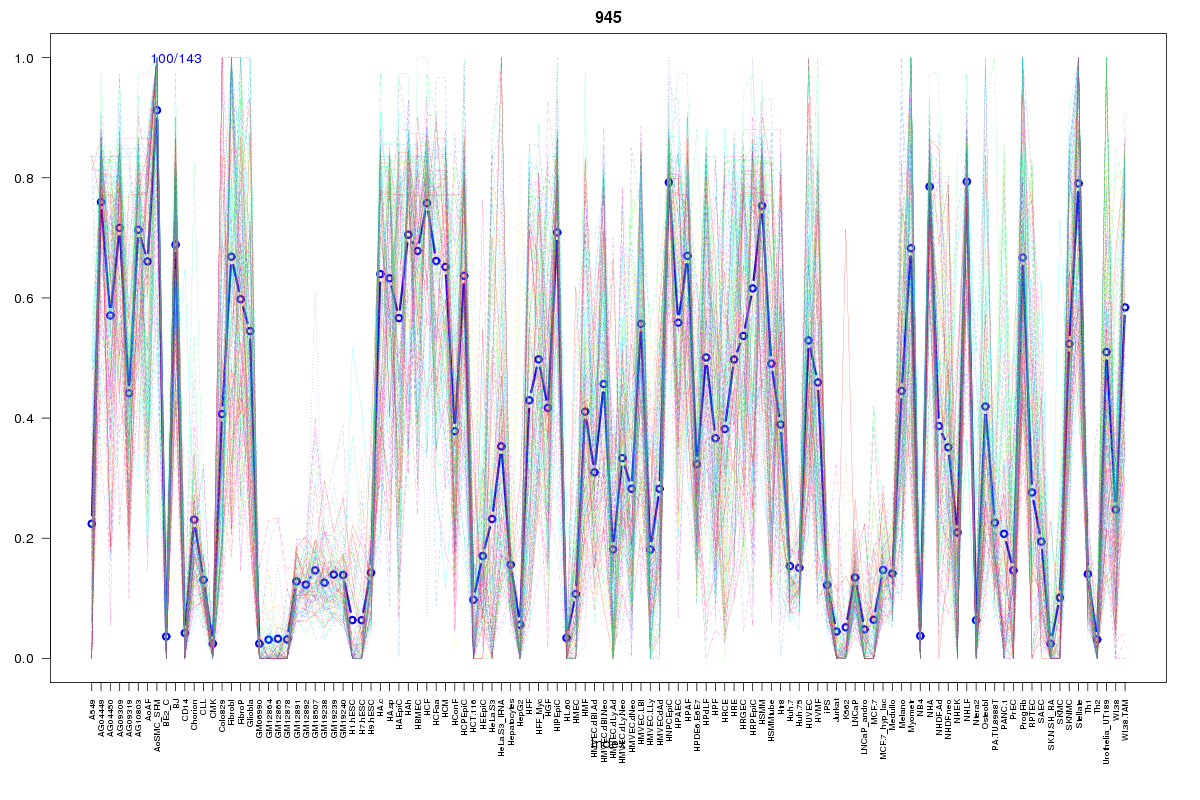 | 945 | 1 |
Resources
BED file downloads
Connects to 29 DHS sitesTop 10 Correlated DHS Sites
p-values indiciate significant higher or lower correlation| Location | Cluster | P-value |
|---|---|---|
| chr1:145542665-145542815 | 449 | 0 |
| chr1:145542820-145542970 | 449 | 0 |
| chr1:145652380-145652530 | 846 | 0 |
| chr1:145683160-145683310 | 1249 | 0.006 |
| chr1:145585060-145585210 | 945 | 0.007 |
| chr1:145542980-145543130 | 200 | 0.008 |
| chr1:145683005-145683155 | 1148 | 0.011 |
| chr1:145550160-145550310 | 2452 | 0.012 |
| chr1:145616780-145616930 | 2141 | 0.012 |
| chr1:145526140-145526290 | 1528 | 0.016 |
| chr1:145543640-145543790 | 2283 | 0.016 |
External Databases
UCSCEnsembl (ENSG00000131788)