Gene: BPIFA3
chr20: 31805115-31815564Expression Profile
(log scale)
Graphical Connections
Distribution of linked clusters:
You may find it interesting if many of the connected DHS sites belong to the same cluster.| Cluster Profile | Cluster ID | Number of DHS sites in this cluster |
|---|---|---|
 | 1755 | 4 |
 | 1605 | 4 |
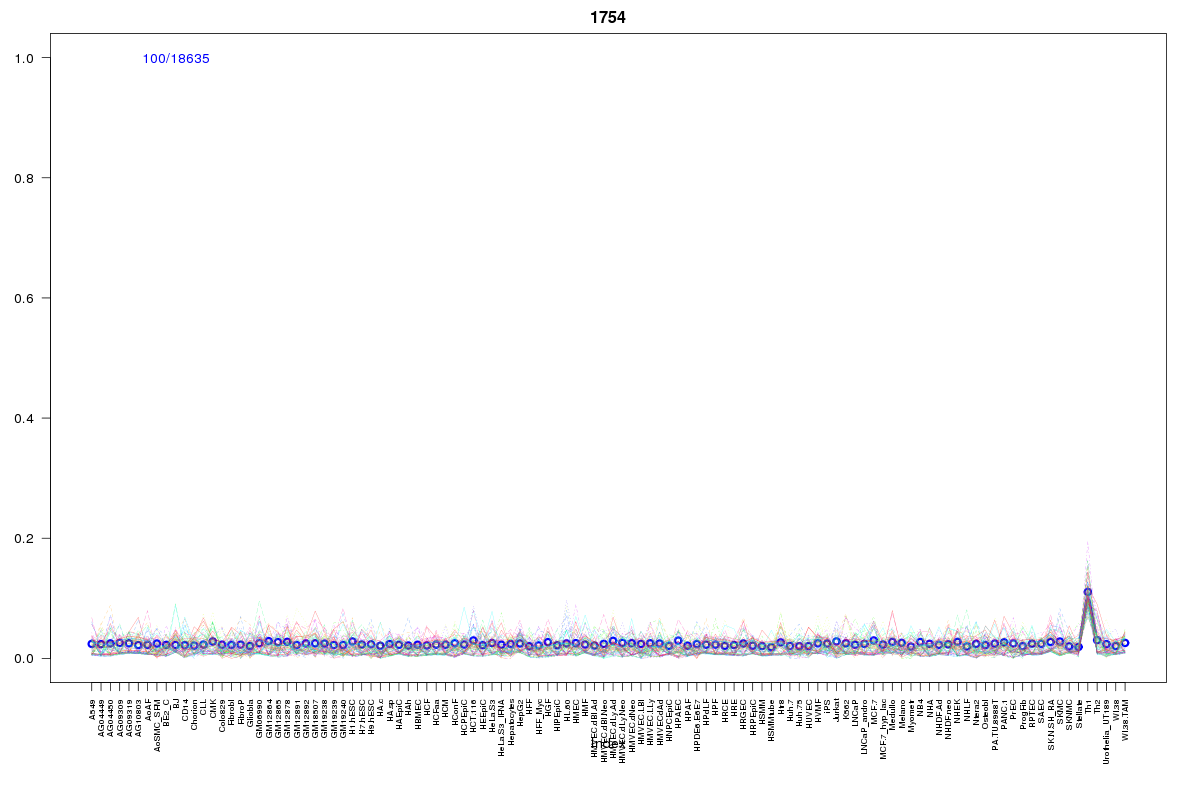 | 1754 | 2 |
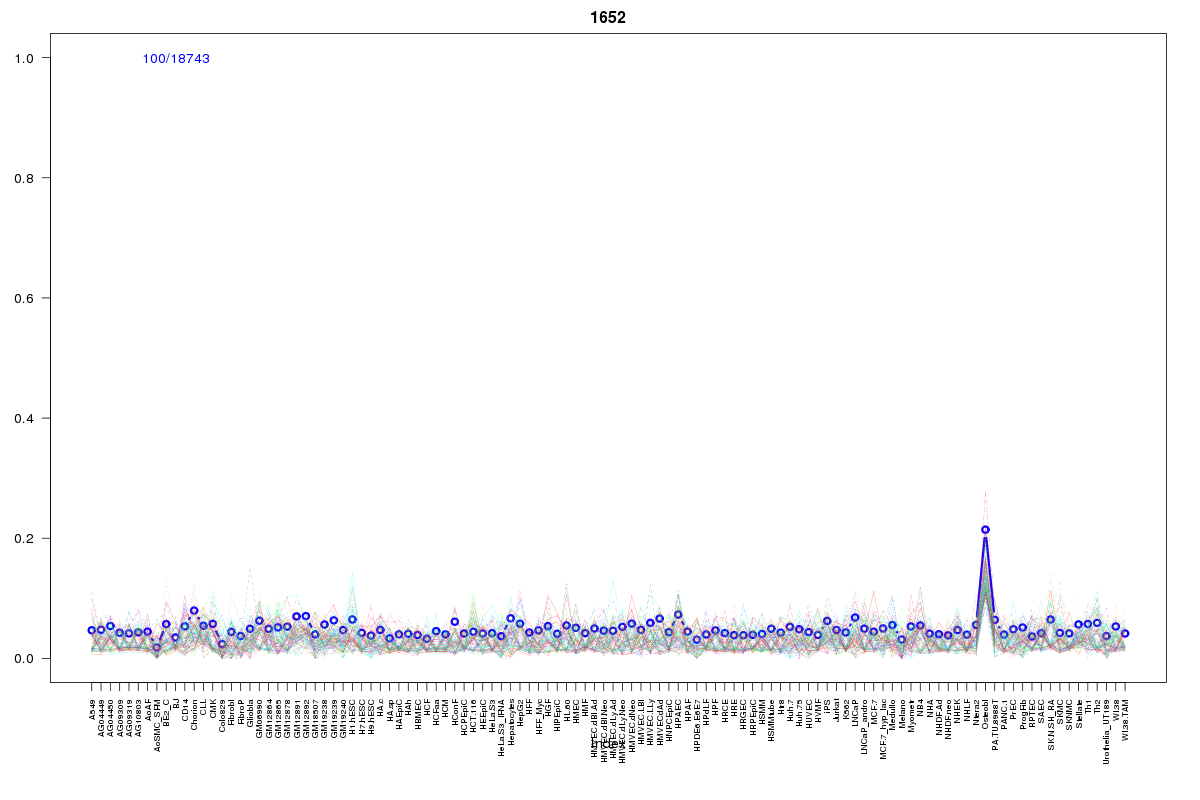 | 1652 | 2 |
 | 860 | 2 |
 | 2288 | 1 |
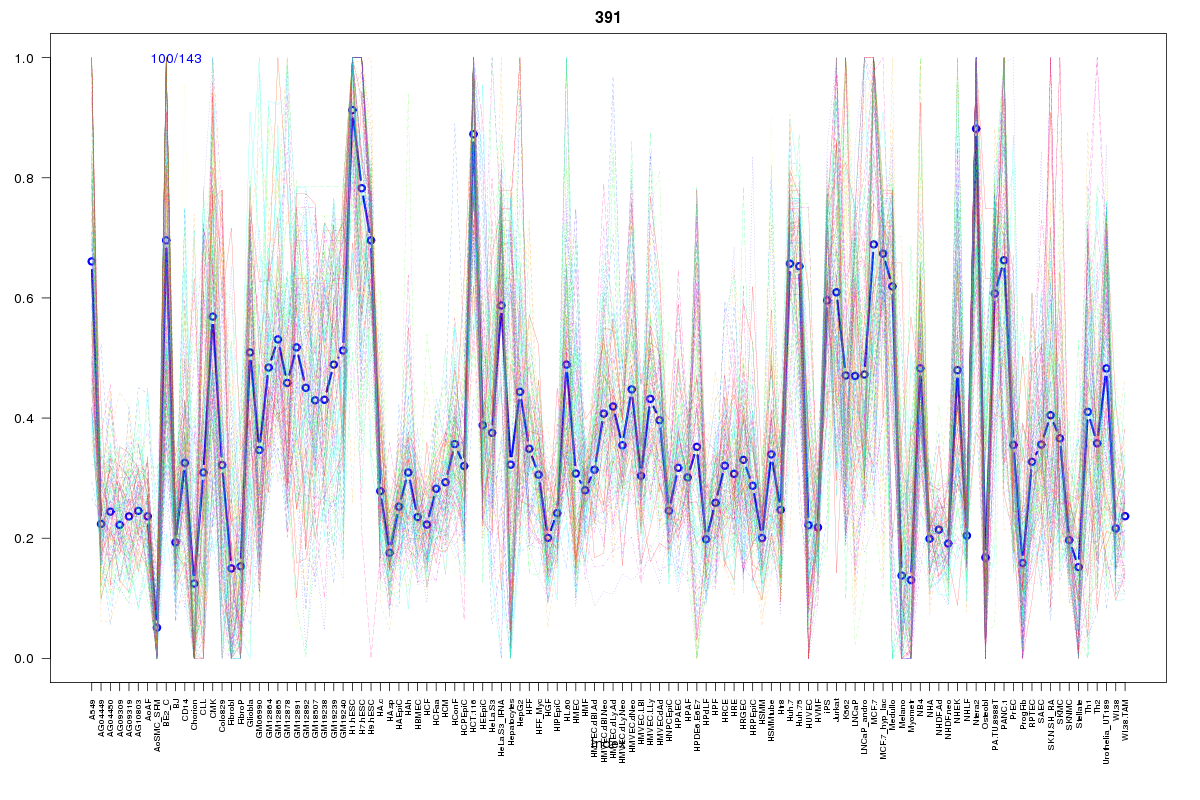 | 391 | 1 |
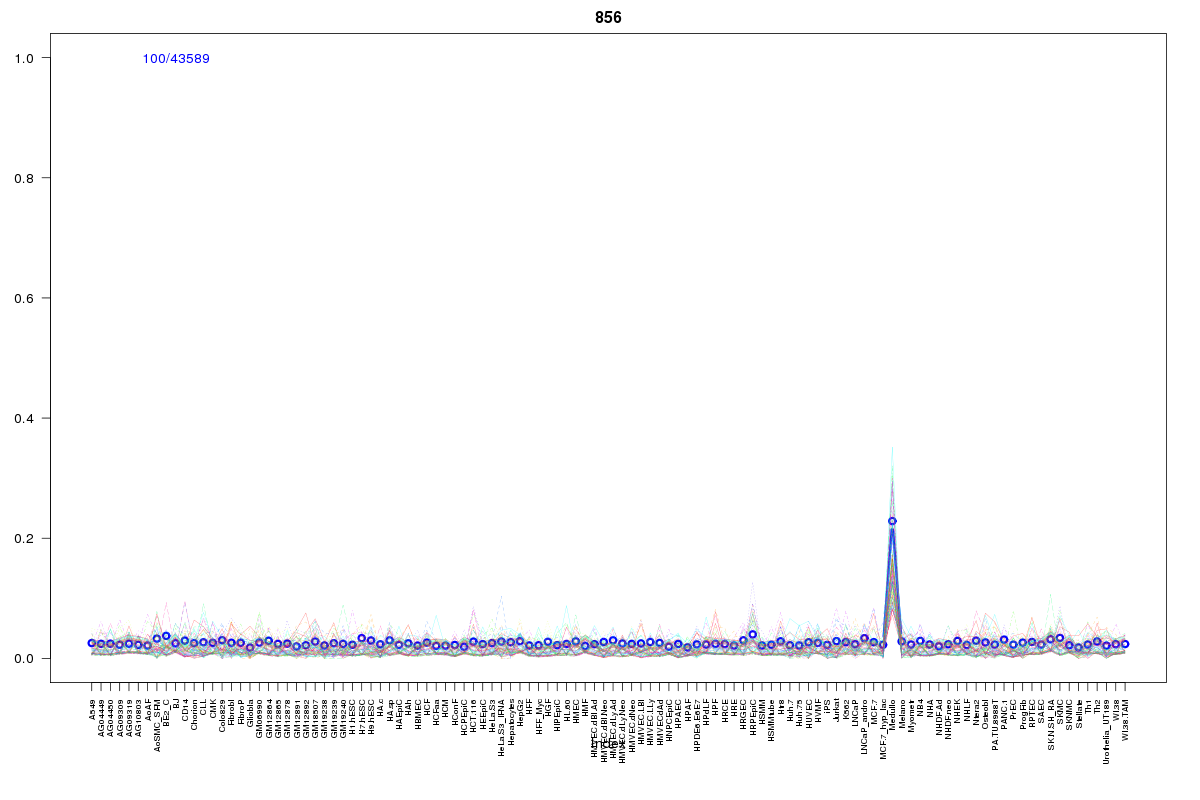 | 856 | 1 |
 | 15 | 1 |
 | 1311 | 1 |
 | 2052 | 1 |
 | 2055 | 1 |
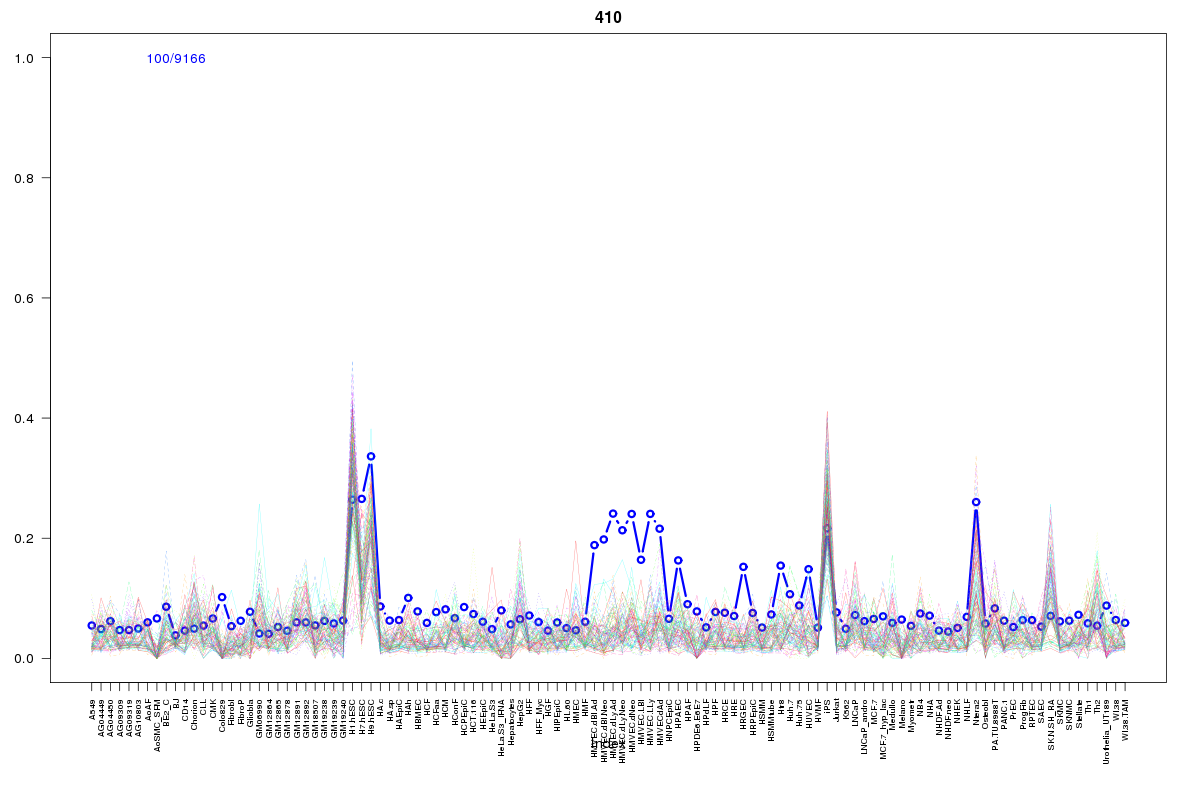 | 410 | 1 |
 | 430 | 1 |
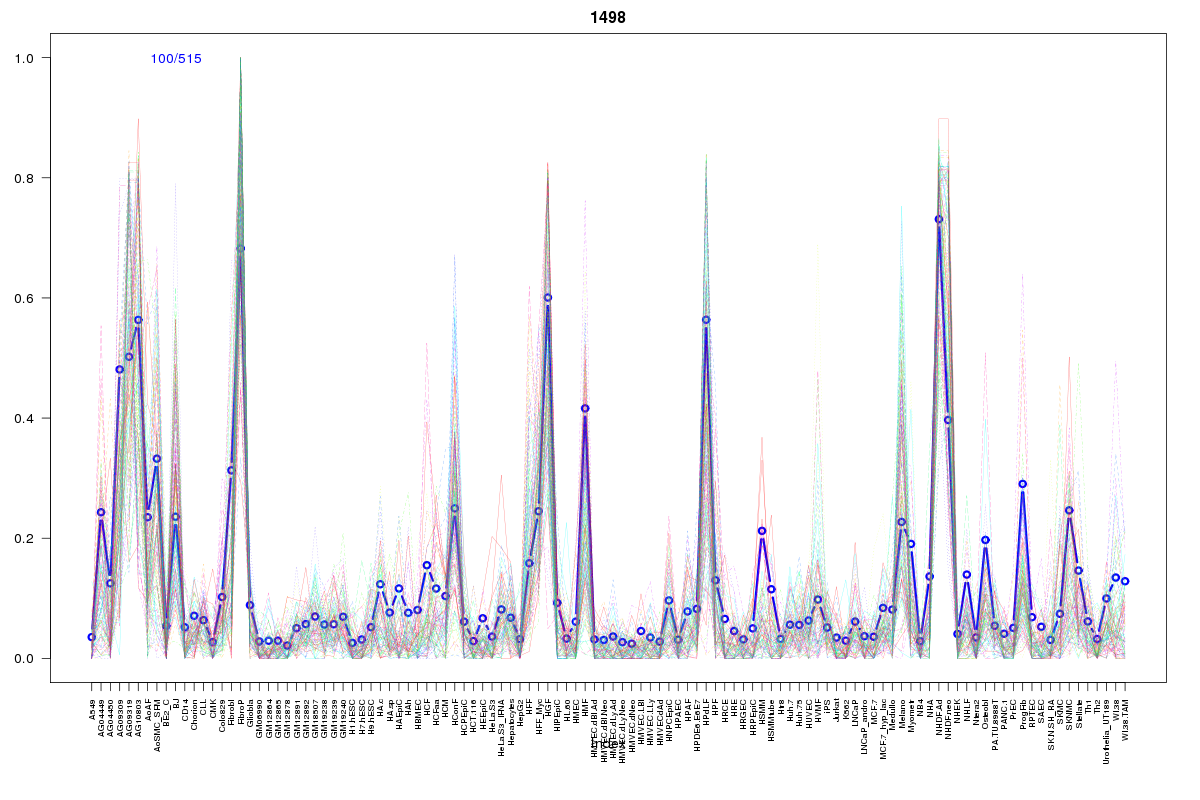 | 1498 | 1 |
 | 626 | 1 |
Resources
BED file downloads
Connects to 25 DHS sitesTop 10 Correlated DHS Sites
p-values indiciate significant higher or lower correlation| Location | Cluster | P-value |
|---|---|---|
| chr20:31878445-31878595 | 2052 | 0.003 |
| chr20:31859245-31859395 | 1755 | 0.003 |
| chr20:31764585-31764735 | 626 | 0.003 |
| chr20:31814885-31815035 | 1755 | 0.009 |
| chr20:31711645-31711795 | 1754 | 0.01 |
| chr20:31802345-31802495 | 1755 | 0.01 |
| chr20:31781865-31782015 | 1754 | 0.01 |
| chr20:31823485-31823635 | 860 | 0.012 |
| chr20:31788905-31789055 | 1605 | 0.014 |
| chr20:31858305-31858455 | 1605 | 0.014 |
| chr20:31751565-31751715 | 1605 | 0.014 |
External Databases
UCSCEnsembl (ENSG00000131059)