Gene: GTPBP3
chr19: 17445728-17452777Expression Profile
(log scale)
Graphical Connections
Distribution of linked clusters:
You may find it interesting if many of the connected DHS sites belong to the same cluster.| Cluster Profile | Cluster ID | Number of DHS sites in this cluster |
|---|---|---|
 | 615 | 3 |
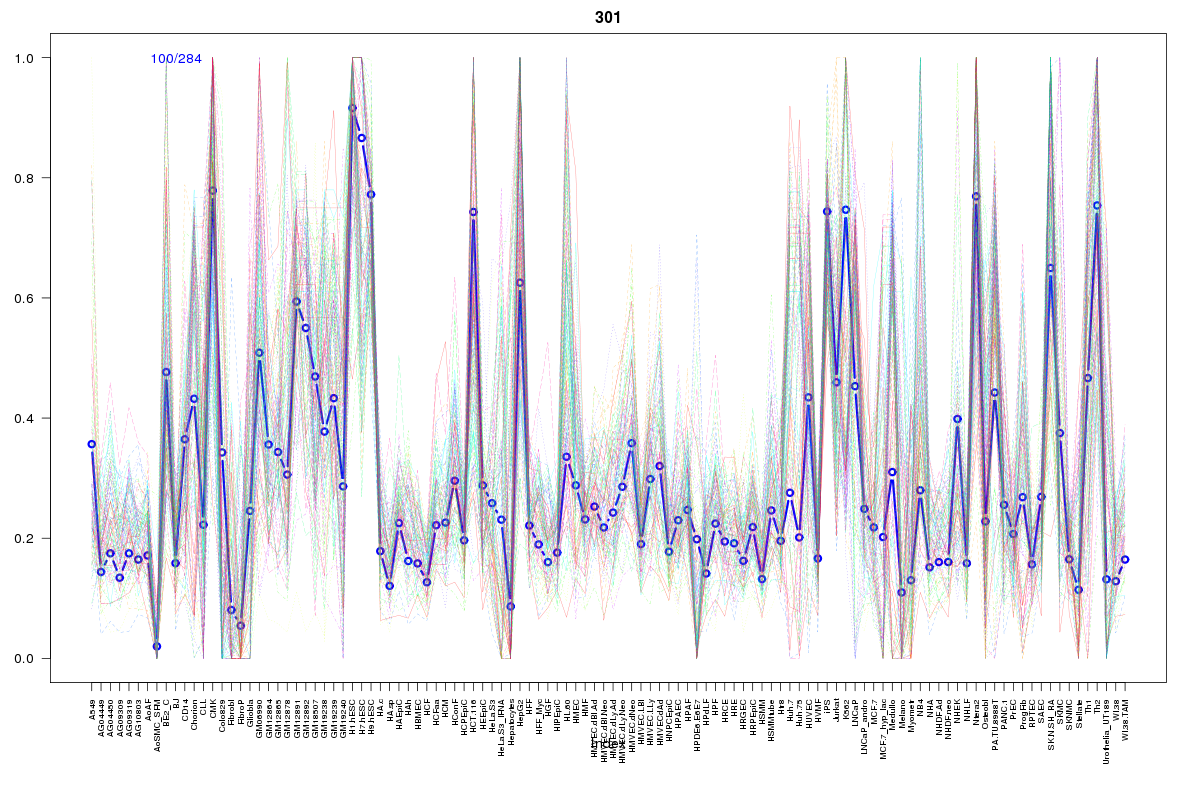 | 301 | 2 |
 | 1115 | 2 |
 | 2122 | 2 |
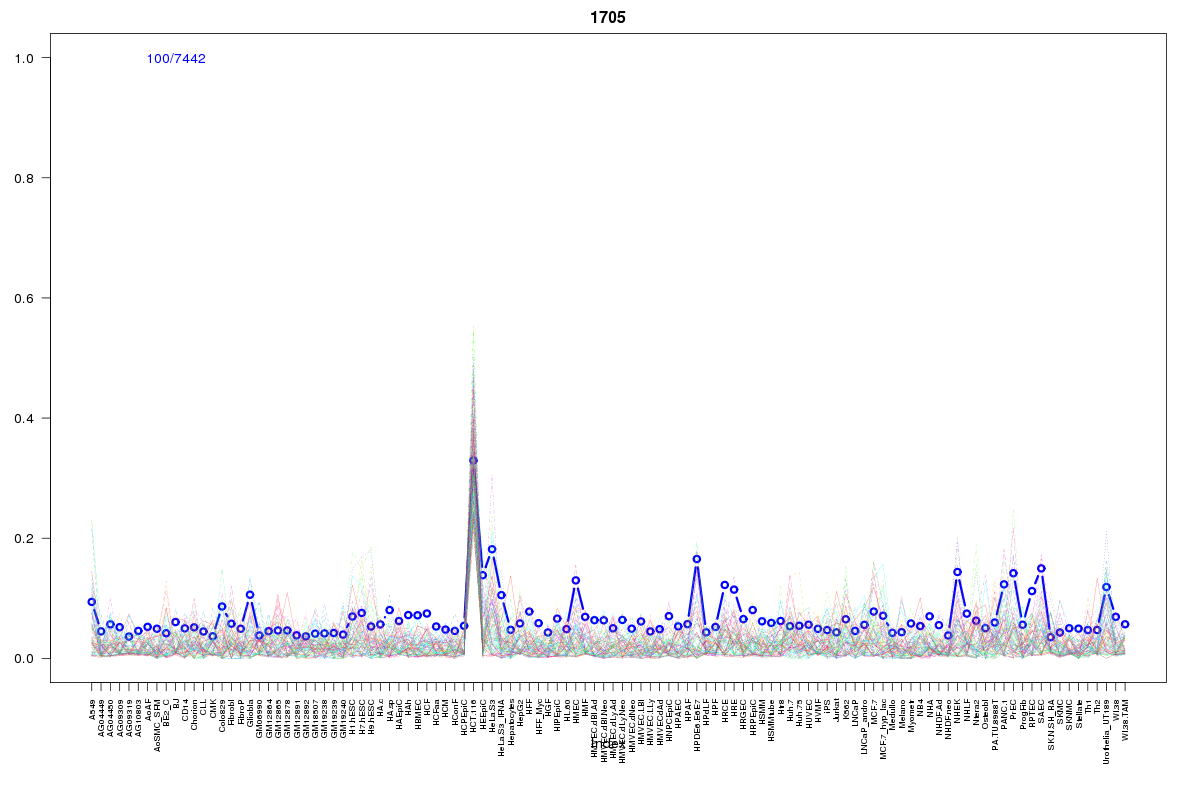 | 1705 | 2 |
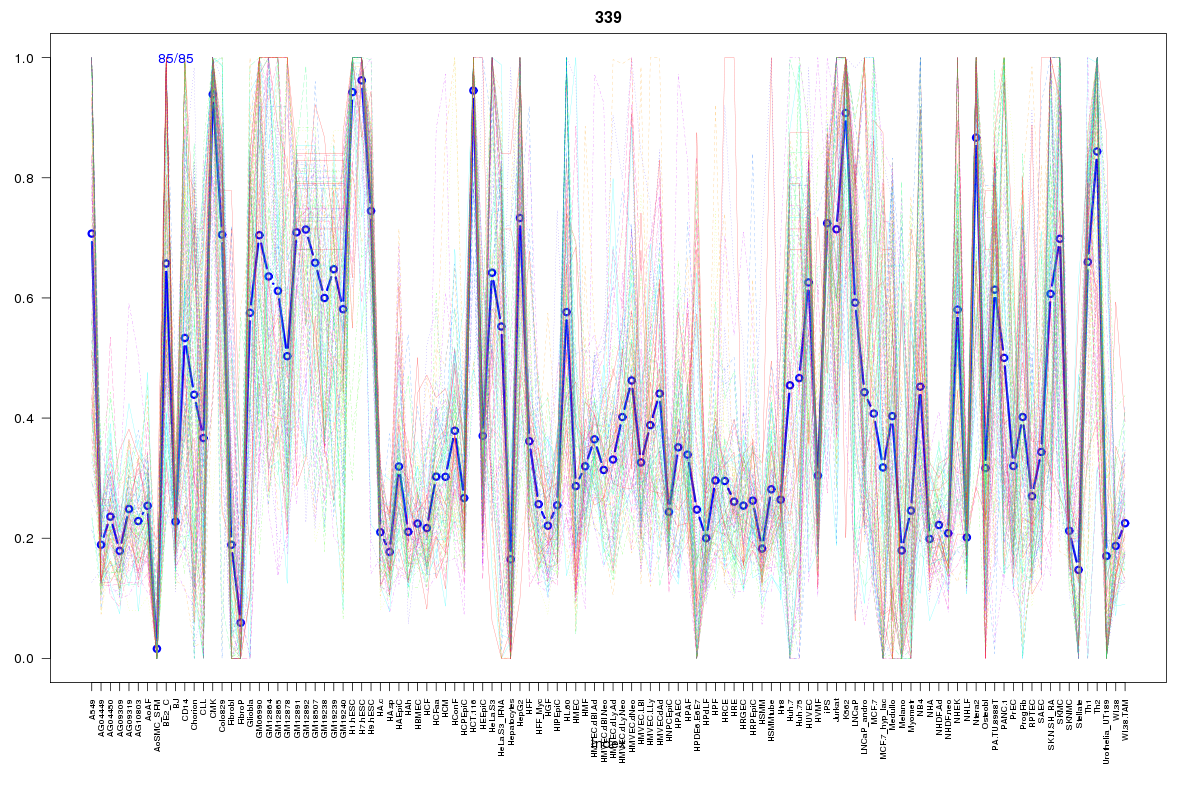 | 339 | 2 |
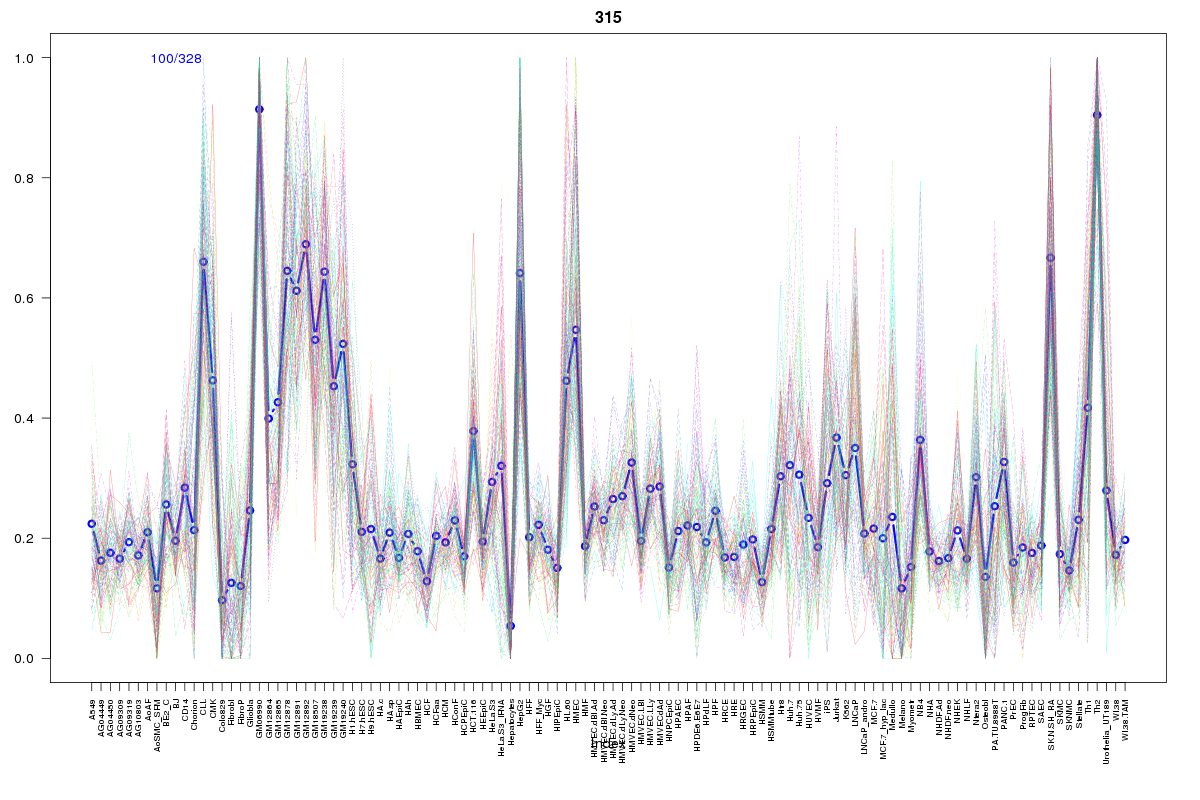 | 315 | 1 |
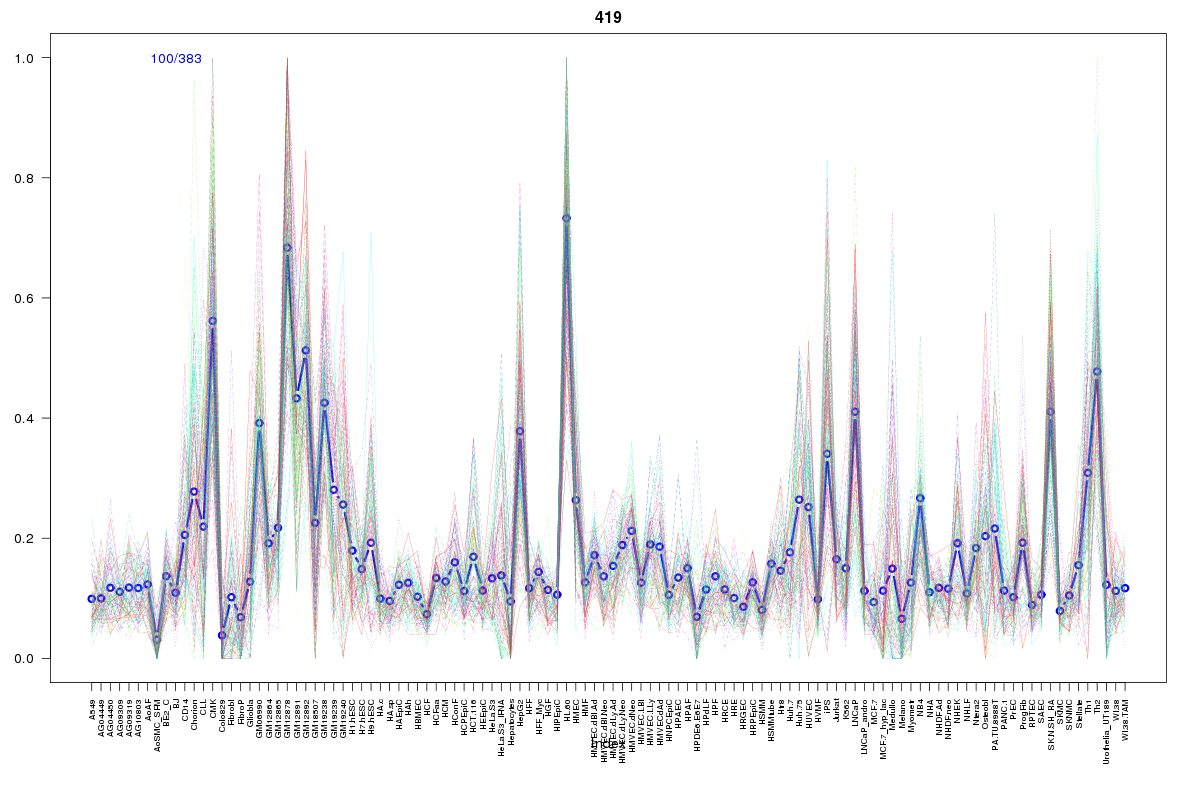 | 419 | 1 |
 | 15 | 1 |
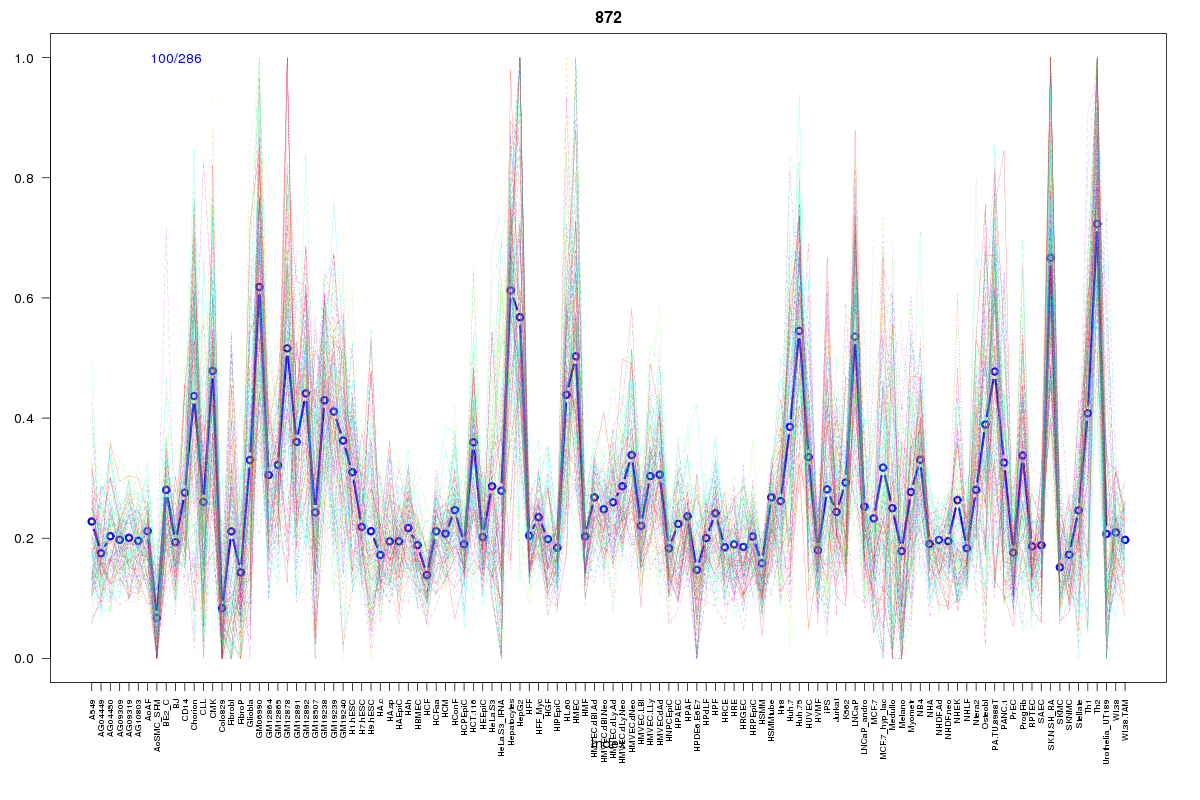 | 872 | 1 |
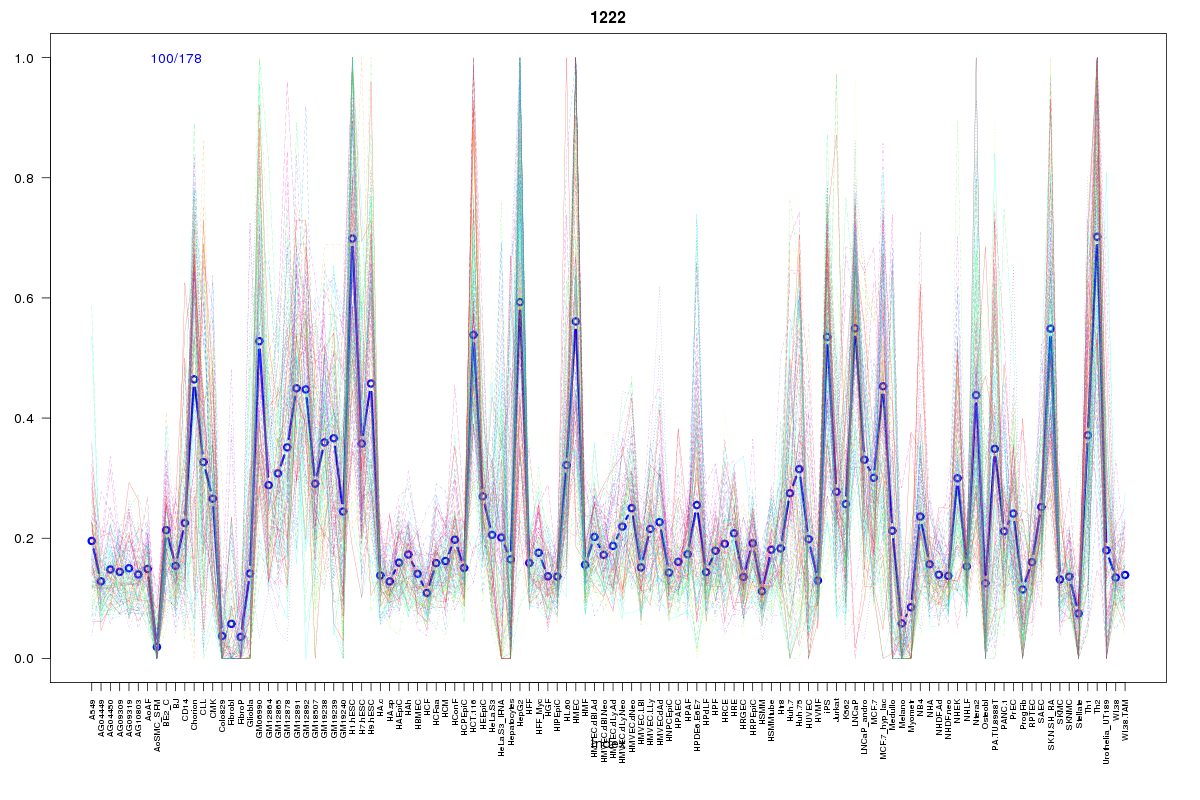 | 1222 | 1 |
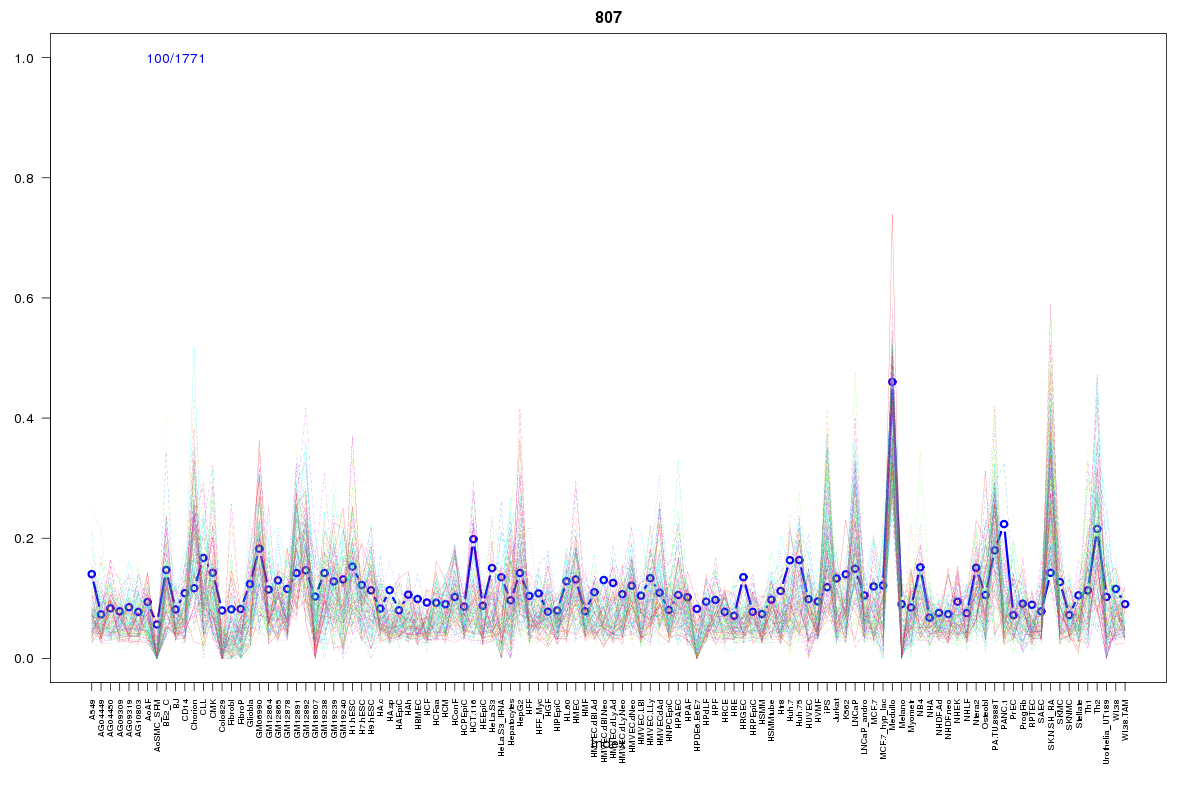 | 807 | 1 |
 | 253 | 1 |
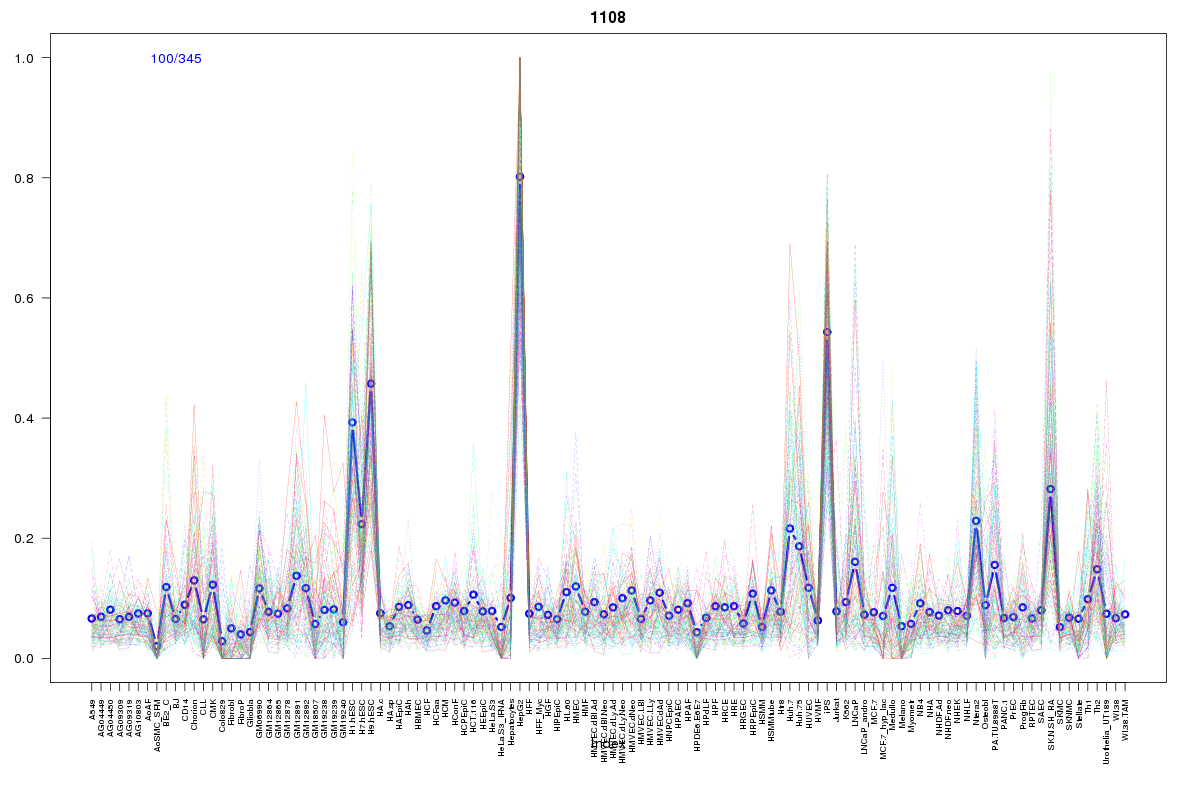 | 1108 | 1 |
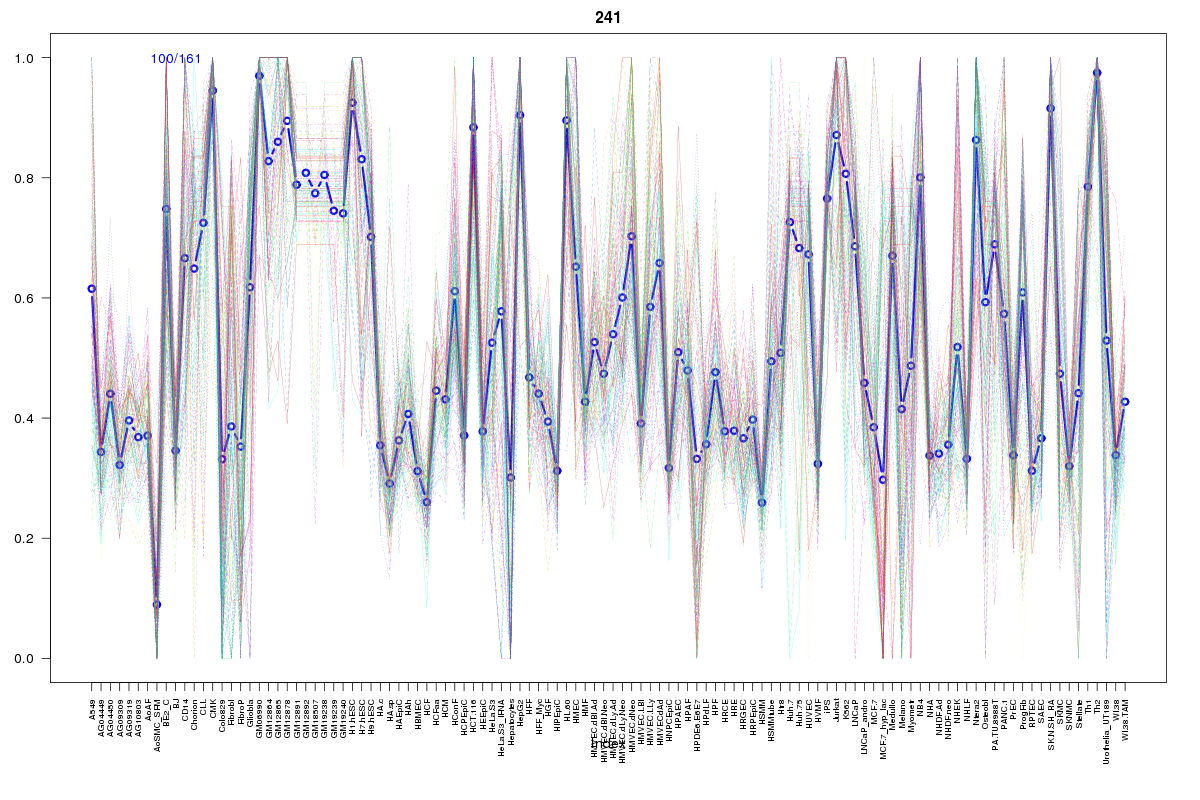 | 241 | 1 |
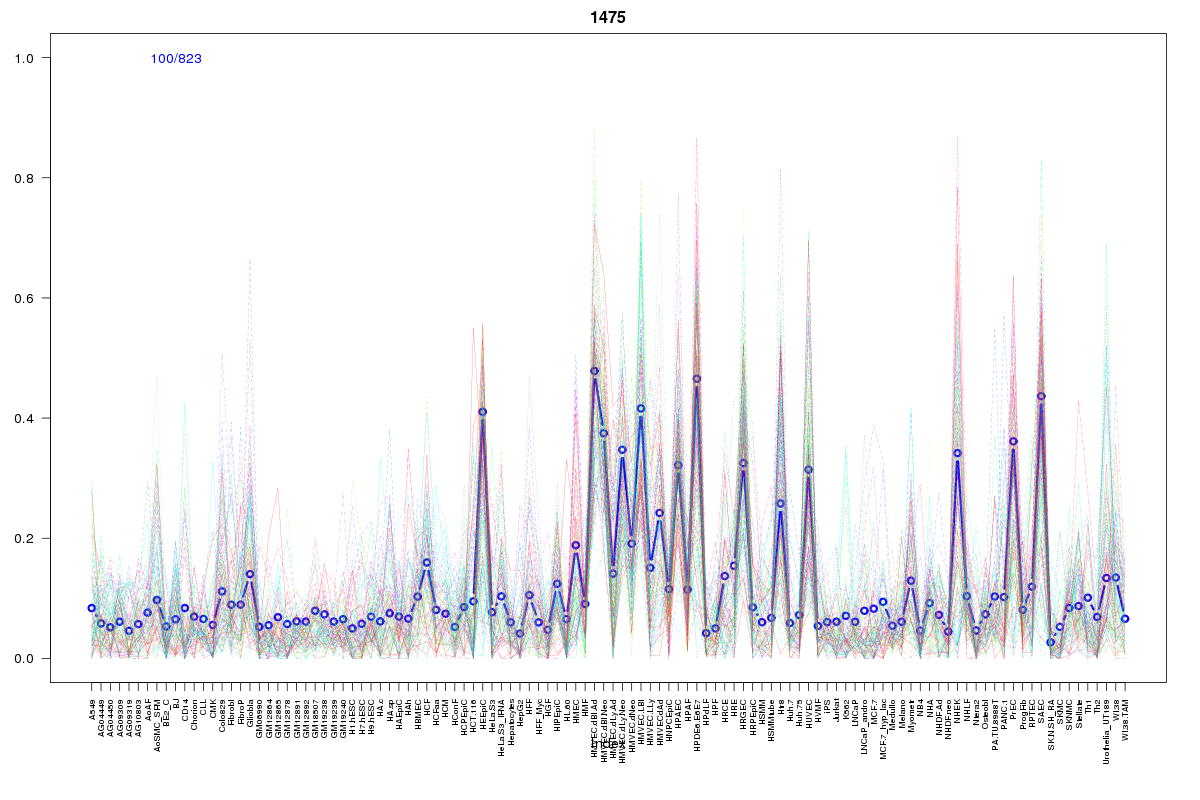 | 1475 | 1 |
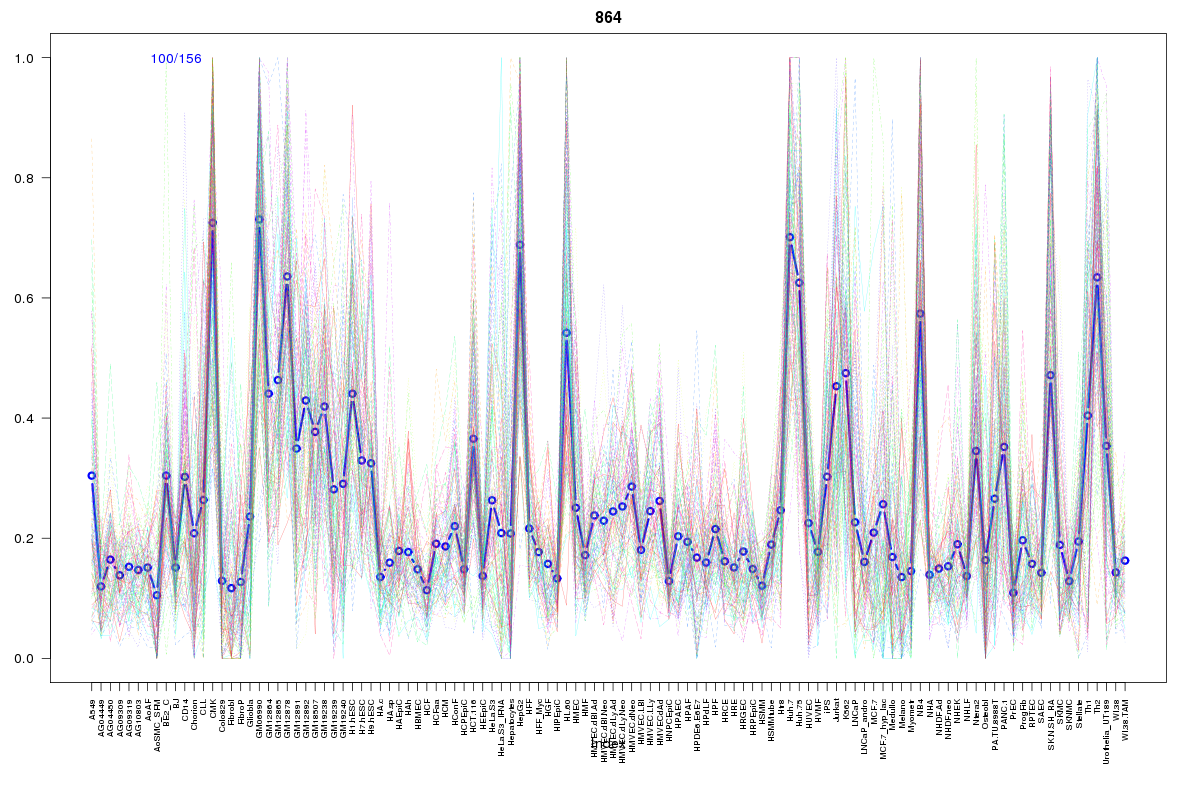 | 864 | 1 |
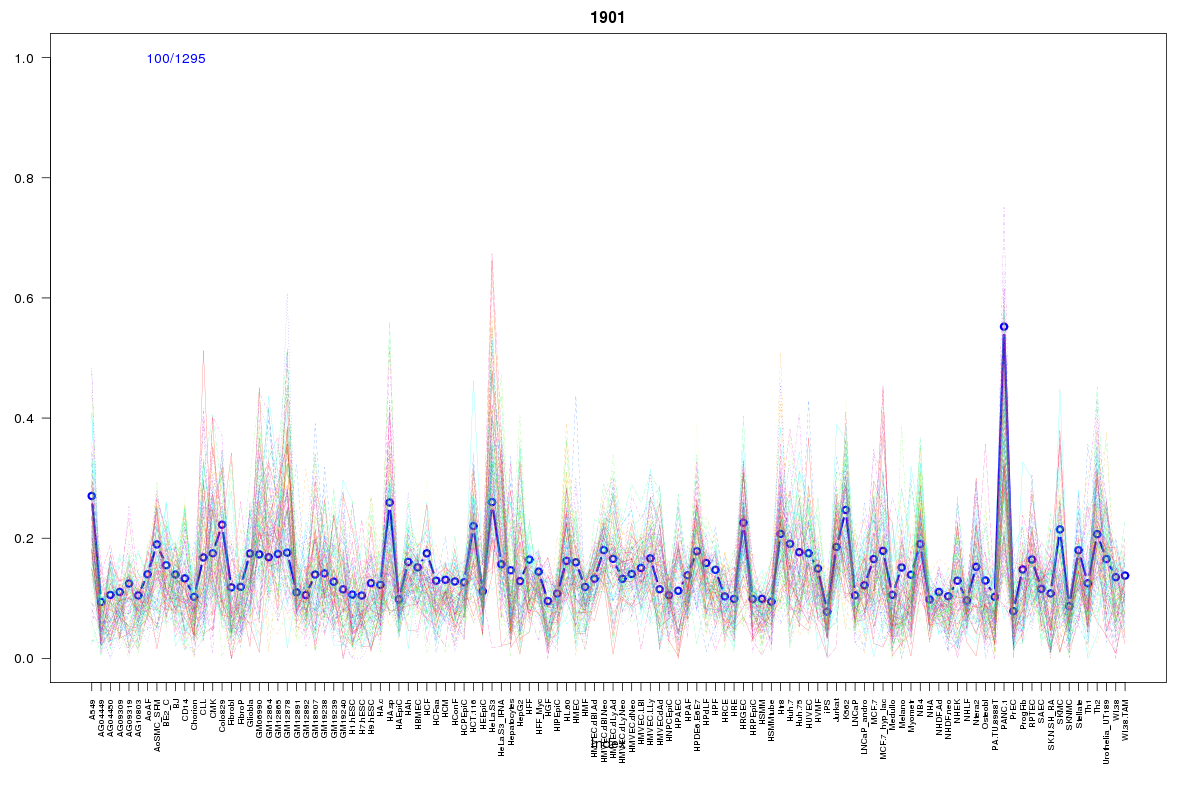 | 1901 | 1 |
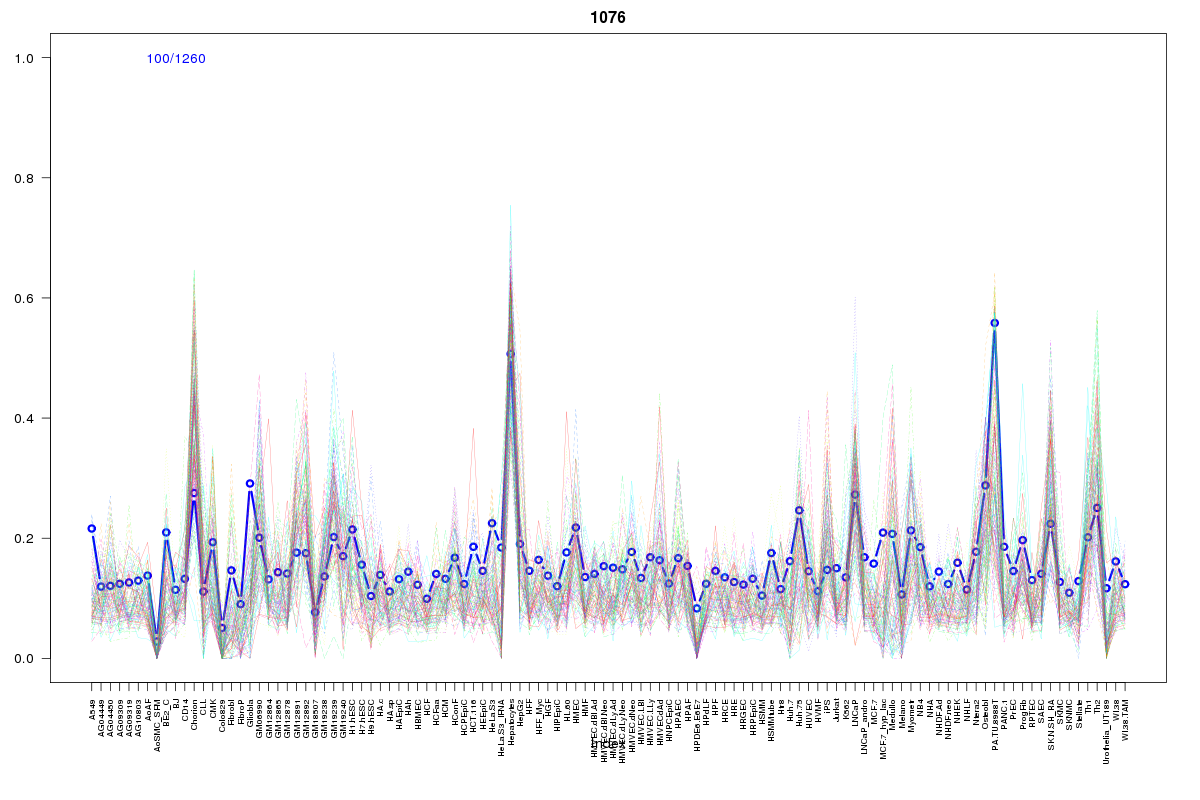 | 1076 | 1 |
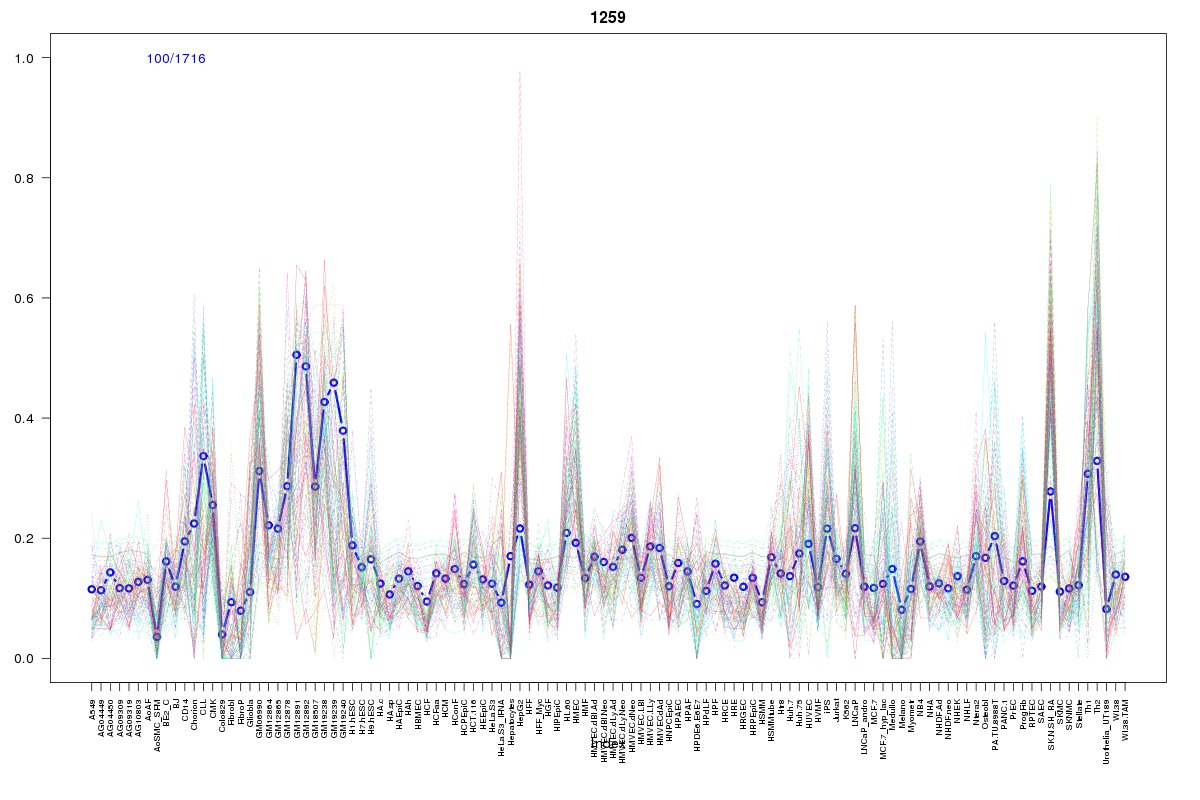 | 1259 | 1 |
 | 1056 | 1 |
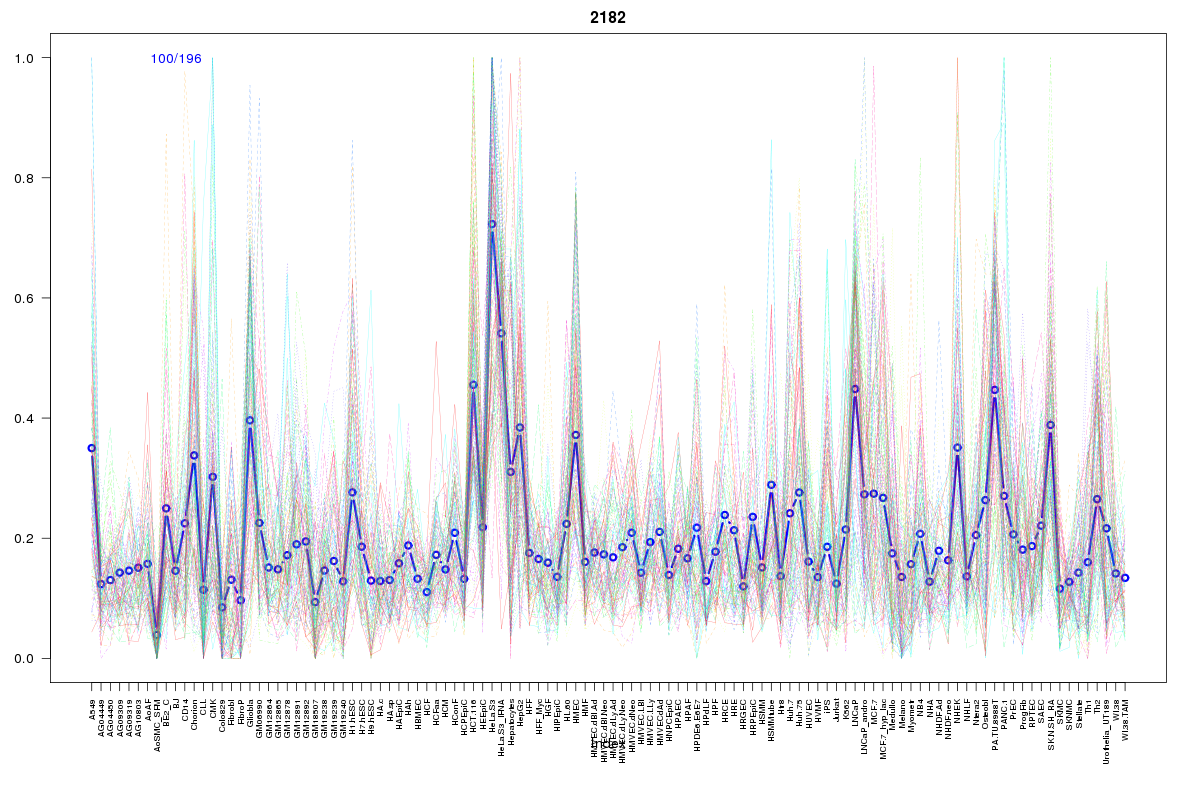 | 2182 | 1 |
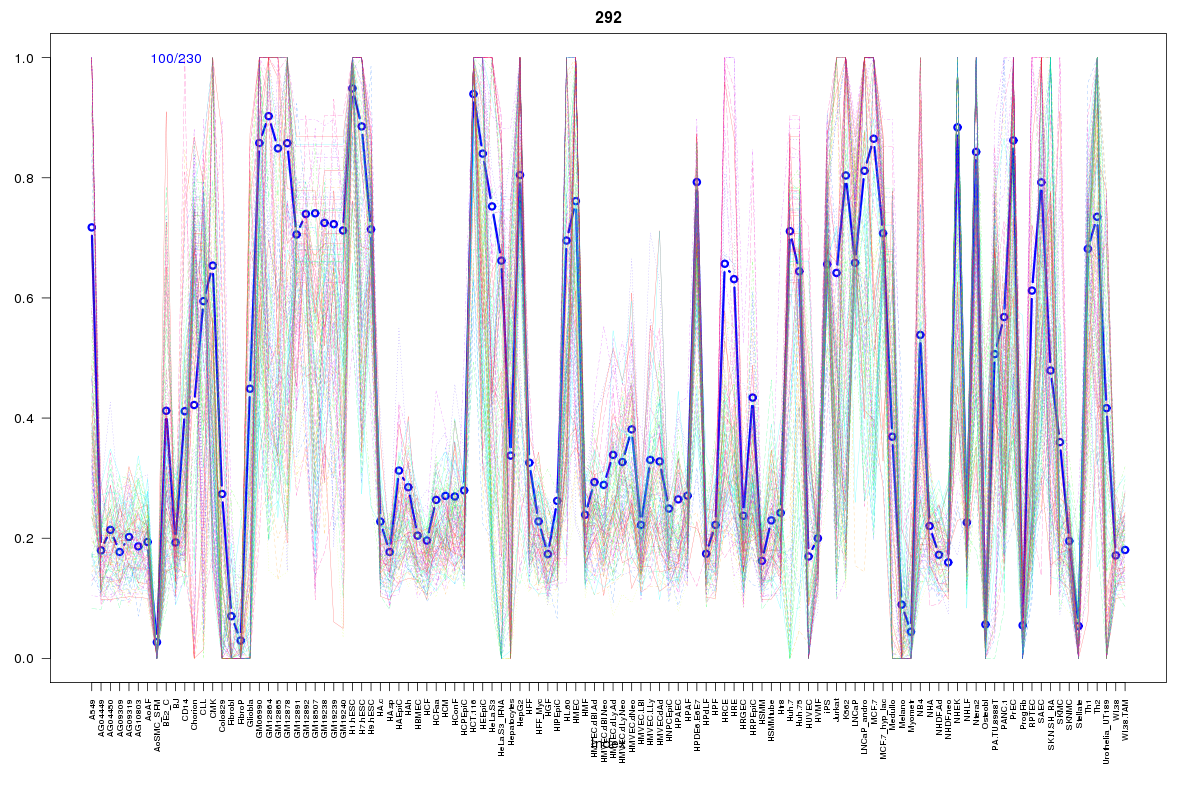 | 292 | 1 |
 | 865 | 1 |
 | 2029 | 1 |
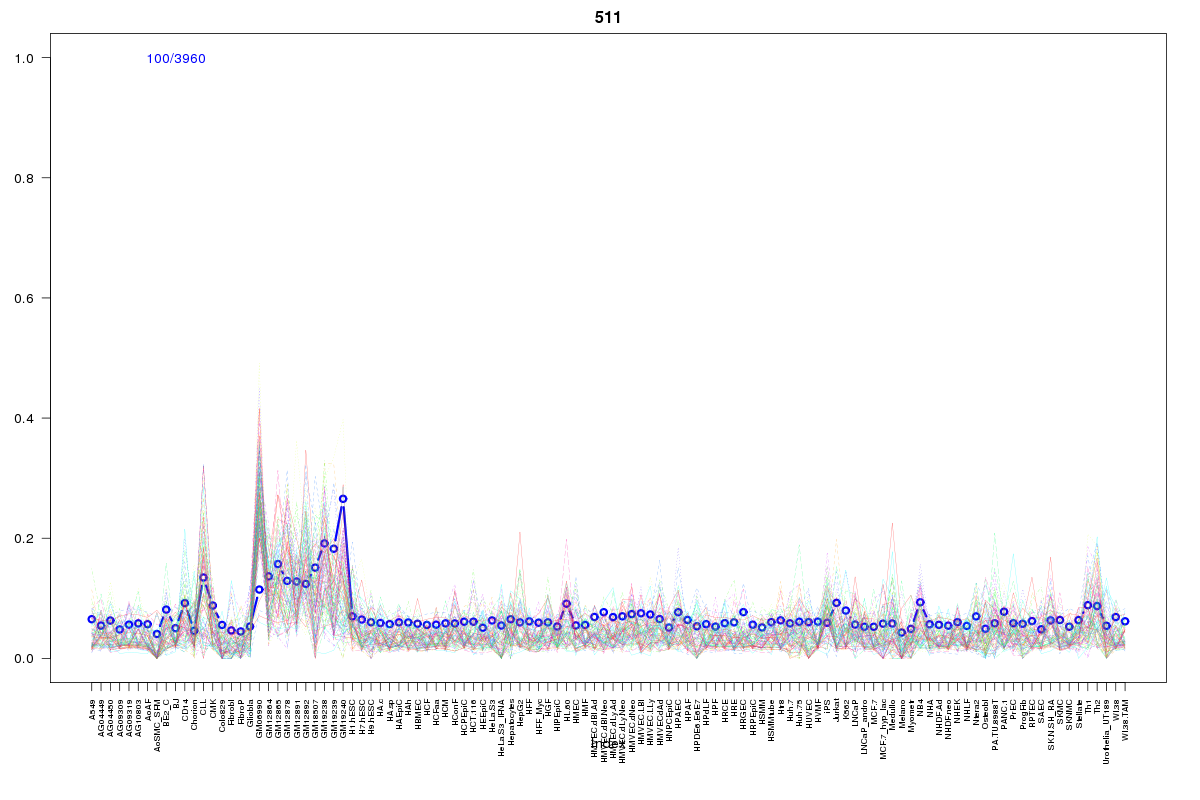 | 511 | 1 |
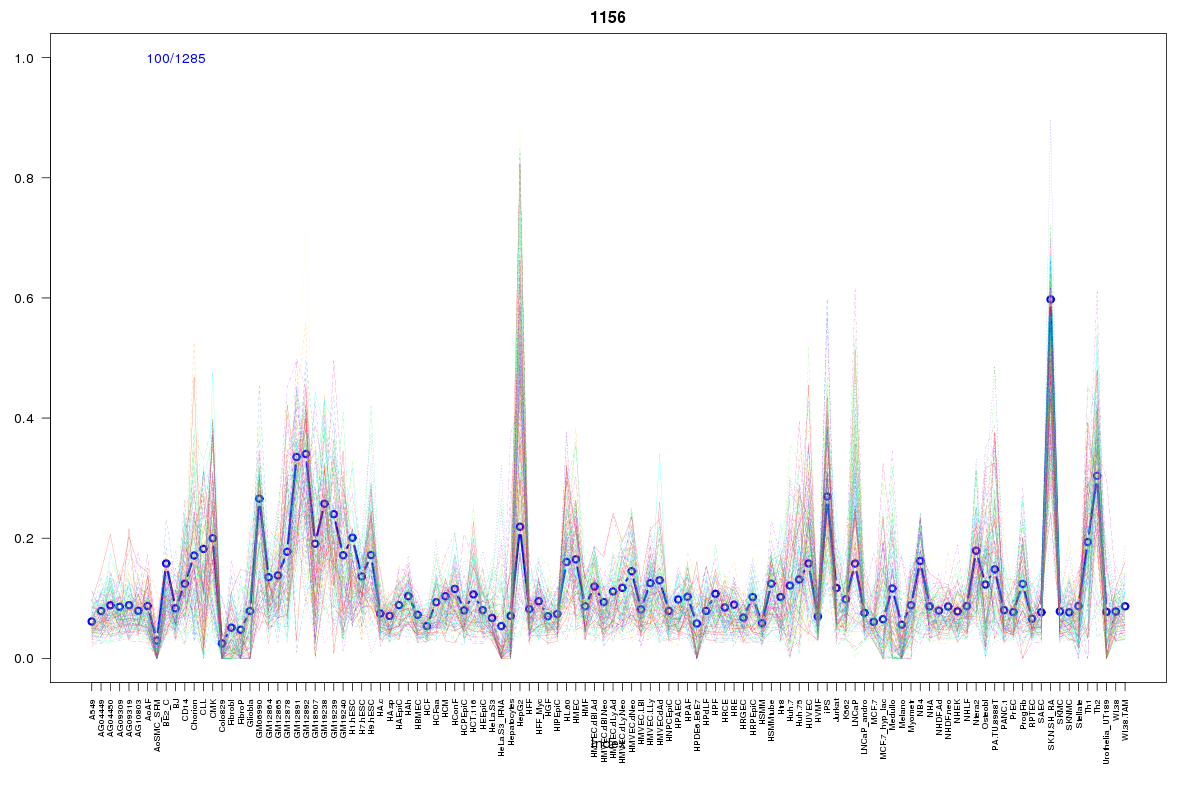 | 1156 | 1 |
 | 402 | 1 |
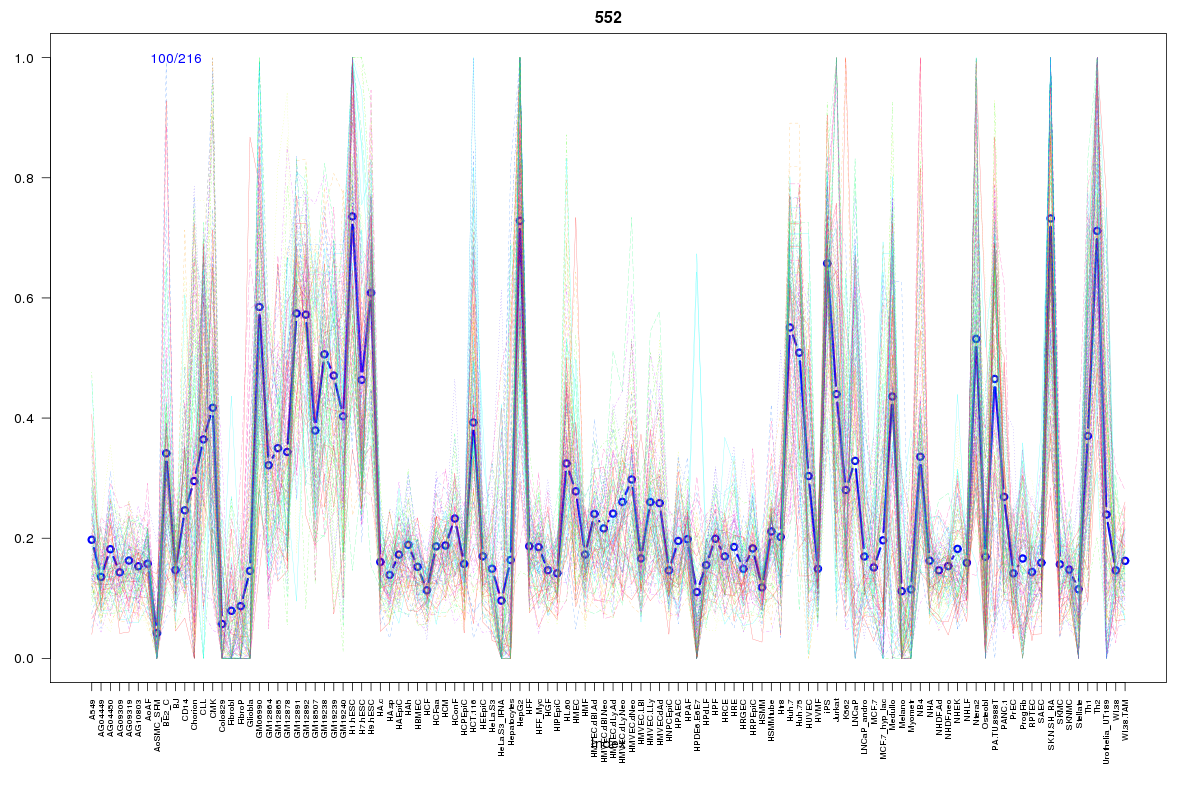 | 552 | 1 |
 | 1755 | 1 |
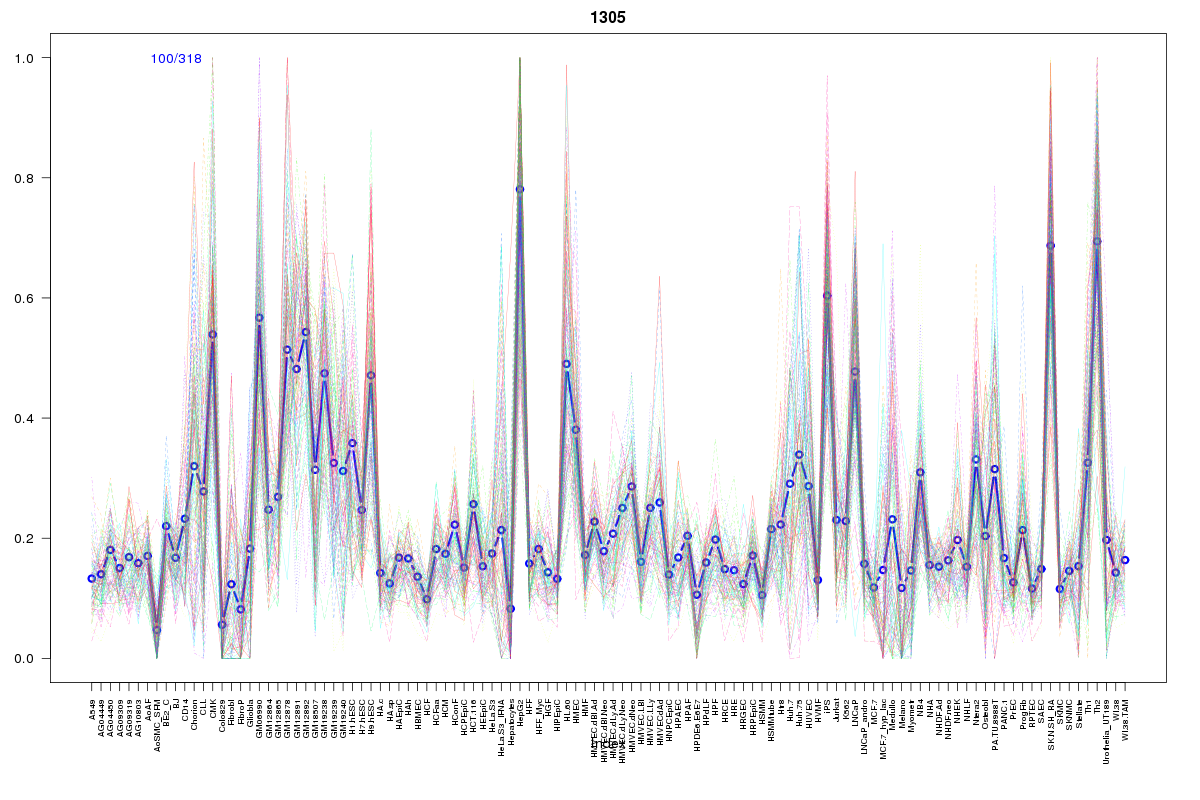 | 1305 | 1 |
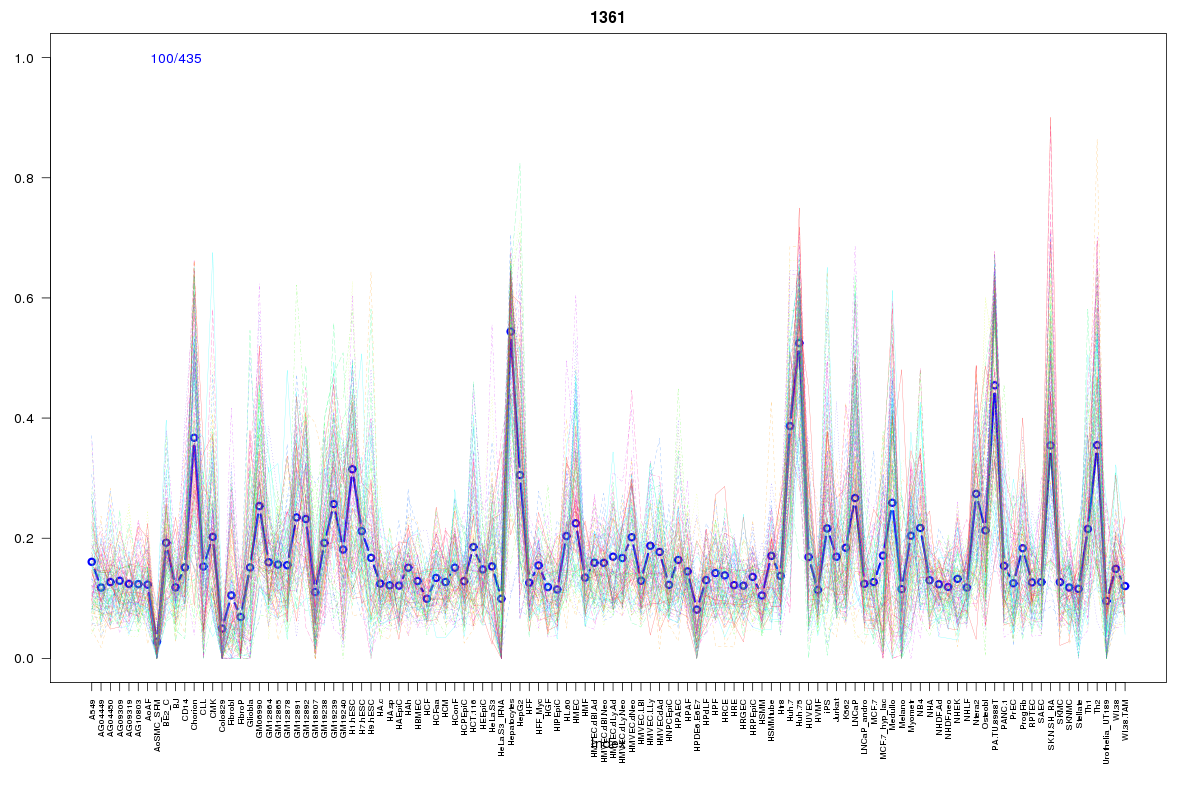 | 1361 | 1 |
 | 194 | 1 |
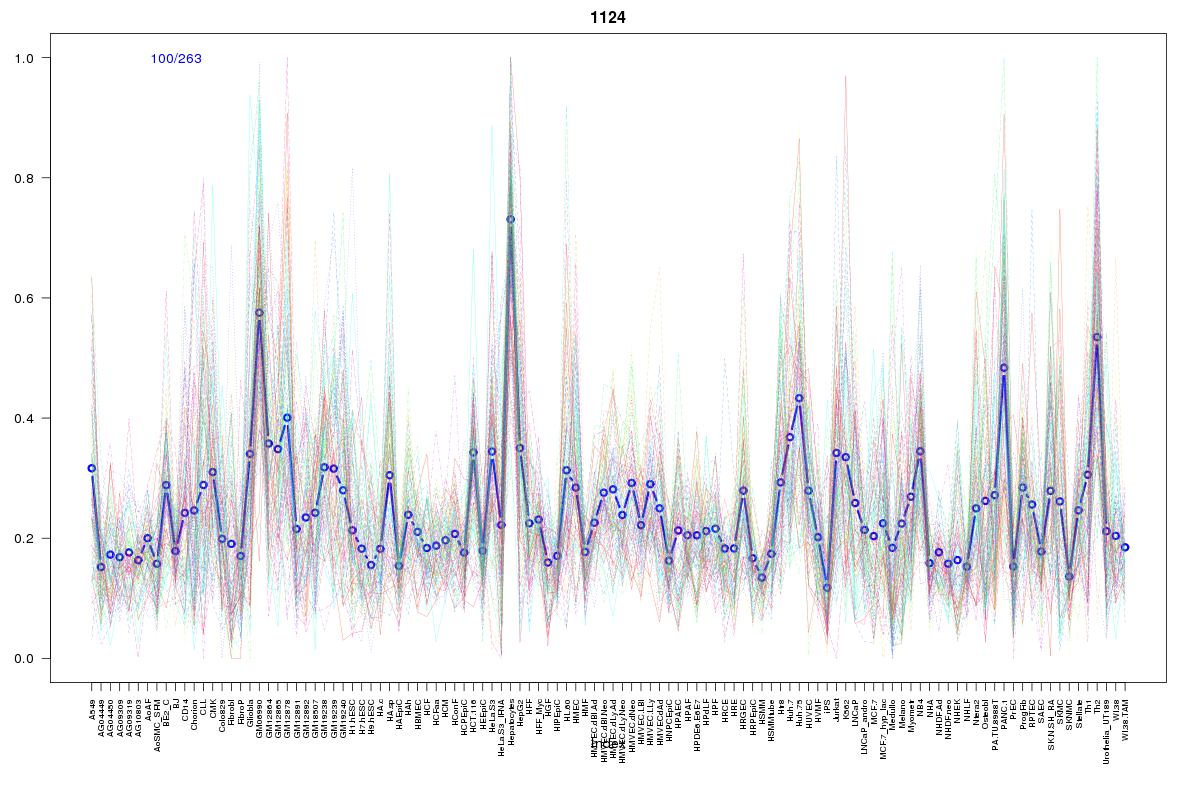 | 1124 | 1 |
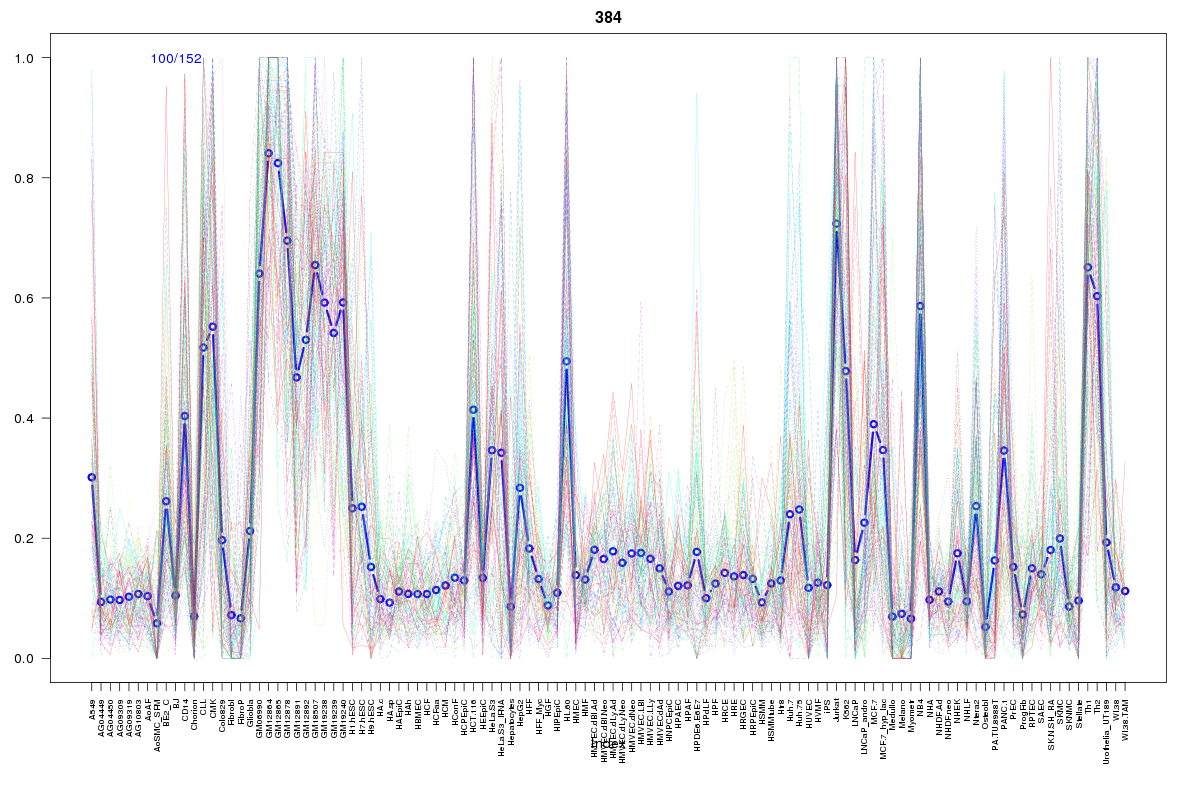 | 384 | 1 |
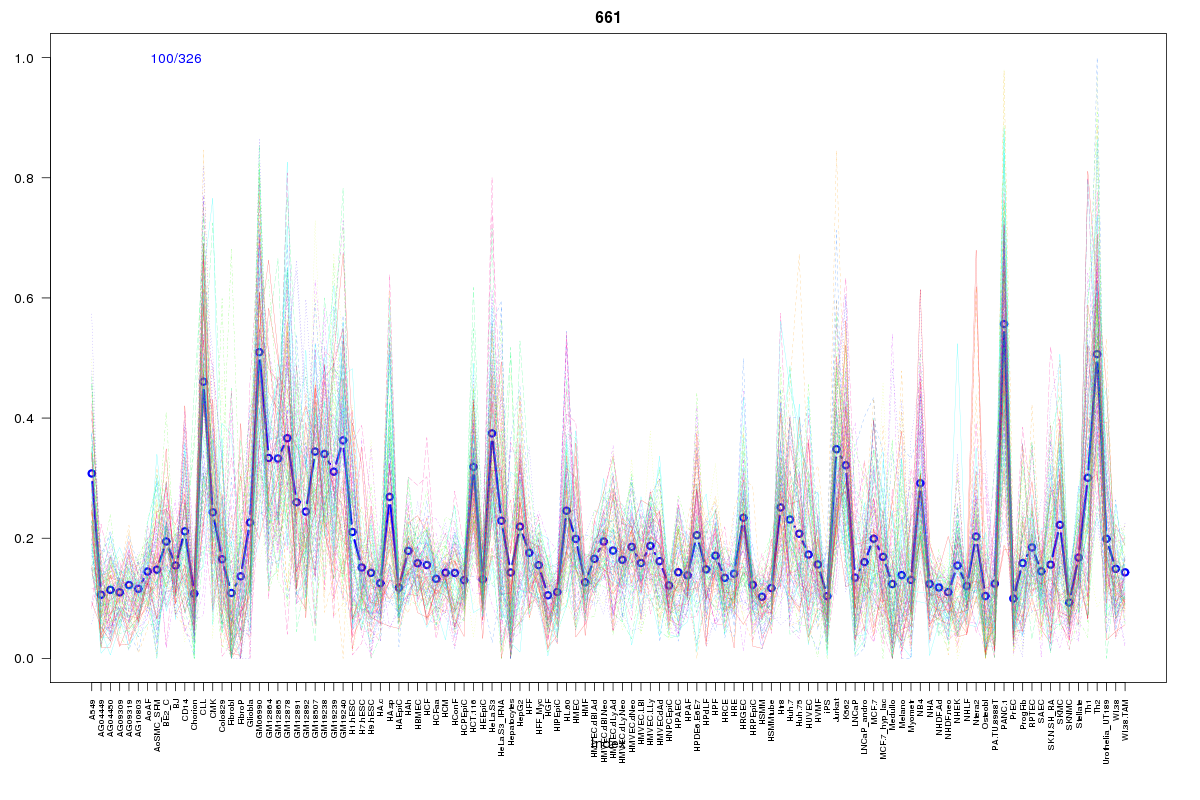 | 661 | 1 |
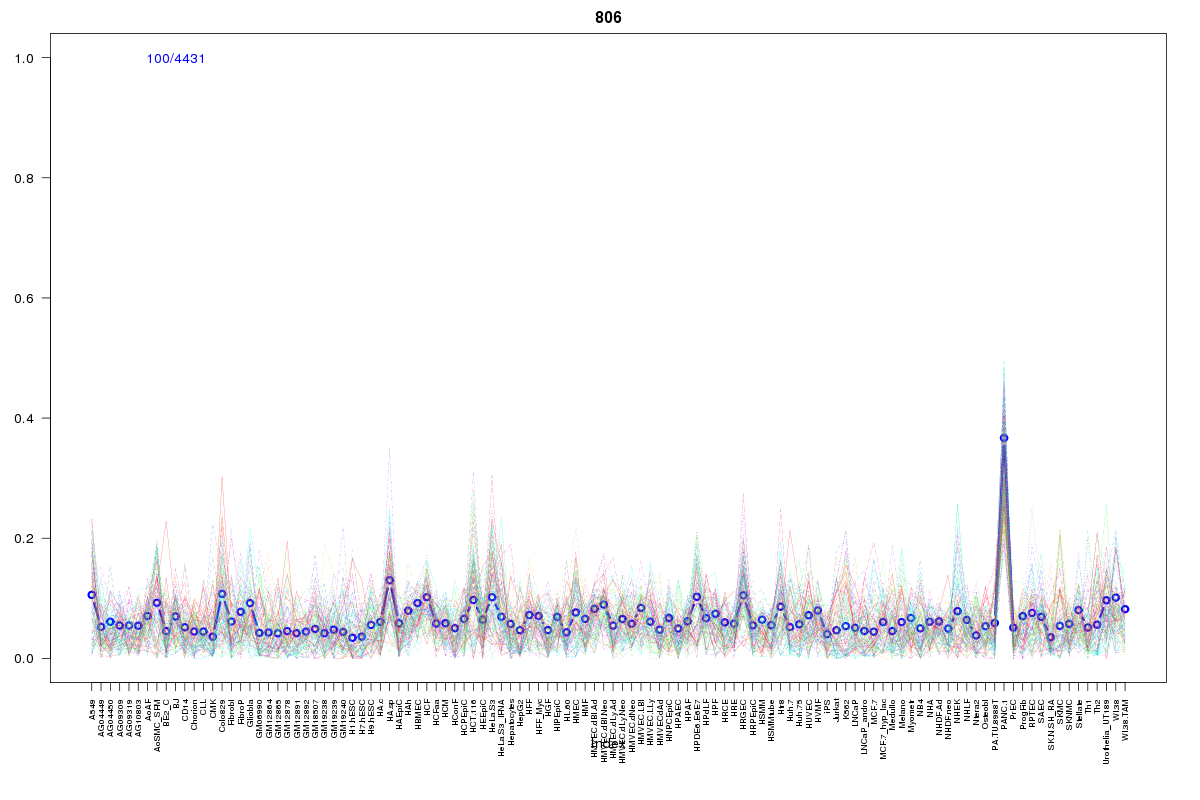 | 806 | 1 |
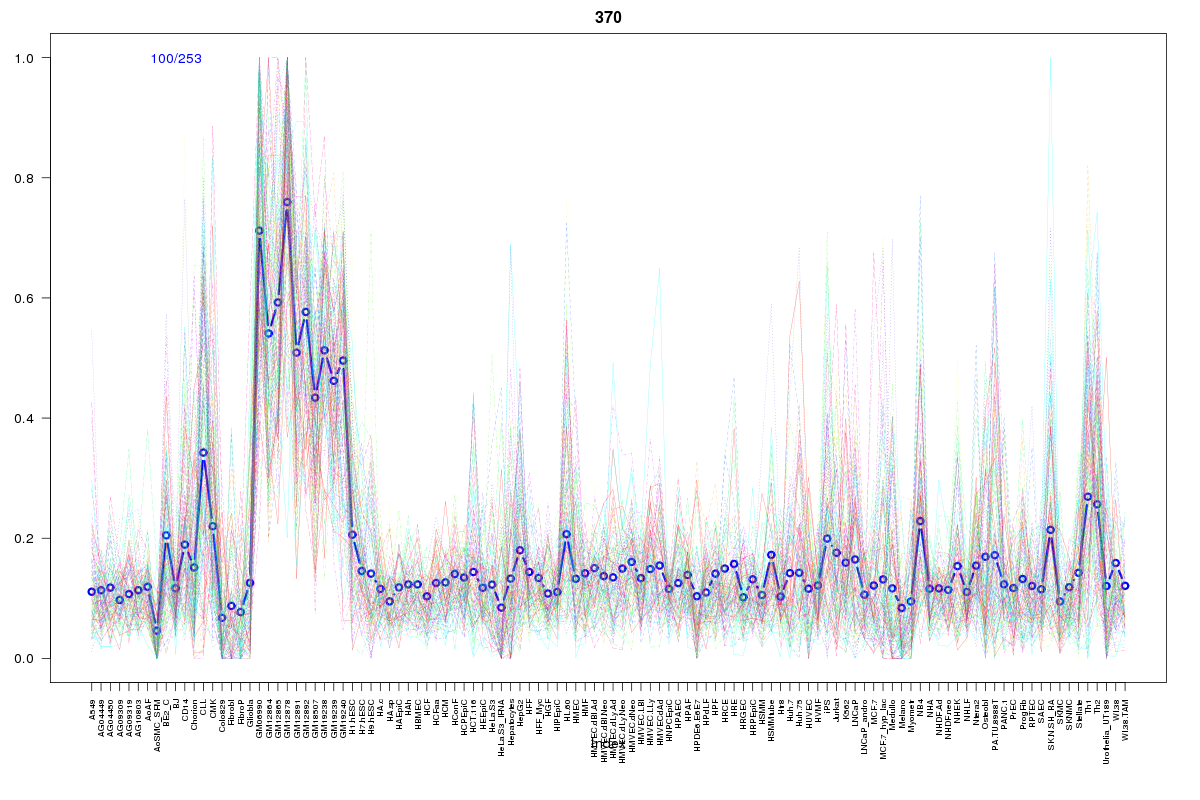 | 370 | 1 |
 | 2075 | 1 |
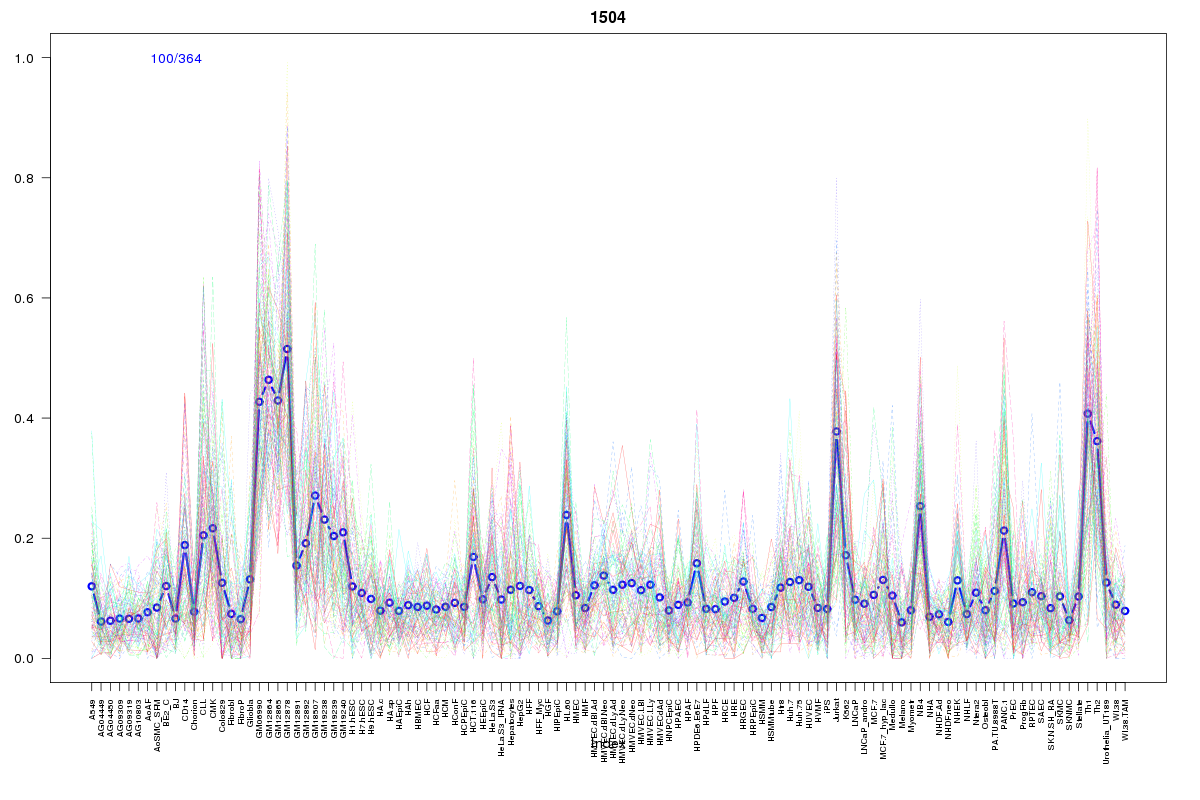 | 1504 | 1 |
 | 133 | 1 |
 | 2110 | 1 |
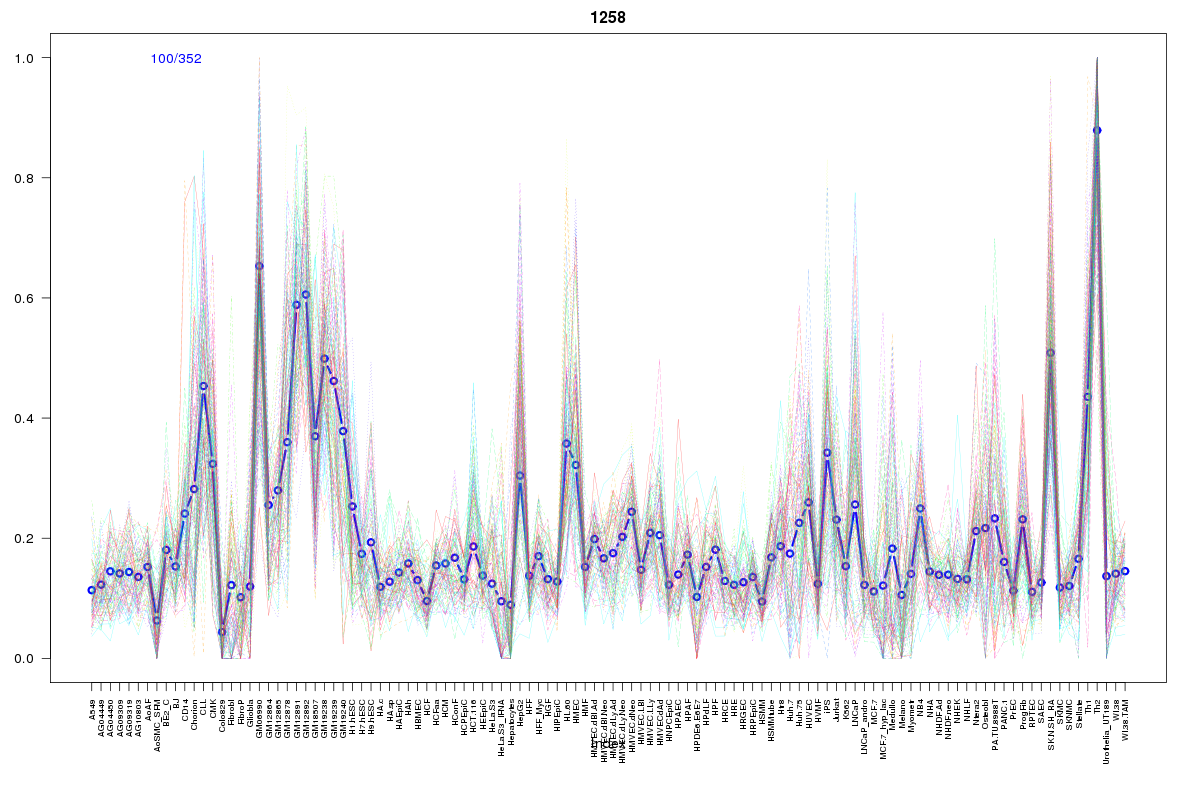 | 1258 | 1 |
 | 2107 | 1 |
Resources
BED file downloads
Connects to 51 DHS sitesTop 10 Correlated DHS Sites
p-values indiciate significant higher or lower correlation| Location | Cluster | P-value |
|---|---|---|
| chr19:17443580-17443730 | 339 | 0 |
| chr19:17443385-17443535 | 2029 | 0 |
| chr19:17447860-17448010 | 133 | 0.001 |
| chr19:17450060-17450210 | 1222 | 0.002 |
| chr19:17420580-17420730 | 864 | 0.002 |
| chr19:17401925-17402075 | 1705 | 0.002 |
| chr19:17494980-17495130 | 865 | 0.002 |
| chr19:17404925-17405075 | 339 | 0.002 |
| chr19:17444560-17444710 | 402 | 0.002 |
| chr19:17518400-17518550 | 2110 | 0.002 |
| chr19:17447660-17447810 | 2075 | 0.002 |
External Databases
UCSCEnsembl (ENSG00000130299)