Gene: BATF3
chr1: 212859759-212873327Expression Profile
(log scale)
Graphical Connections
Distribution of linked clusters:
You may find it interesting if many of the connected DHS sites belong to the same cluster.| Cluster Profile | Cluster ID | Number of DHS sites in this cluster |
|---|---|---|
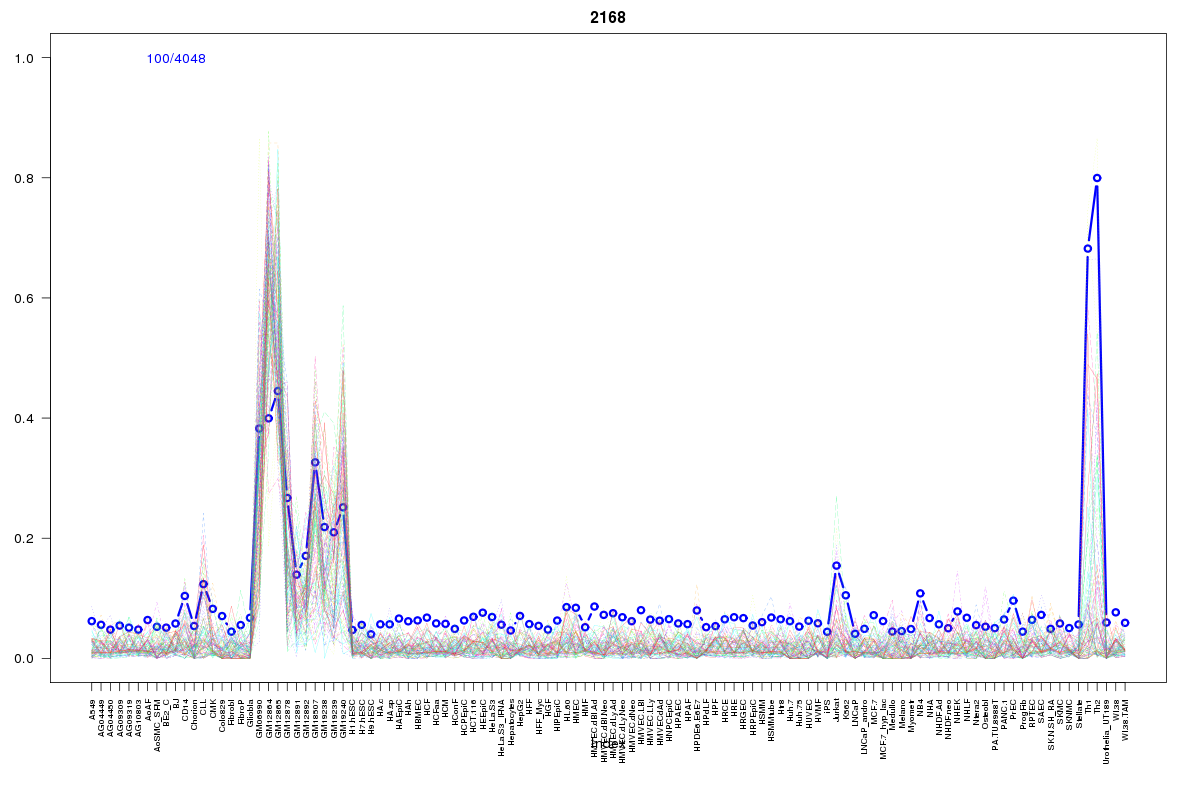 | 2168 | 3 |
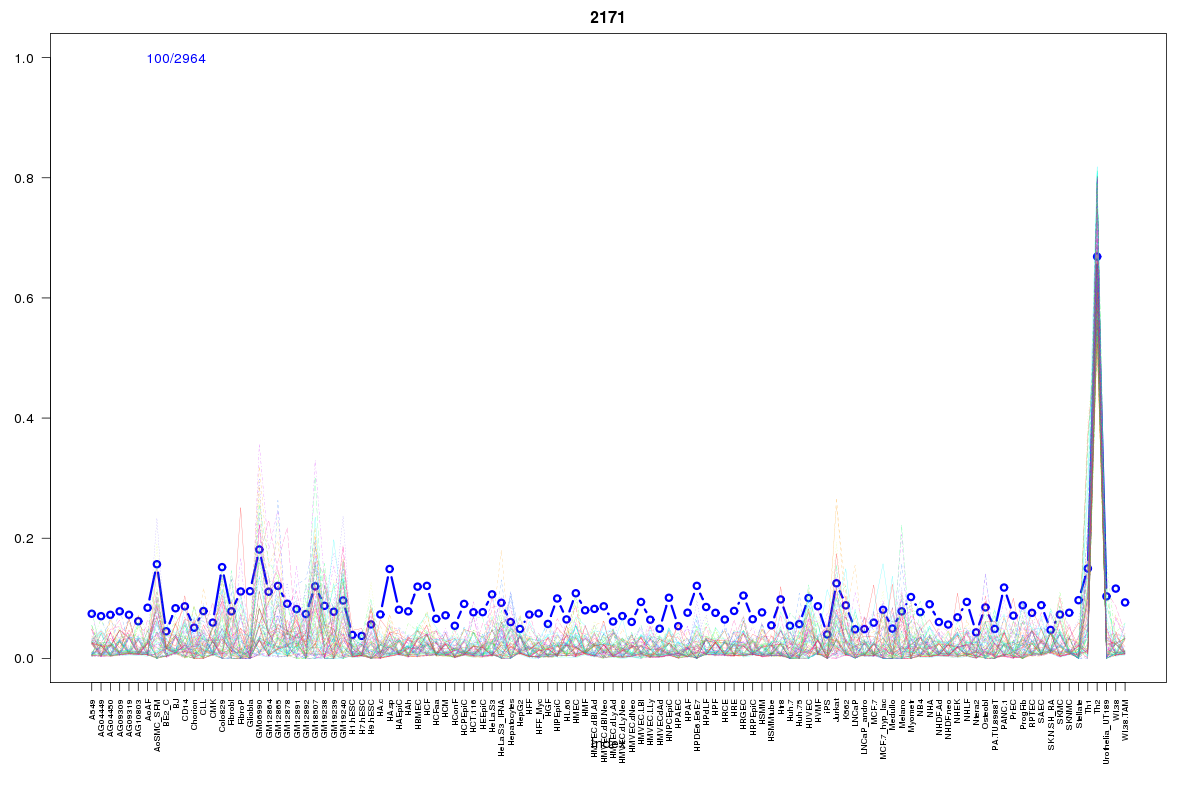 | 2171 | 3 |
 | 2072 | 2 |
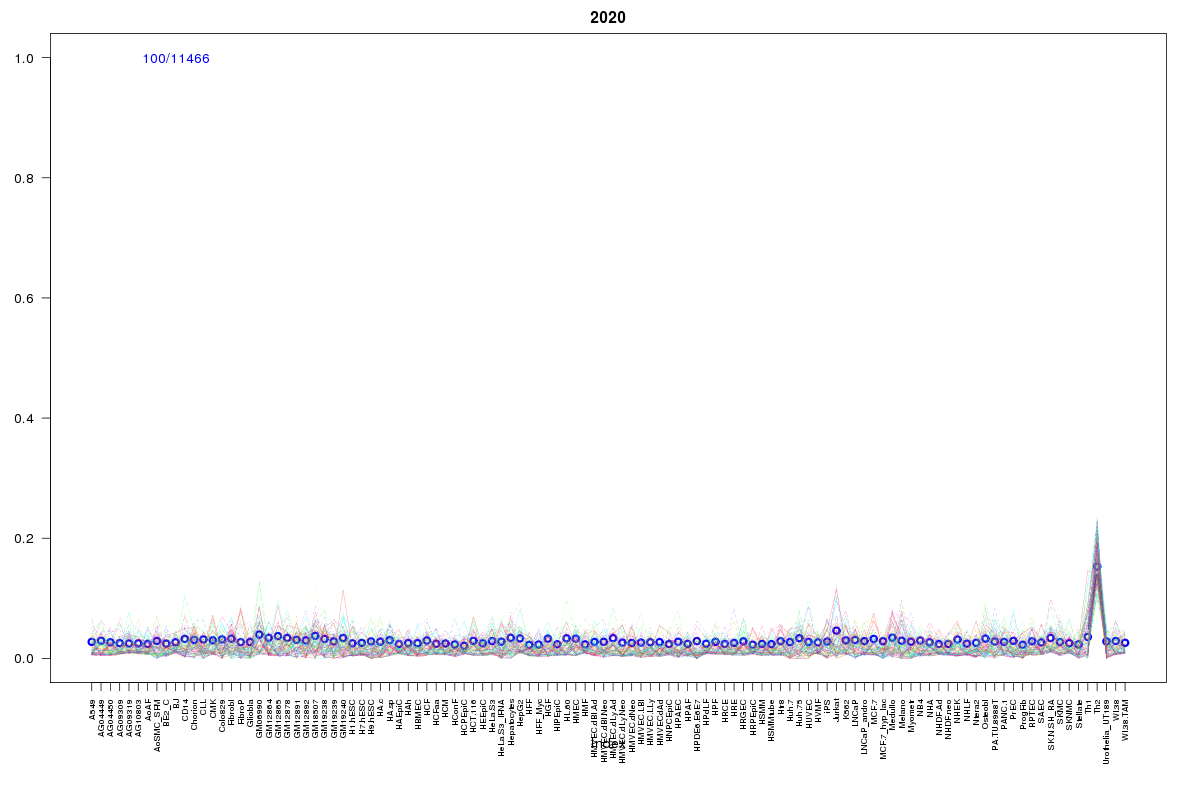 | 2020 | 2 |
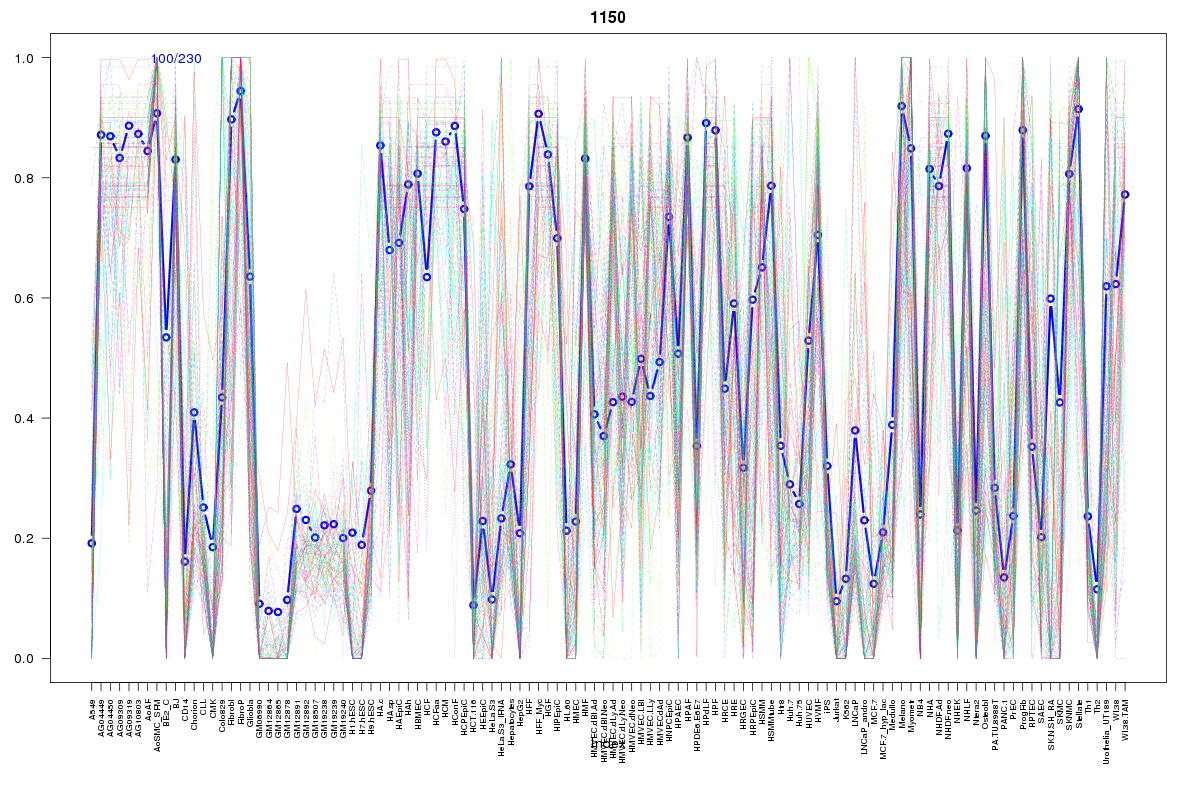 | 1150 | 1 |
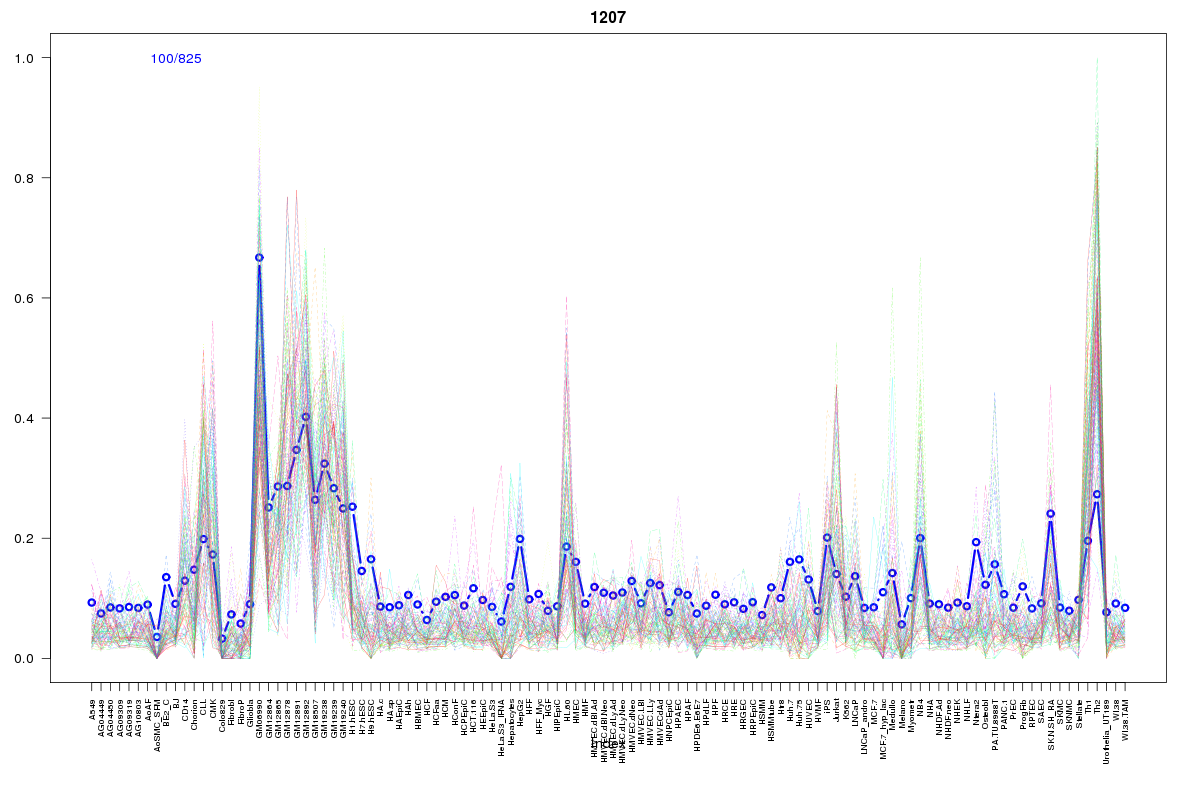 | 1207 | 1 |
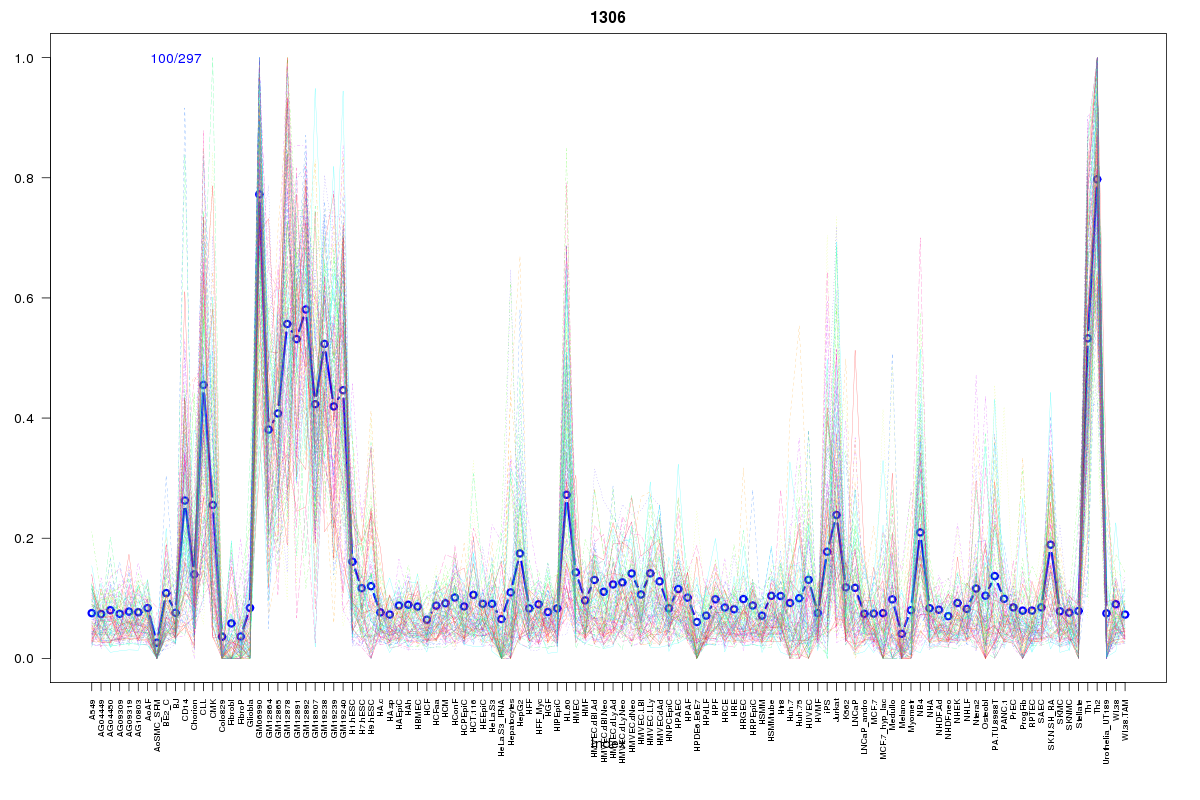 | 1306 | 1 |
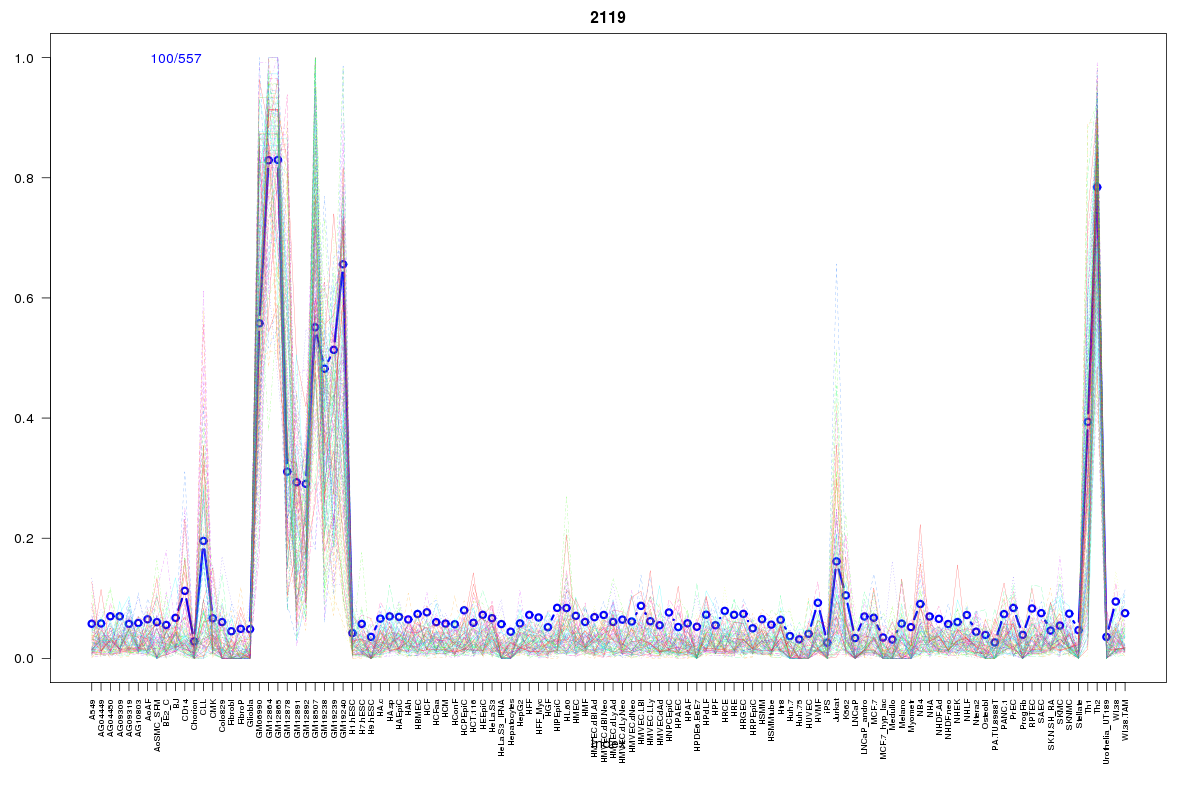 | 2119 | 1 |
 | 1157 | 1 |
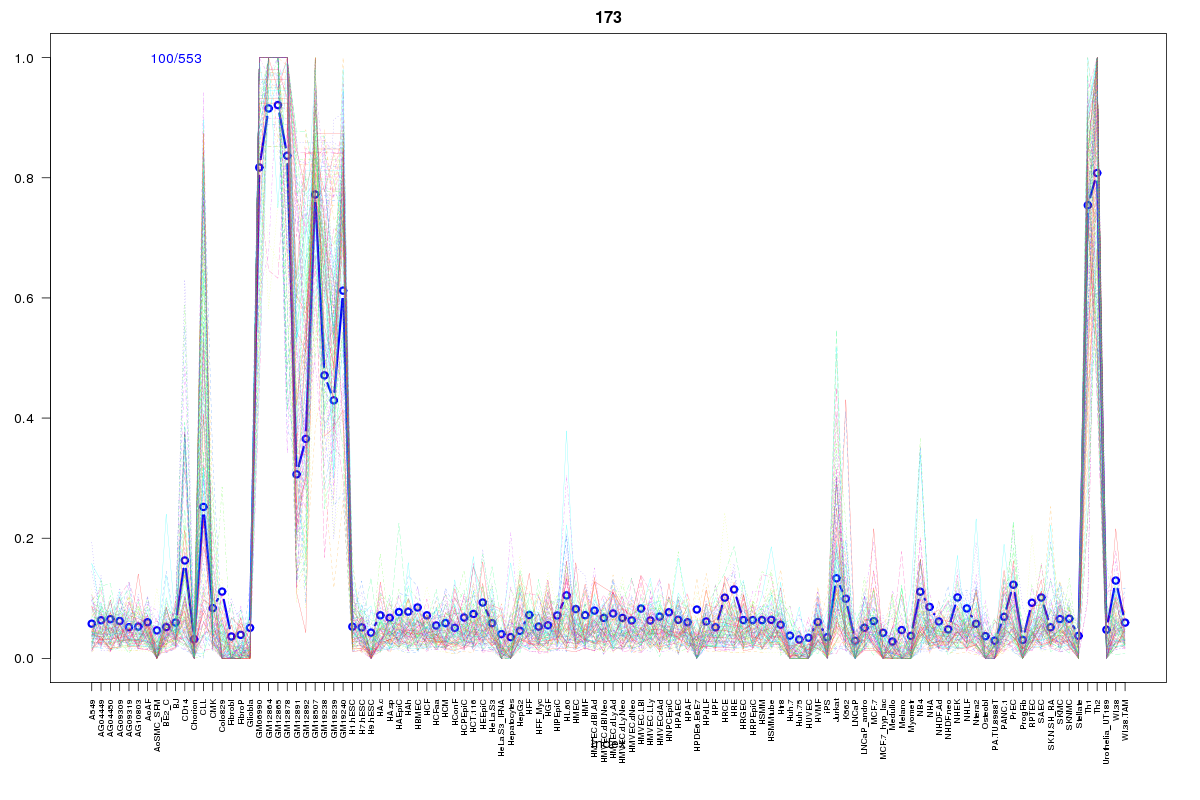 | 173 | 1 |
 | 2062 | 1 |
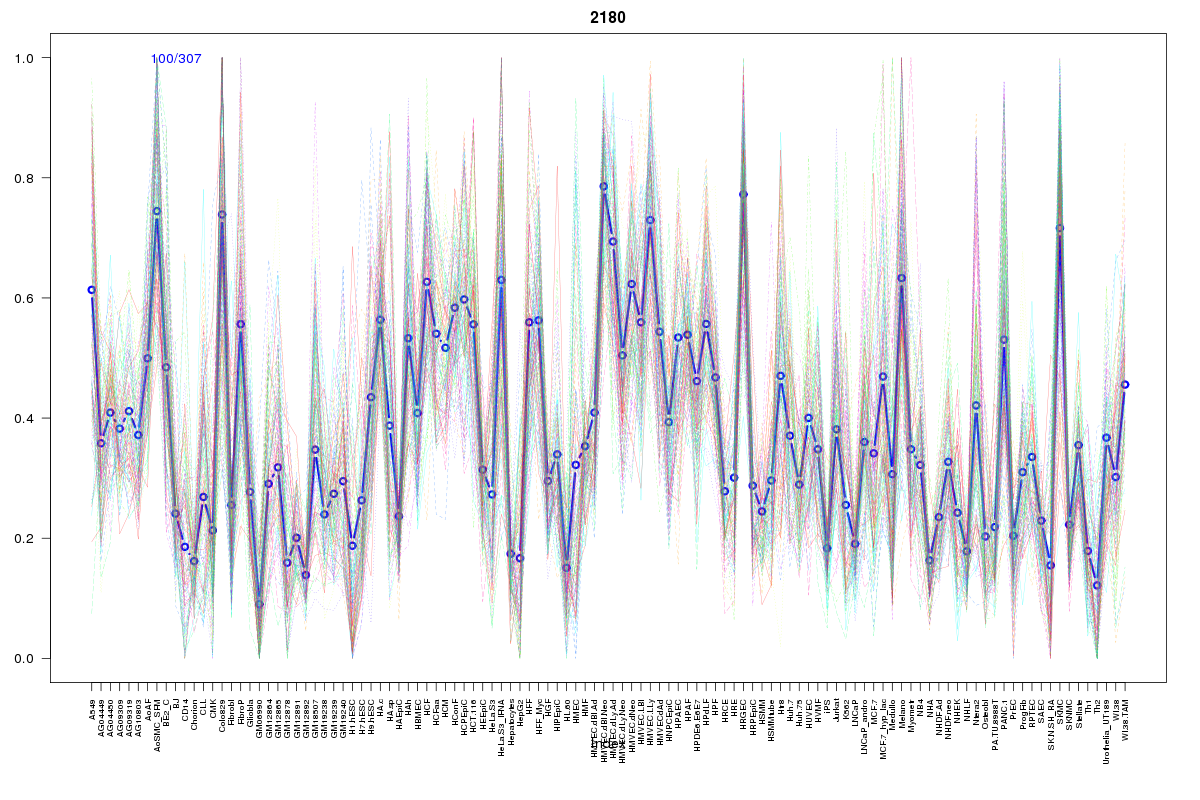 | 2180 | 1 |
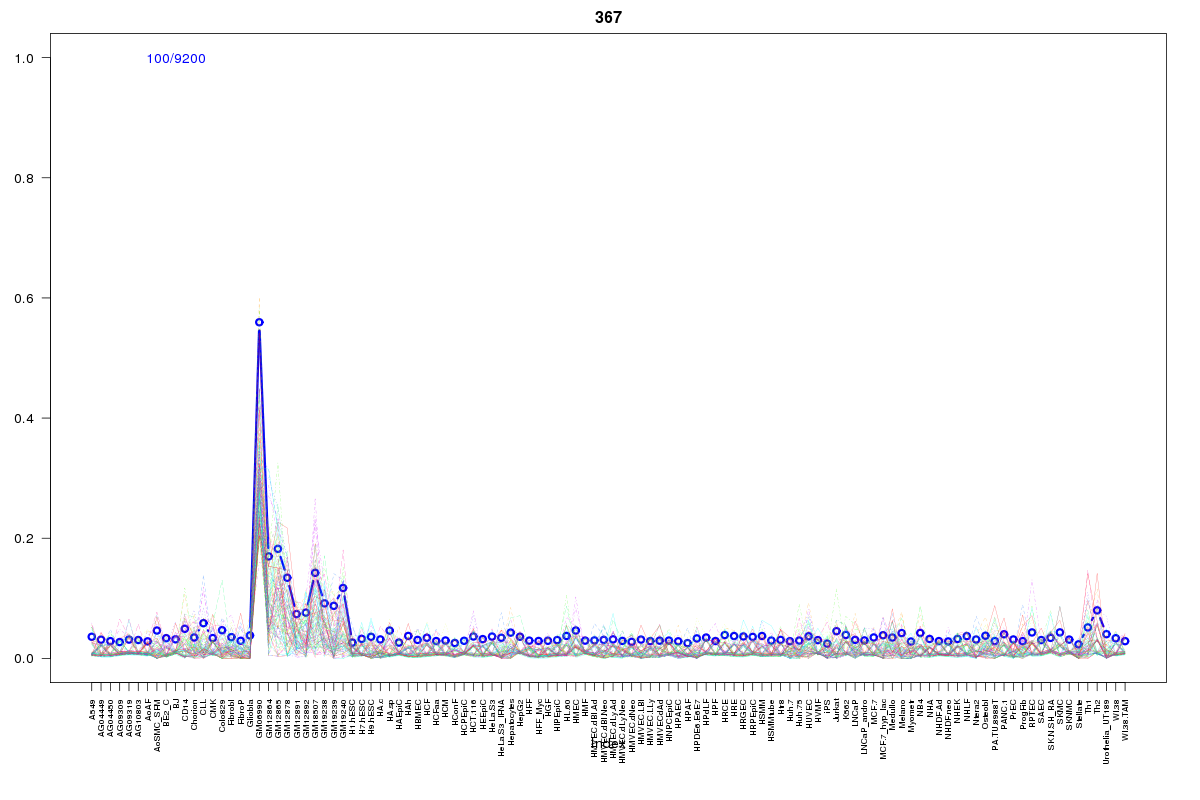 | 367 | 1 |
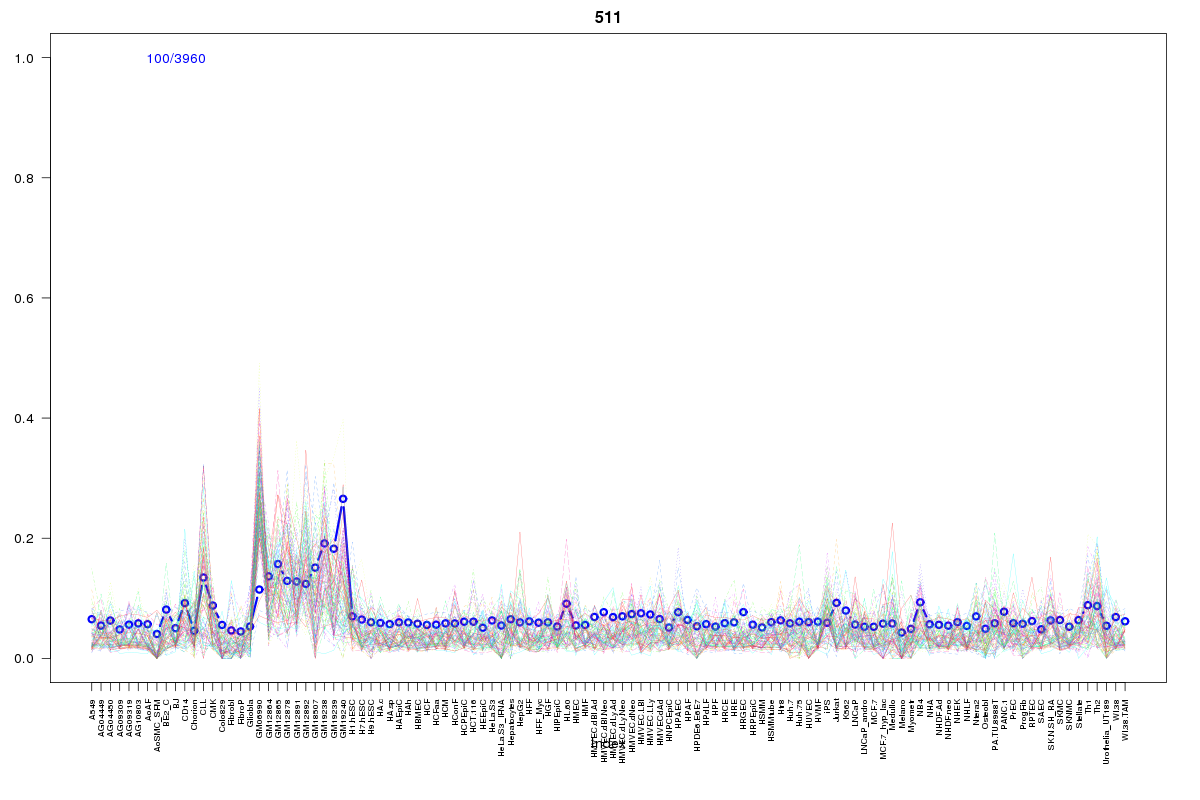 | 511 | 1 |
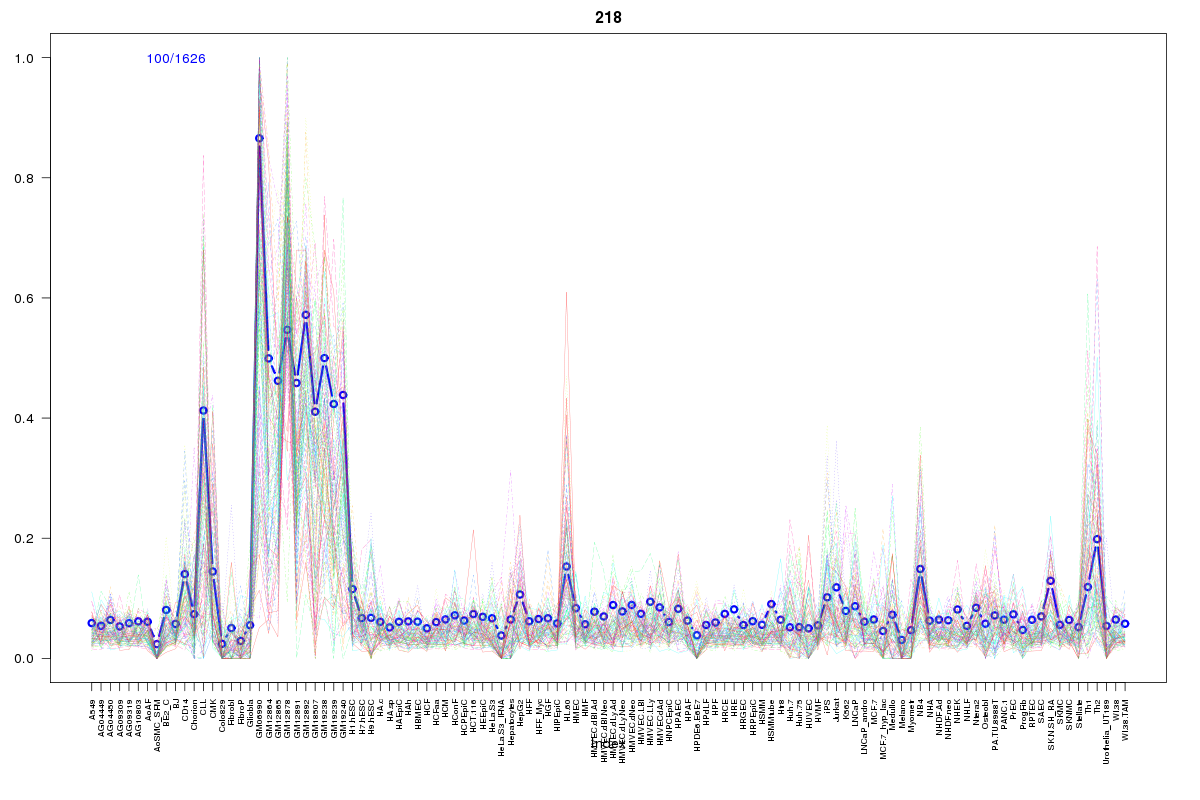 | 218 | 1 |
 | 2266 | 1 |
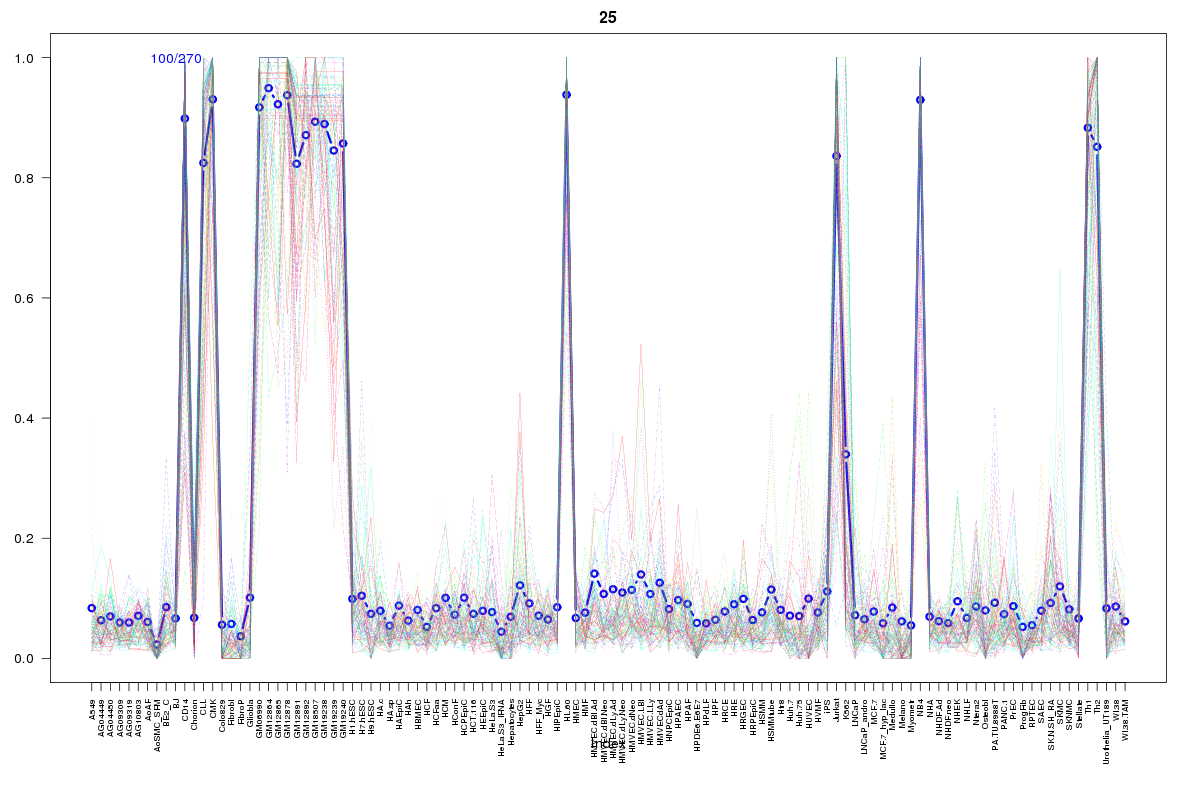 | 25 | 1 |
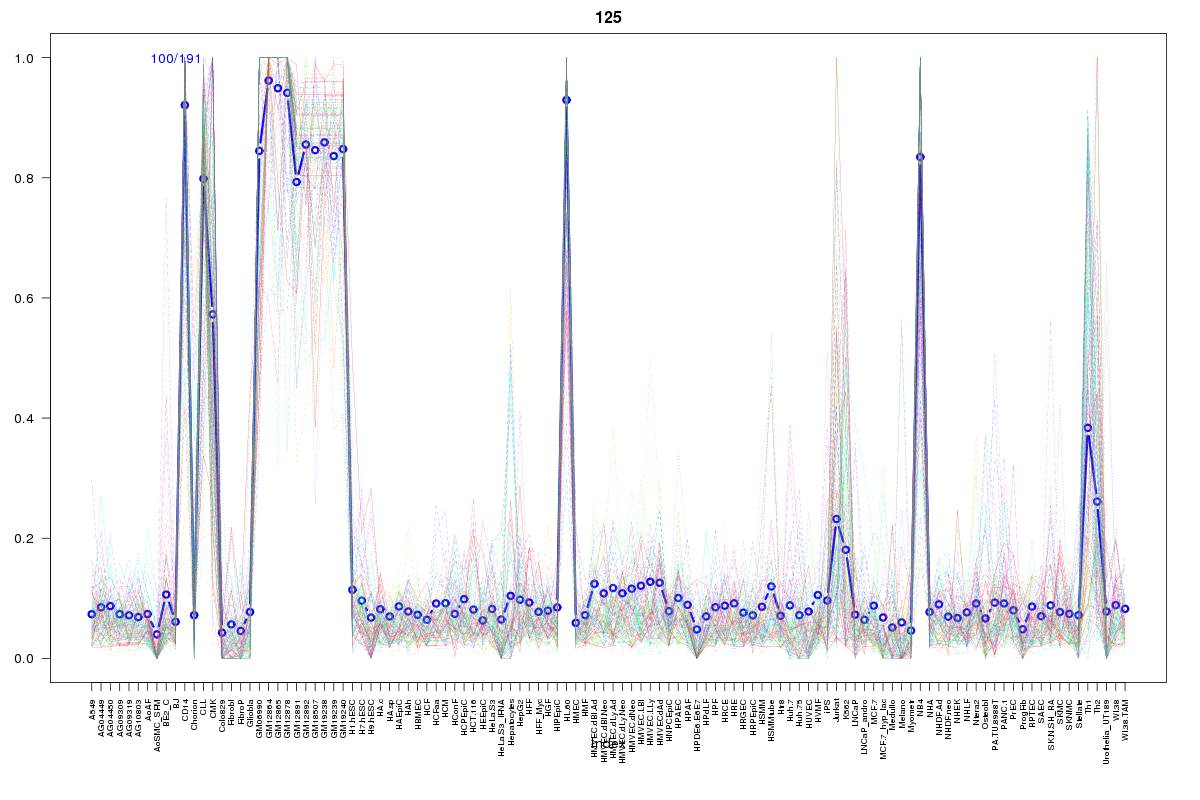 | 125 | 1 |
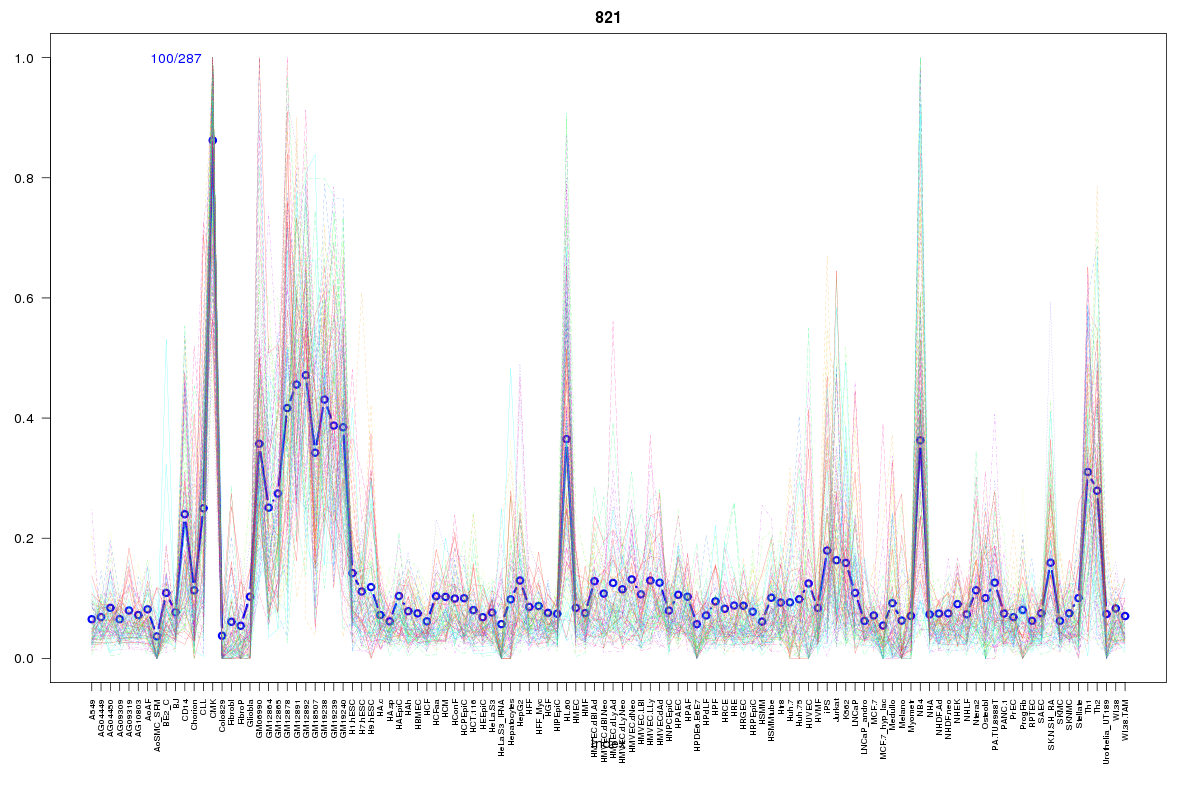 | 821 | 1 |
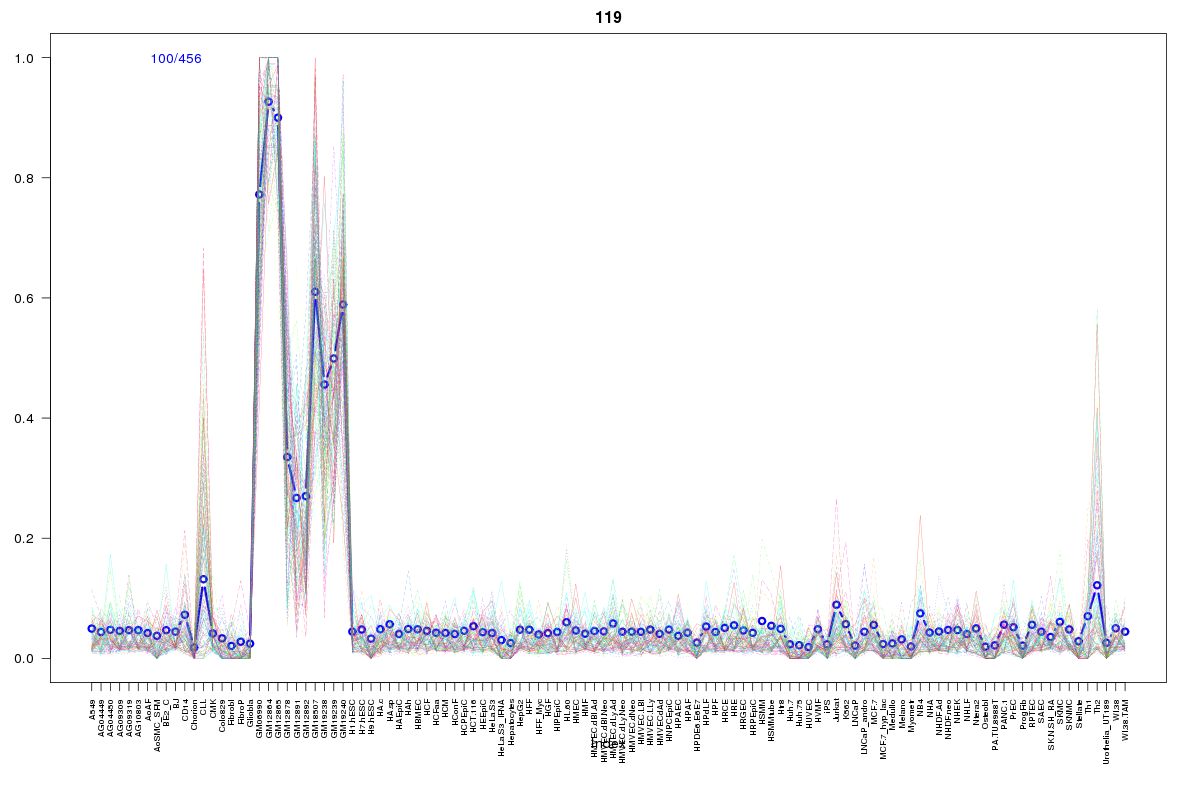 | 119 | 1 |
 | 518 | 1 |
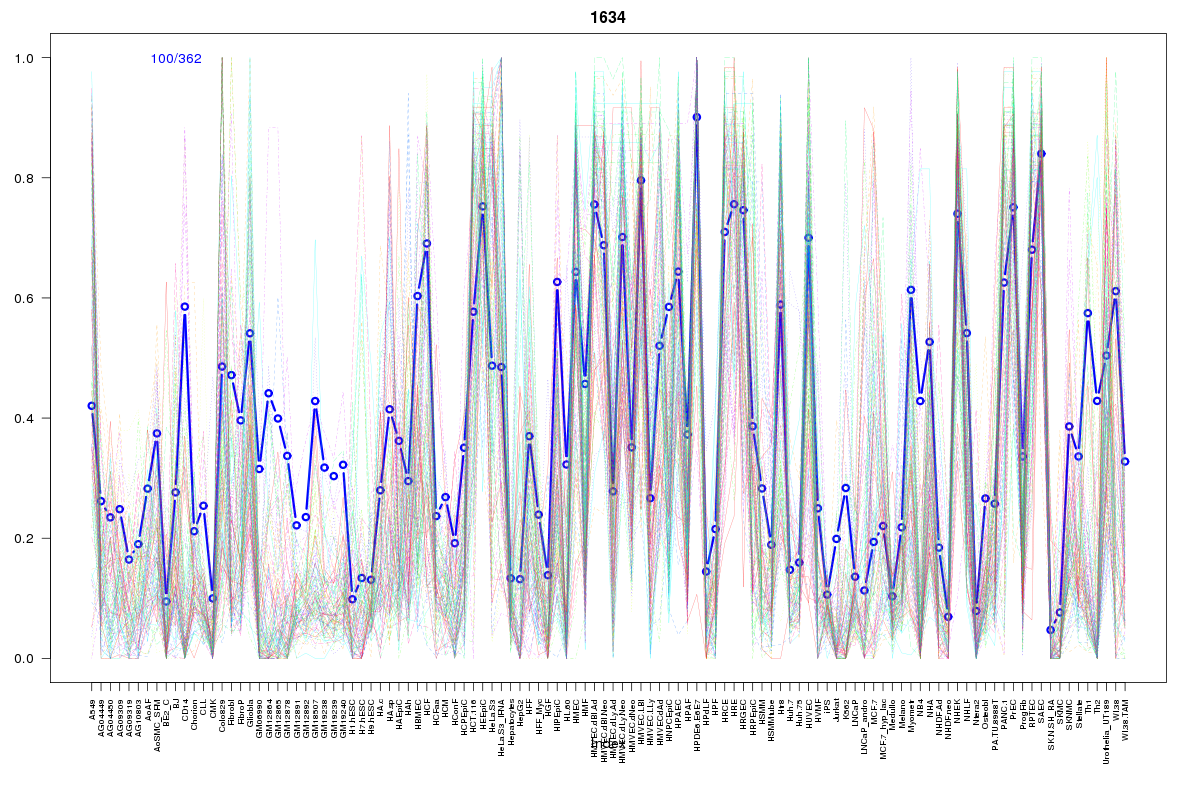 | 1634 | 1 |
 | 15 | 1 |
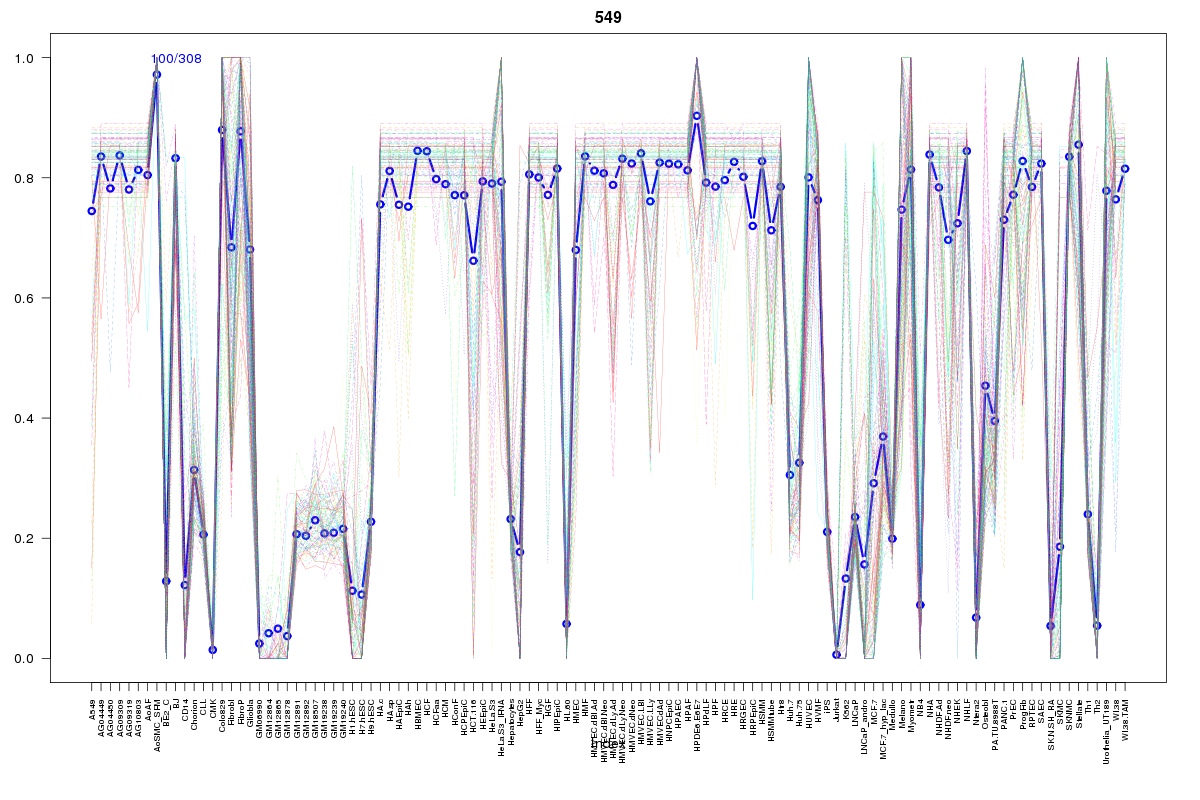 | 549 | 1 |
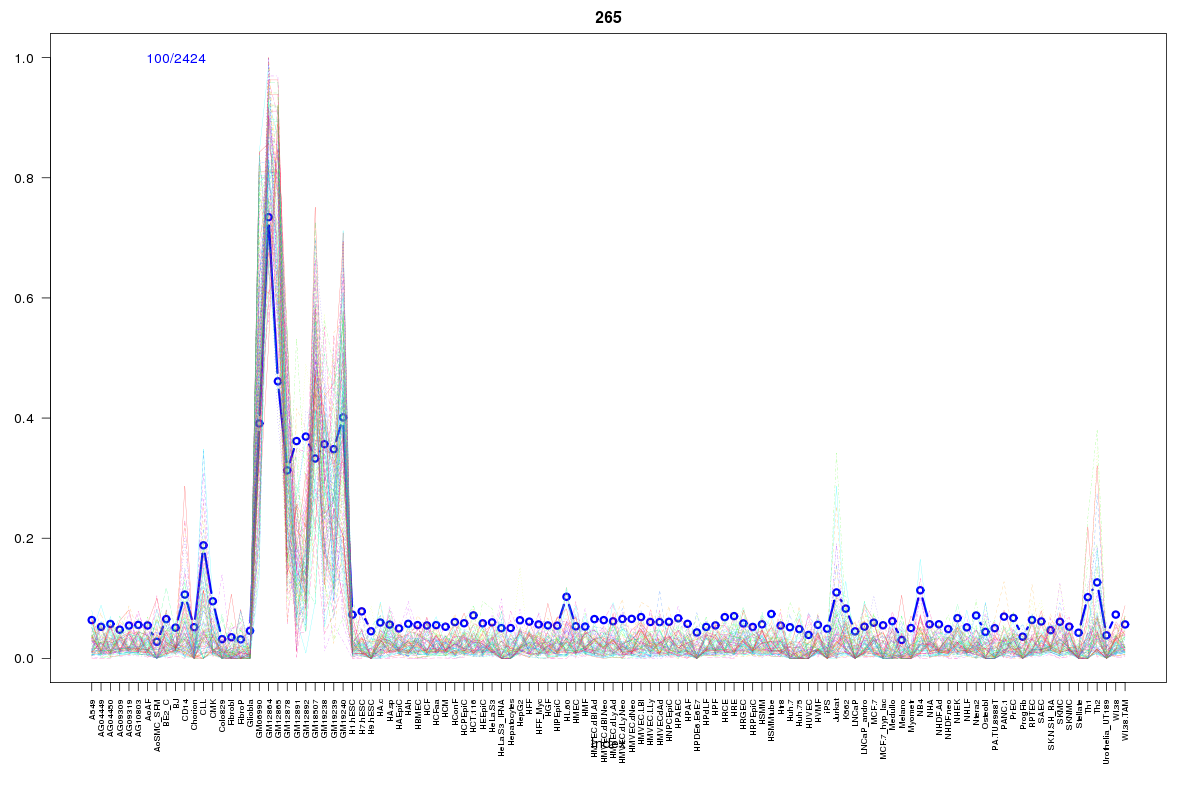 | 265 | 1 |
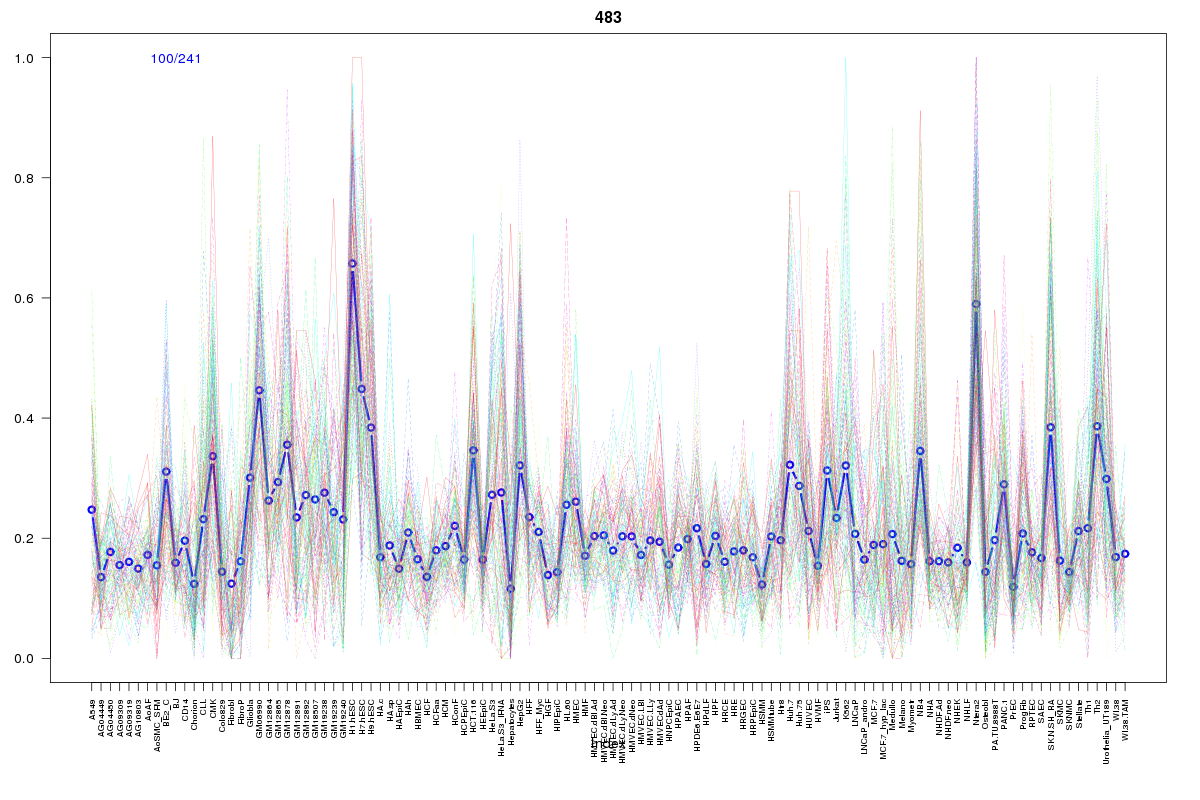 | 483 | 1 |
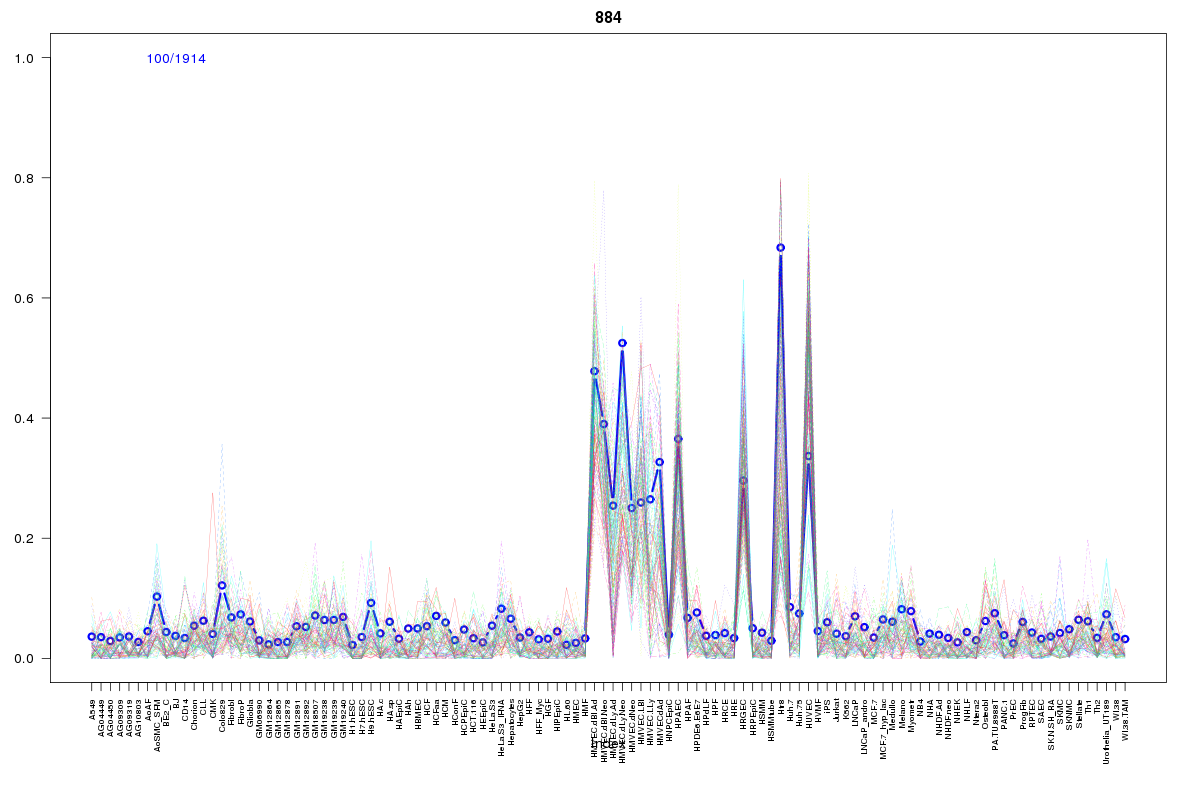 | 884 | 1 |
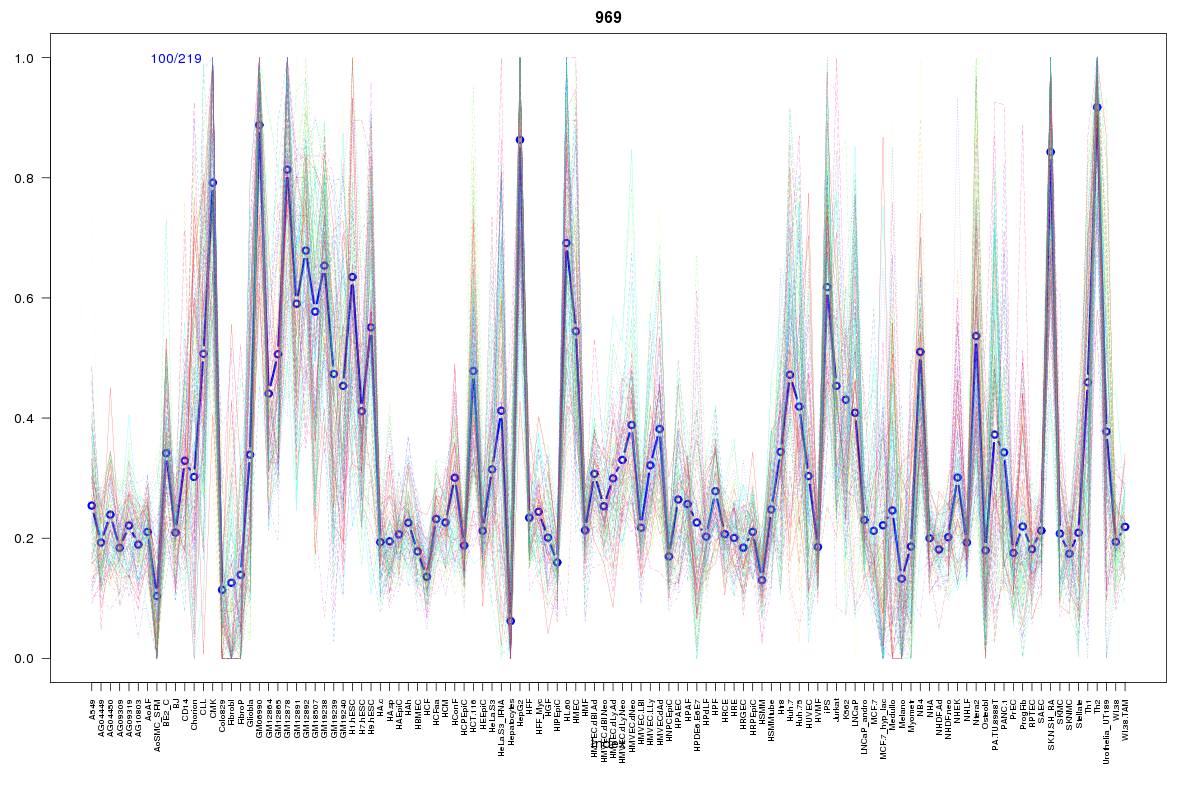 | 969 | 1 |
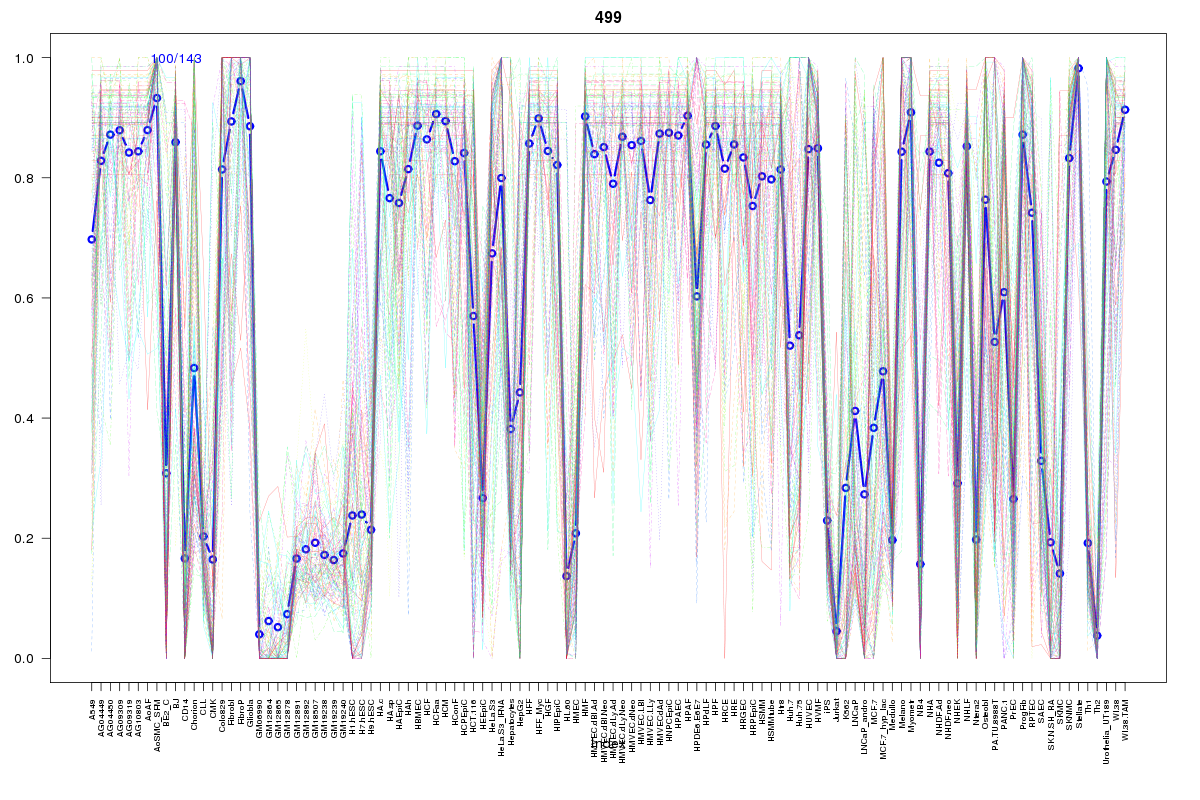 | 499 | 1 |
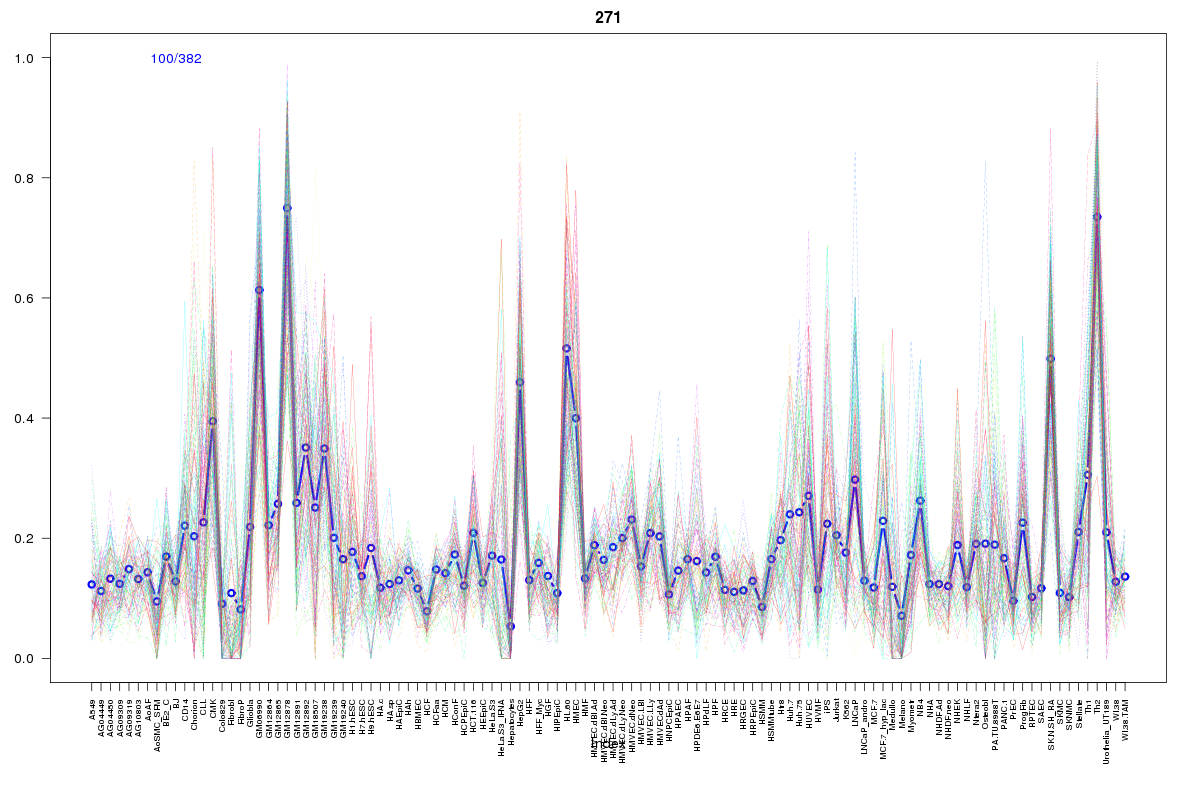 | 271 | 1 |
Resources
BED file downloads
Connects to 36 DHS sitesTop 10 Correlated DHS Sites
p-values indiciate significant higher or lower correlation| Location | Cluster | P-value |
|---|---|---|
| chr1:212852120-212852270 | 173 | 0 |
| chr1:212873600-212873750 | 1306 | 0 |
| chr1:212873385-212873535 | 1207 | 0 |
| chr1:212851840-212851990 | 2119 | 0.001 |
| chr1:212874000-212874150 | 2062 | 0.001 |
| chr1:212856740-212856890 | 25 | 0.001 |
| chr1:212856520-212856670 | 218 | 0.001 |
| chr1:212856900-212857050 | 821 | 0.002 |
| chr1:212943180-212943330 | 2171 | 0.002 |
| chr1:212926320-212926470 | 2168 | 0.002 |
| chr1:212873840-212873990 | 1157 | 0.004 |
External Databases
UCSCEnsembl (ENSG00000123685)