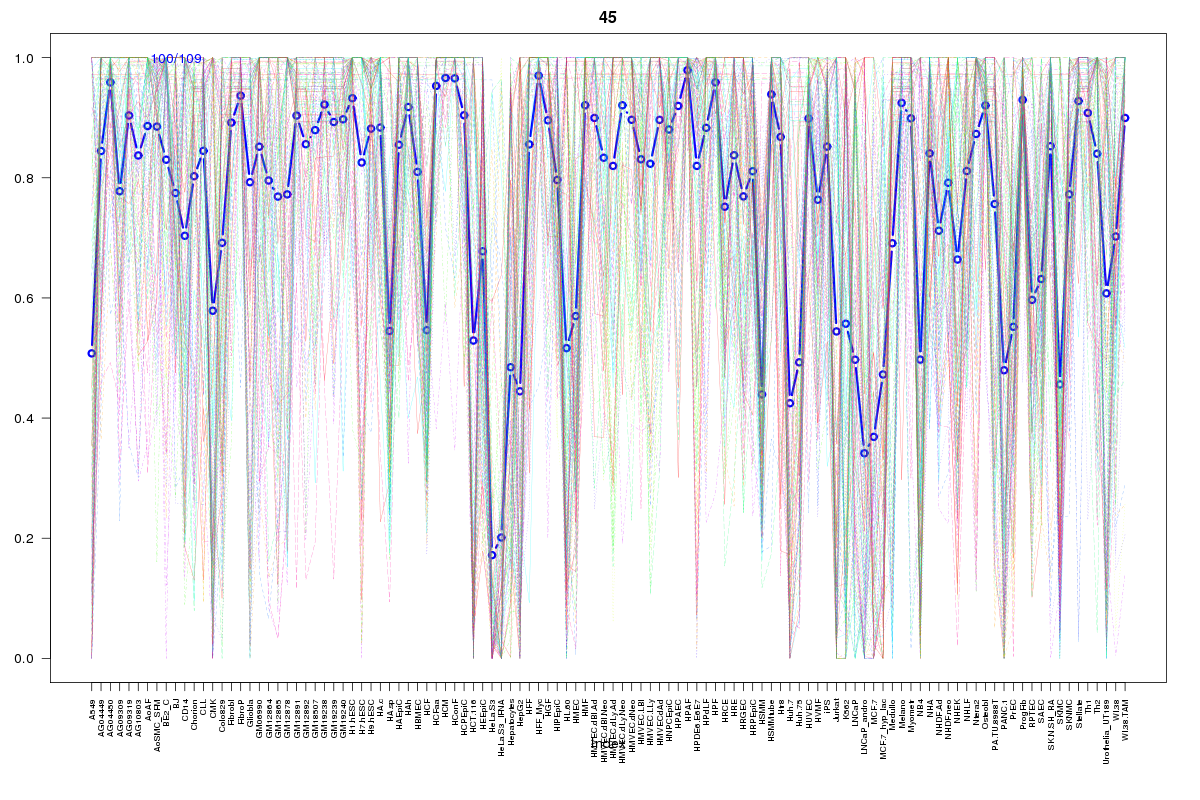
Gene: NPPB
chr1: 11917520-11918988Expression Profile
(log scale)
Graphical Connections
Distribution of linked clusters:
You may find it interesting if many of the connected DHS sites belong to the same cluster.| Cluster Profile | Cluster ID | Number of DHS sites in this cluster |
|---|---|---|
 | 15 | 3 |
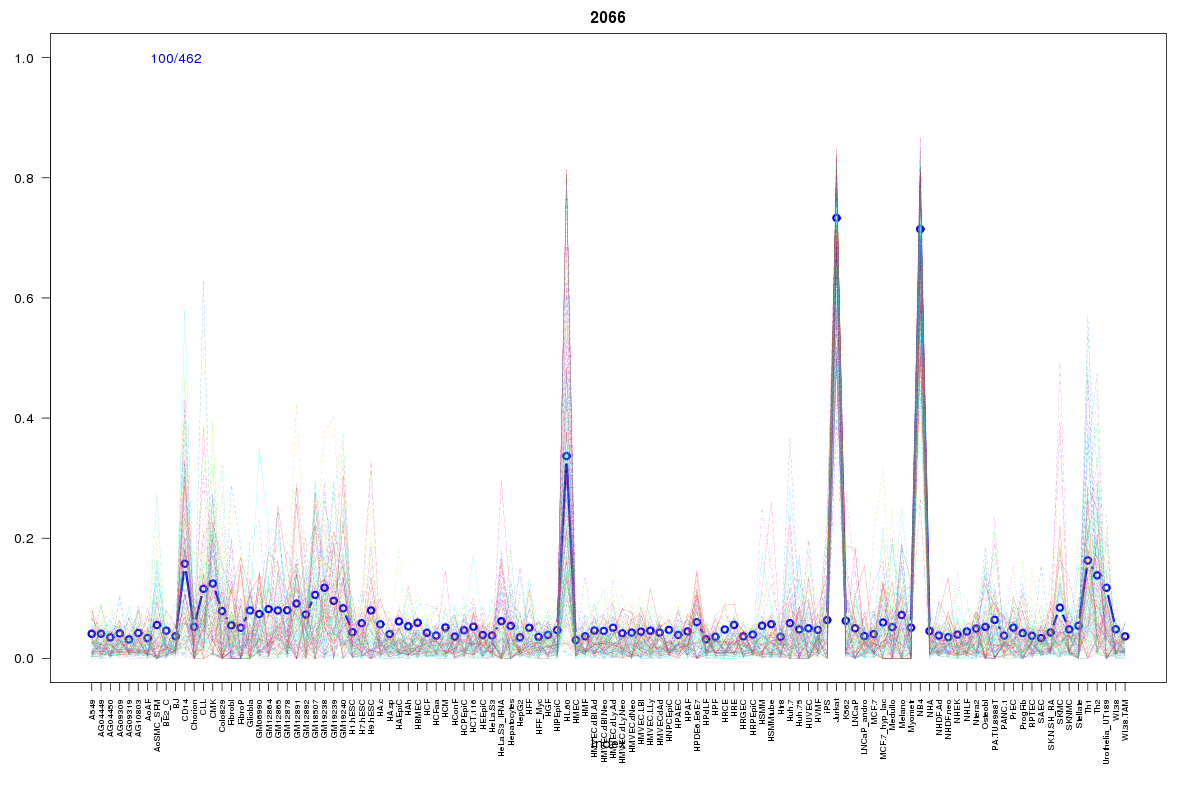 | 2066 | 2 |
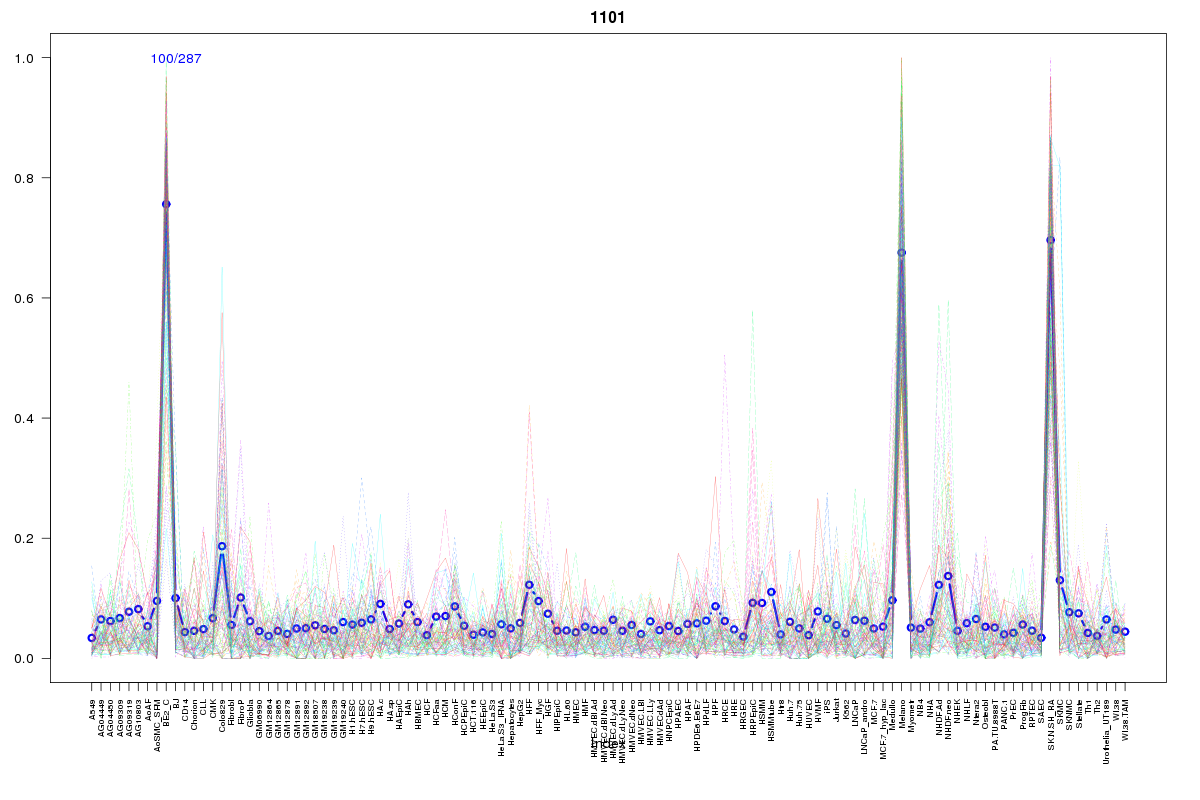 | 1101 | 2 |
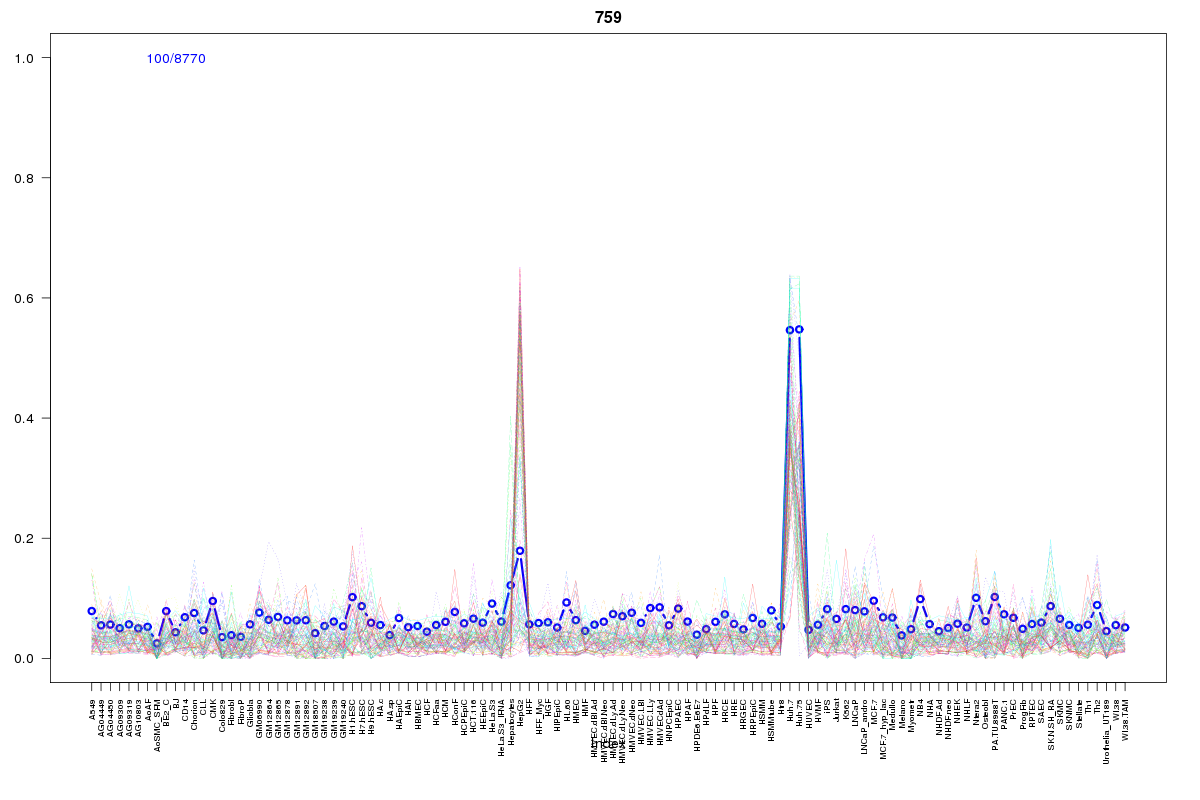 | 759 | 2 |
 | 2211 | 1 |
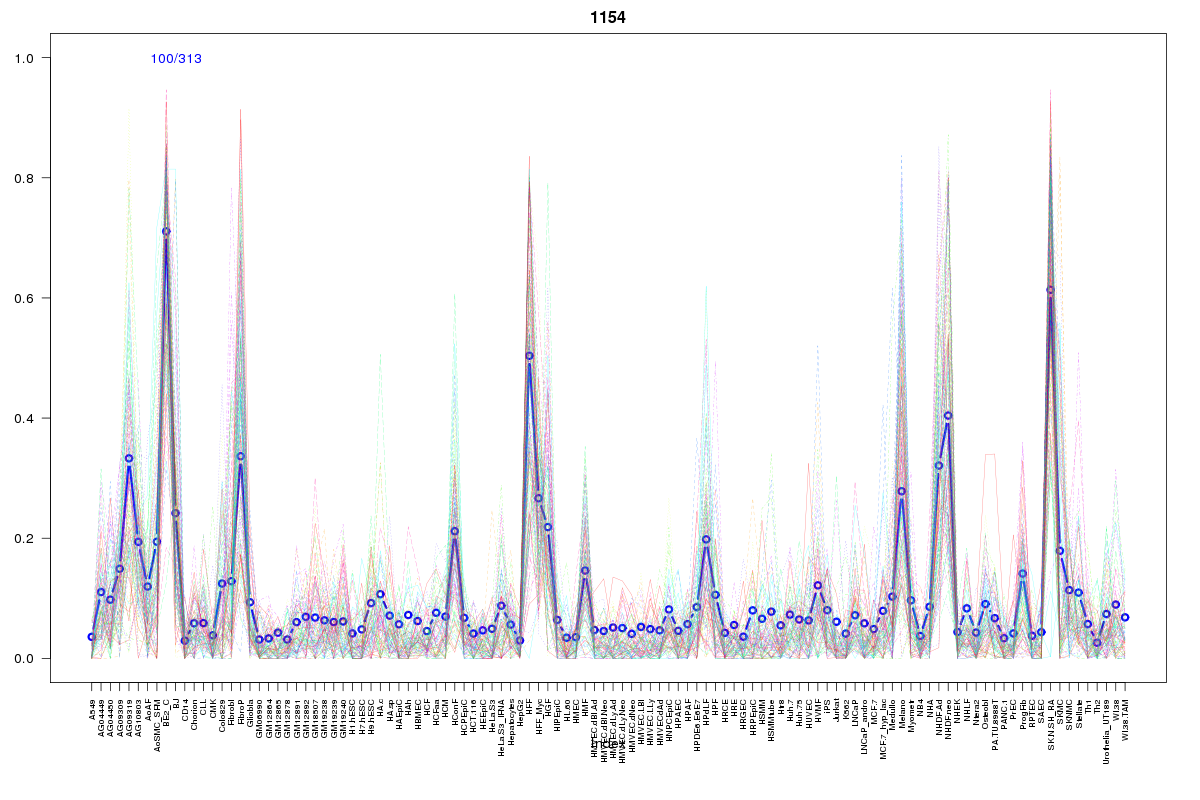 | 1154 | 1 |
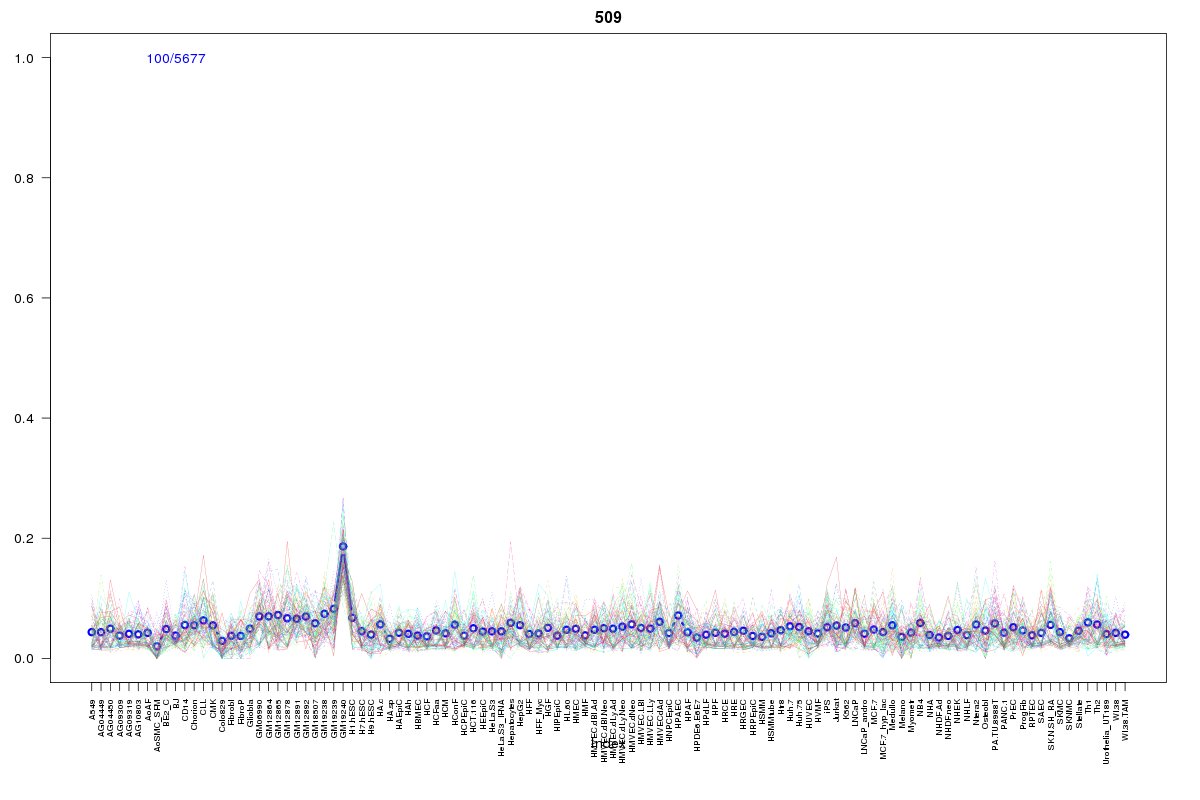 | 509 | 1 |
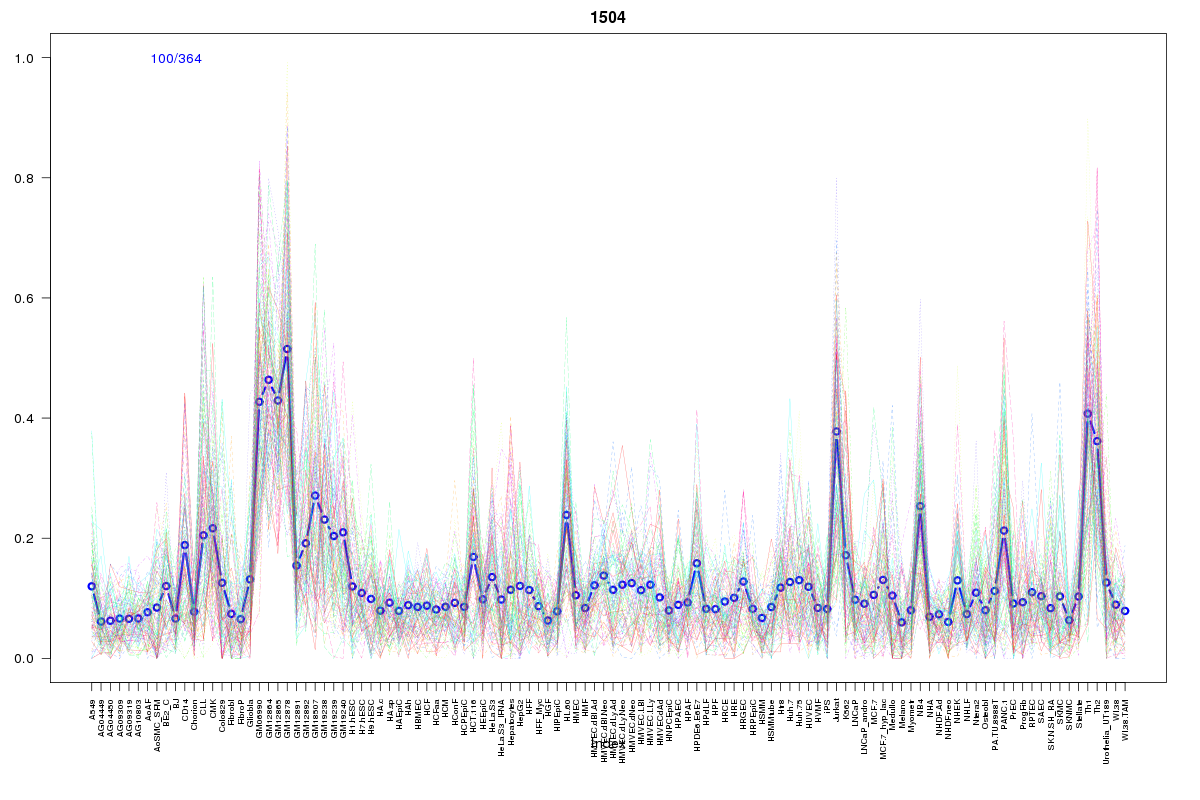 | 1504 | 1 |
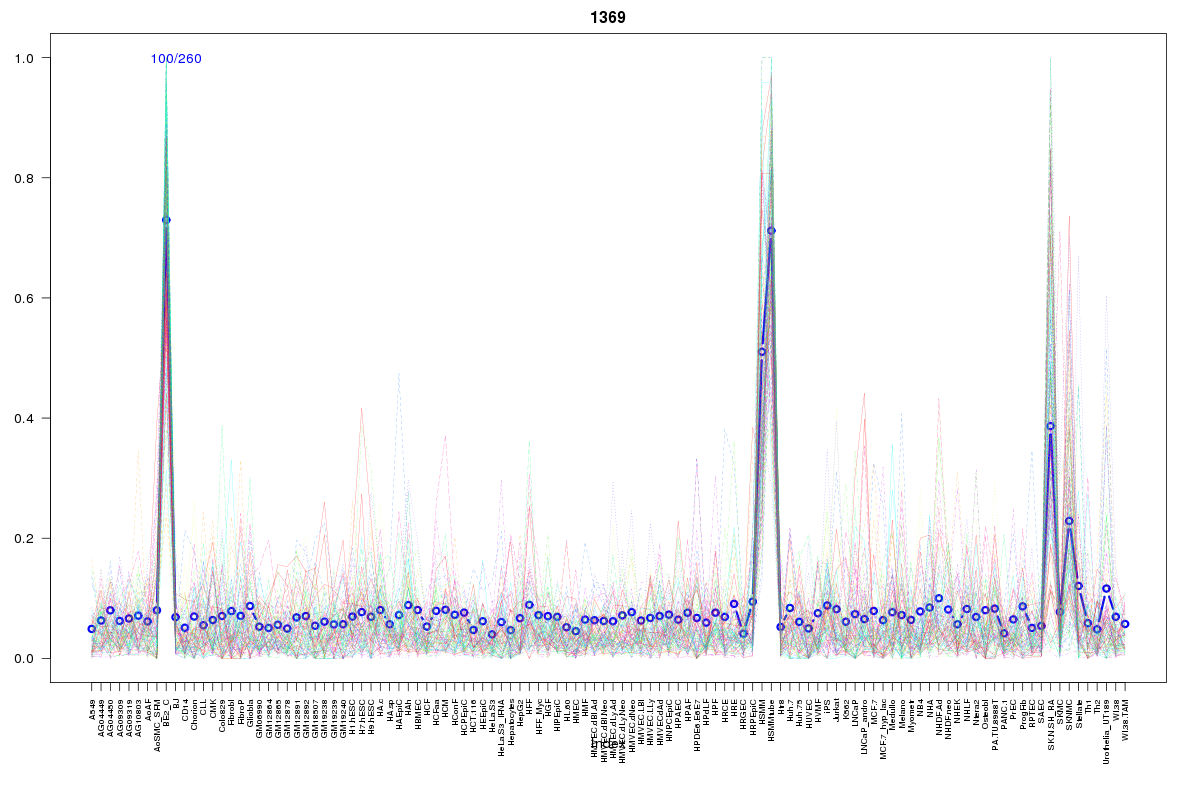 | 1369 | 1 |
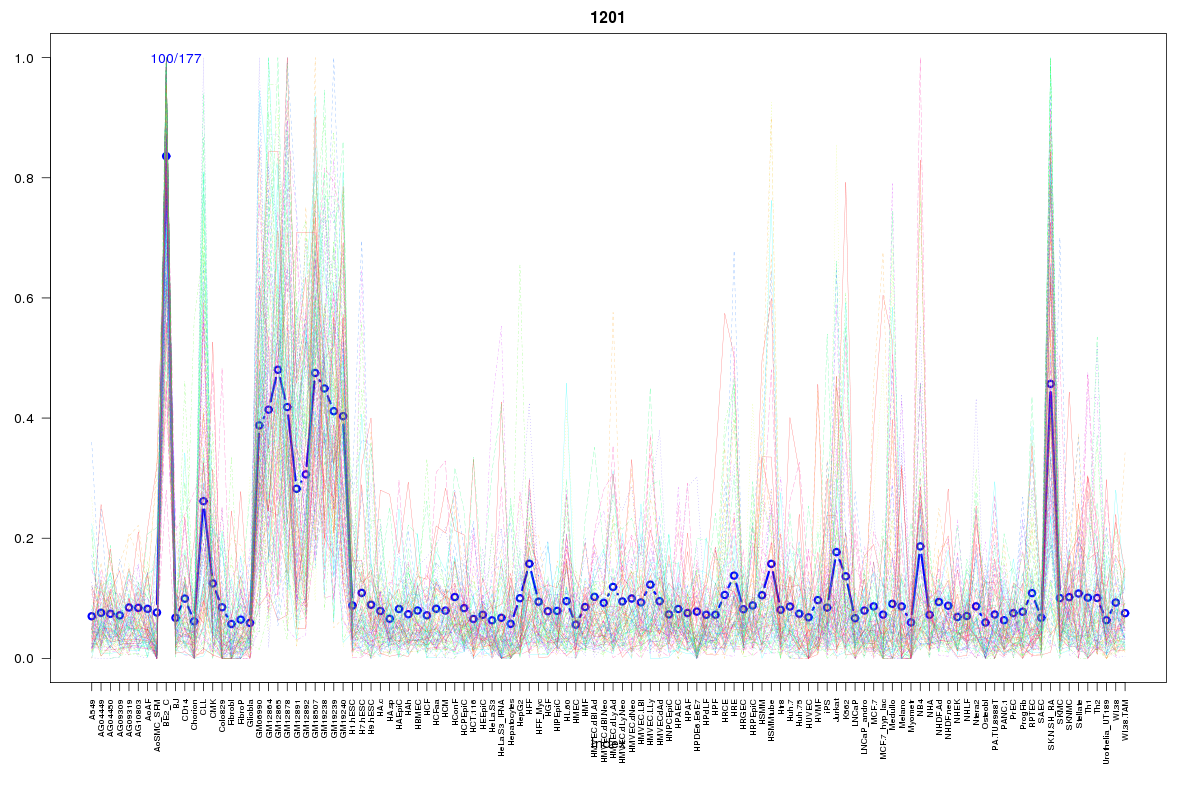 | 1201 | 1 |
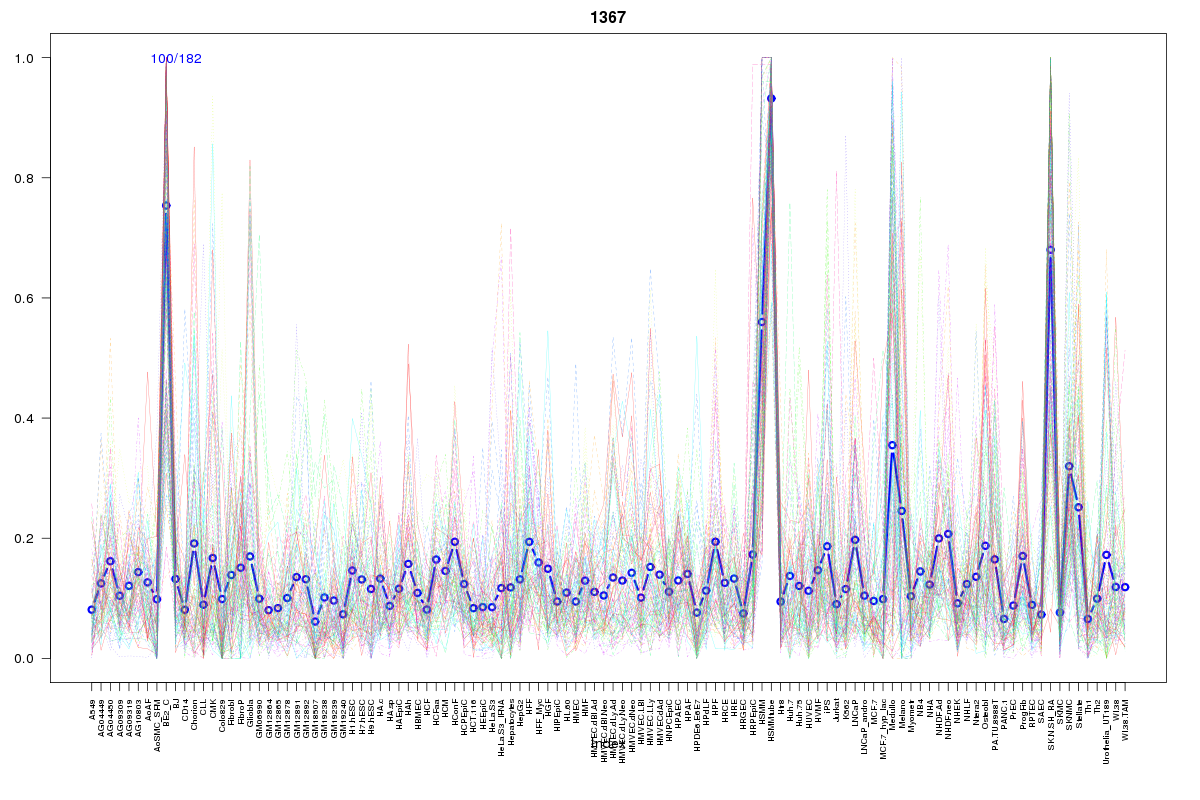 | 1367 | 1 |
 | 1008 | 1 |
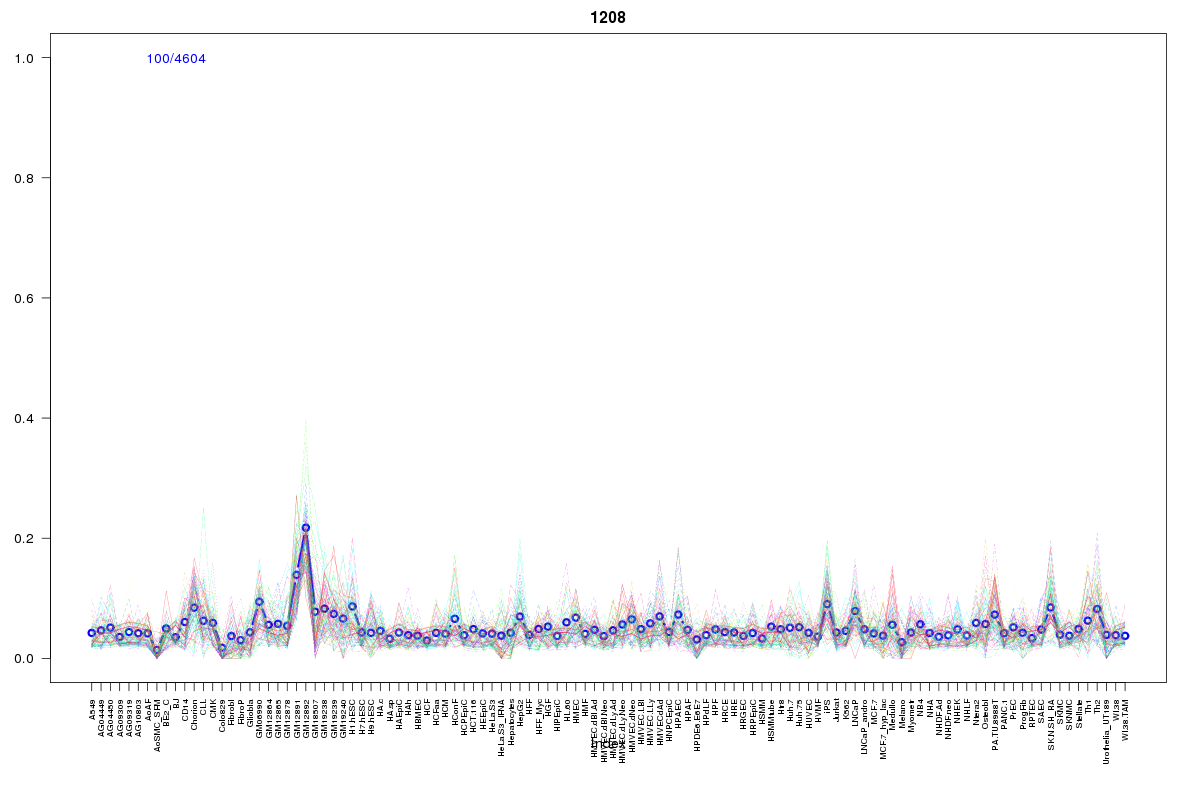 | 1208 | 1 |
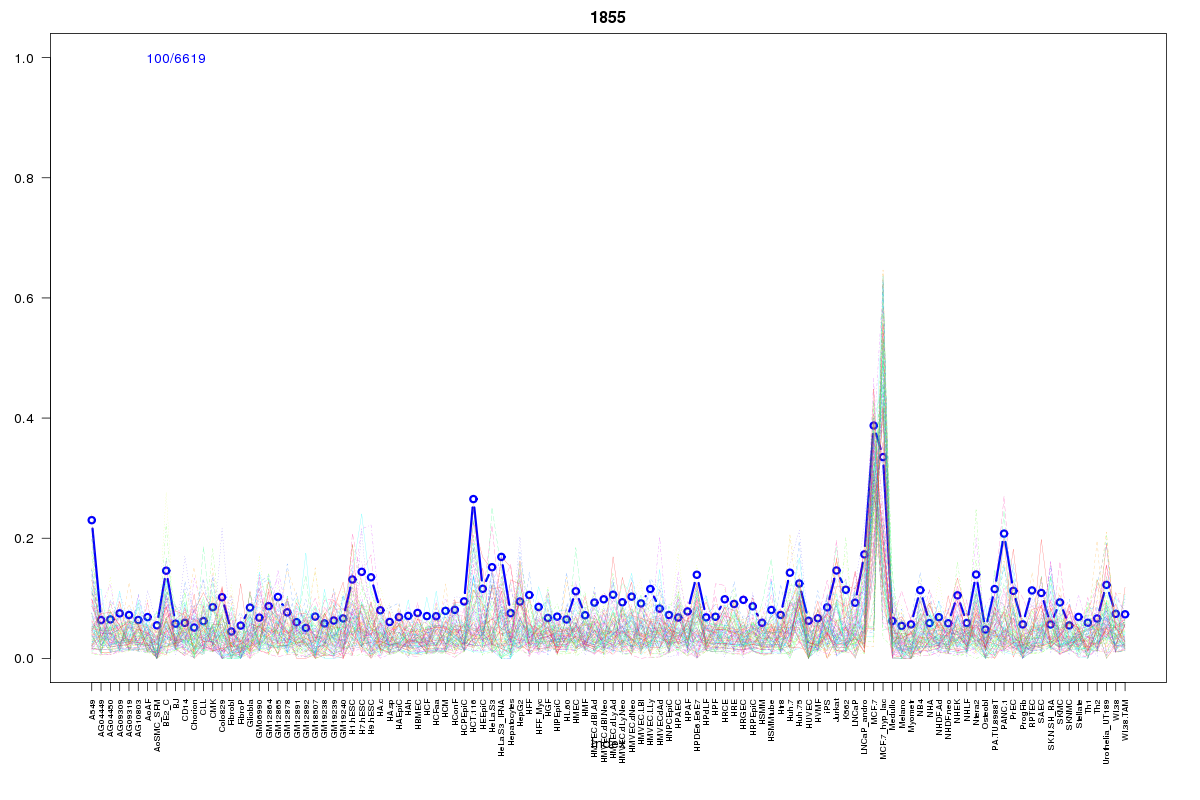 | 1855 | 1 |
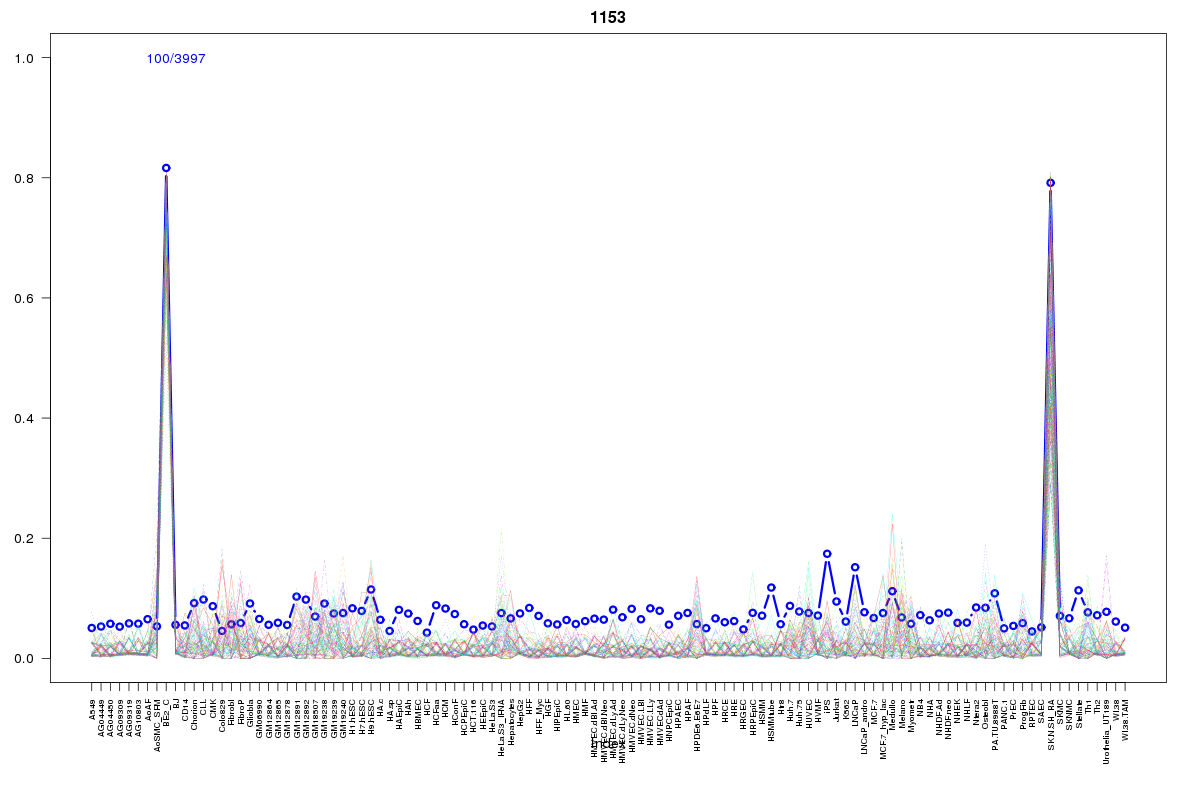 | 1153 | 1 |
 | 2122 | 1 |
 | 469 | 1 |
 | 45 | 1 |
Resources
BED file downloads
Connects to 23 DHS sitesTop 10 Correlated DHS Sites
p-values indiciate significant higher or lower correlation| Location | Cluster | P-value |
|---|---|---|
| chr1:11969400-11969550 | 1504 | 0.008 |
| chr1:11972205-11972355 | 15 | 0.012 |
| chr1:11975300-11975450 | 15 | 0.016 |
| chr1:11952265-11952415 | 759 | 0.018 |
| chr1:11874660-11874810 | 2211 | 0.019 |
| chr1:11952025-11952175 | 759 | 0.02 |
| chr1:11983405-11983555 | 15 | 0.021 |
| chr1:11854405-11854555 | 1855 | 0.024 |
| chr1:12012140-12012290 | 1153 | 0.021 |
| chr1:11911265-11911415 | 2066 | 0.019 |
| chr1:11999060-11999210 | 1369 | 0.013 |
External Databases
UCSCEnsembl (ENSG00000120937)