Gene: PTBP3
chr9: 114980714-115095123Expression Profile
(log scale)
Graphical Connections
Distribution of linked clusters:
You may find it interesting if many of the connected DHS sites belong to the same cluster.| Cluster Profile | Cluster ID | Number of DHS sites in this cluster |
|---|---|---|
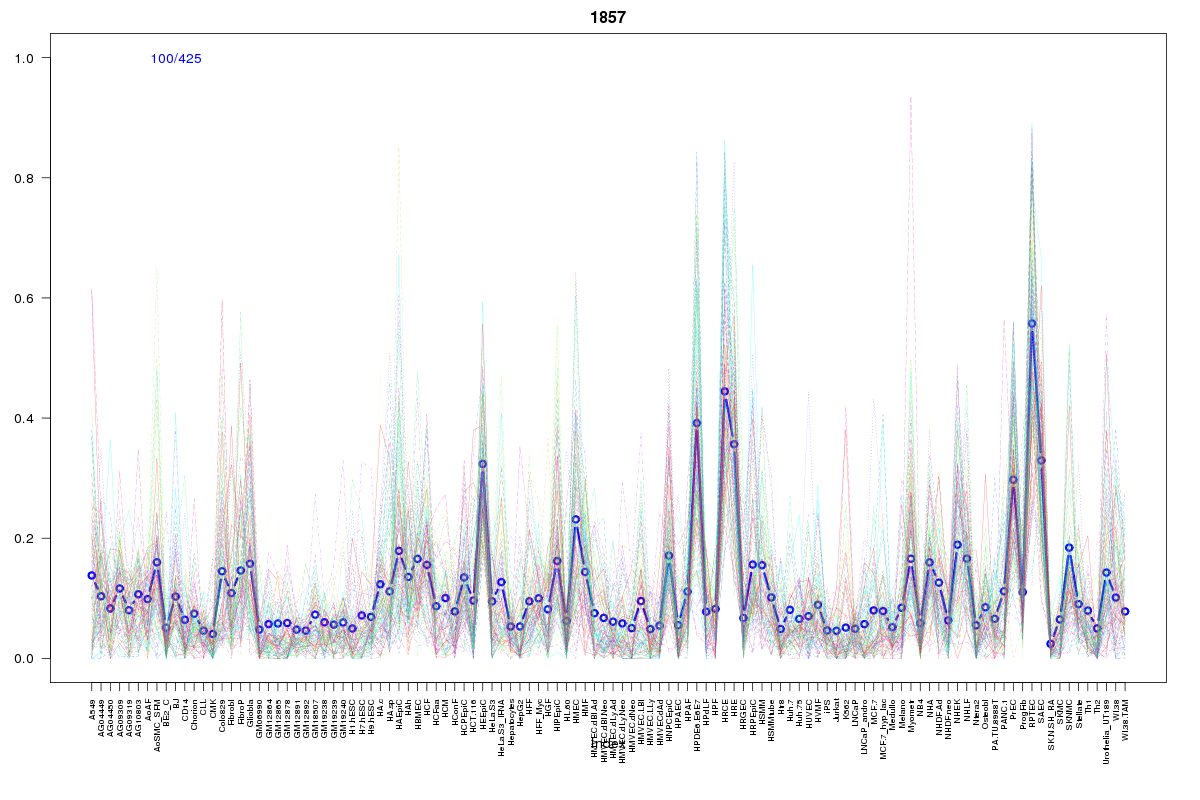 | 1857 | 2 |
 | 2017 | 2 |
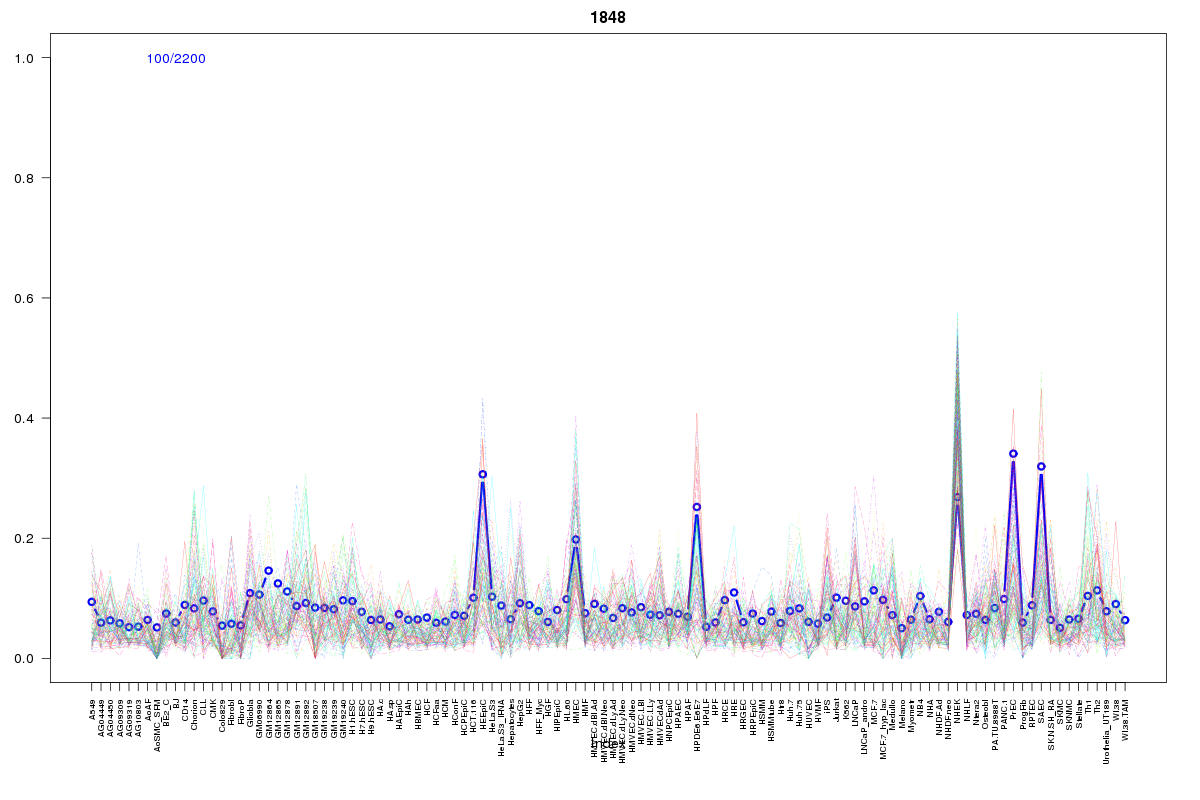 | 1848 | 2 |
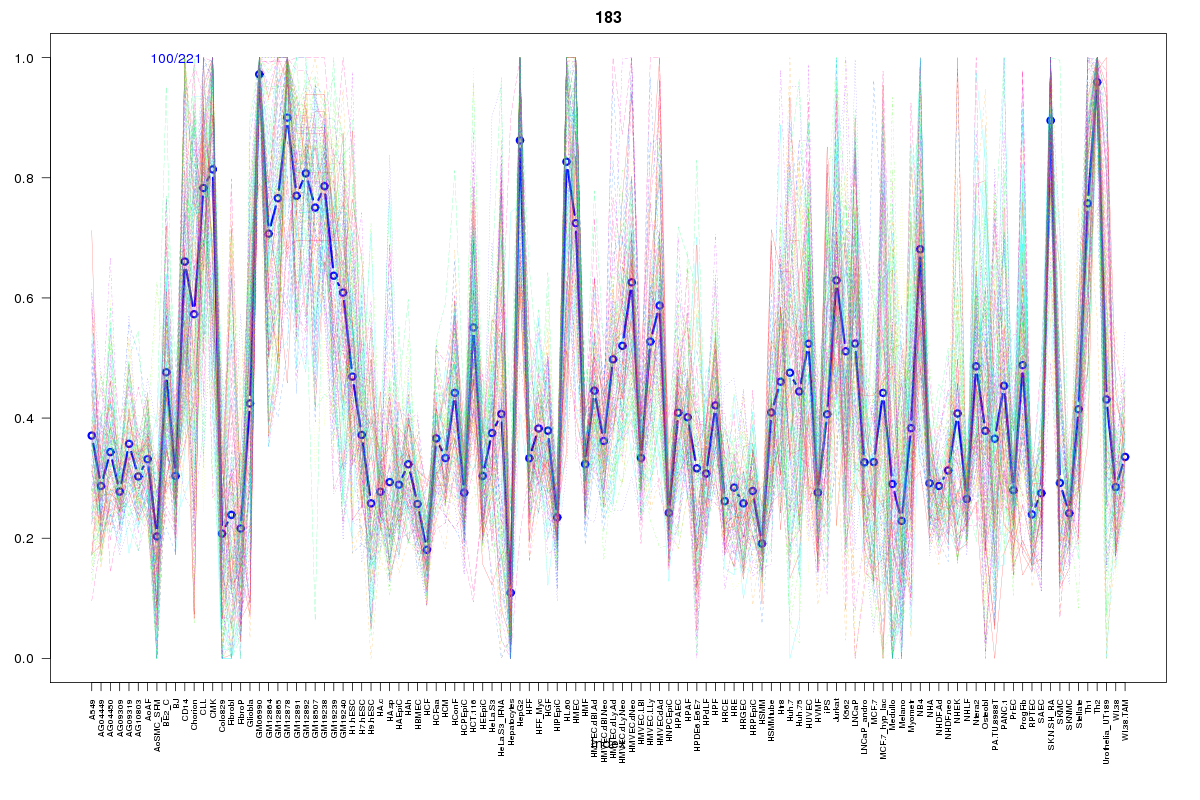 | 183 | 2 |
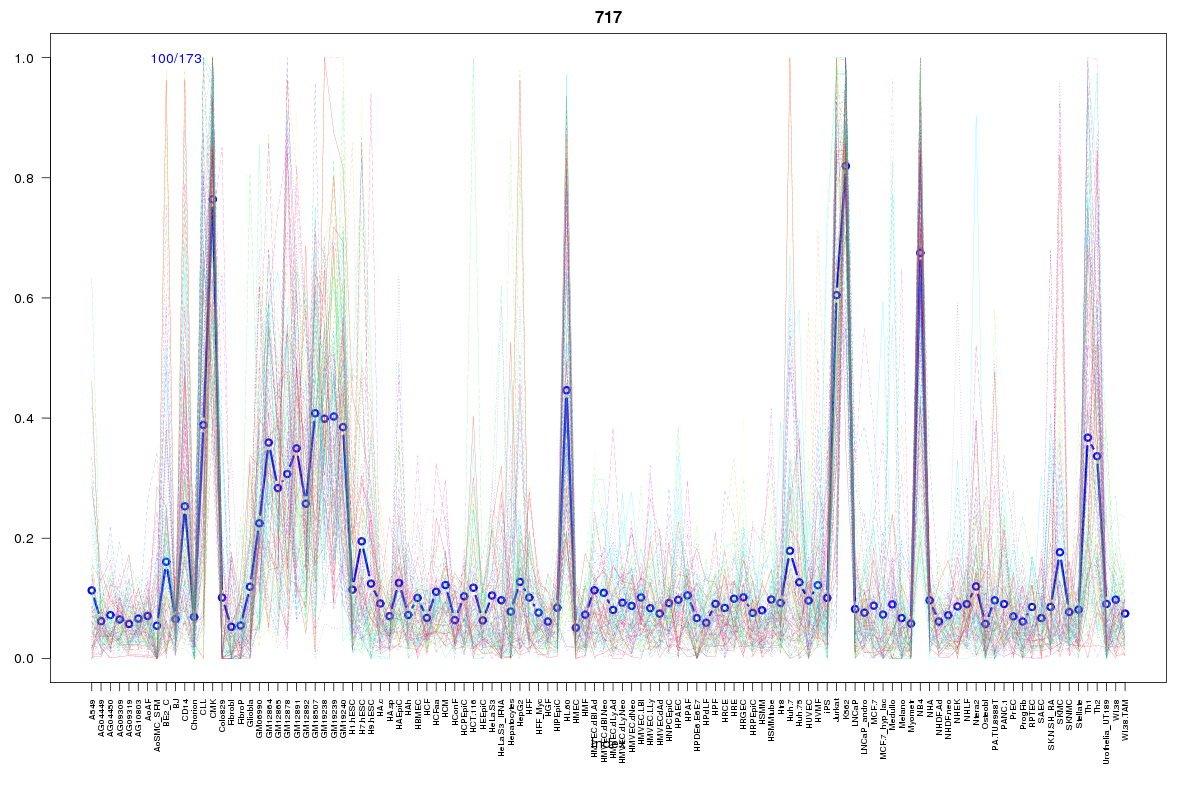 | 717 | 2 |
 | 1605 | 2 |
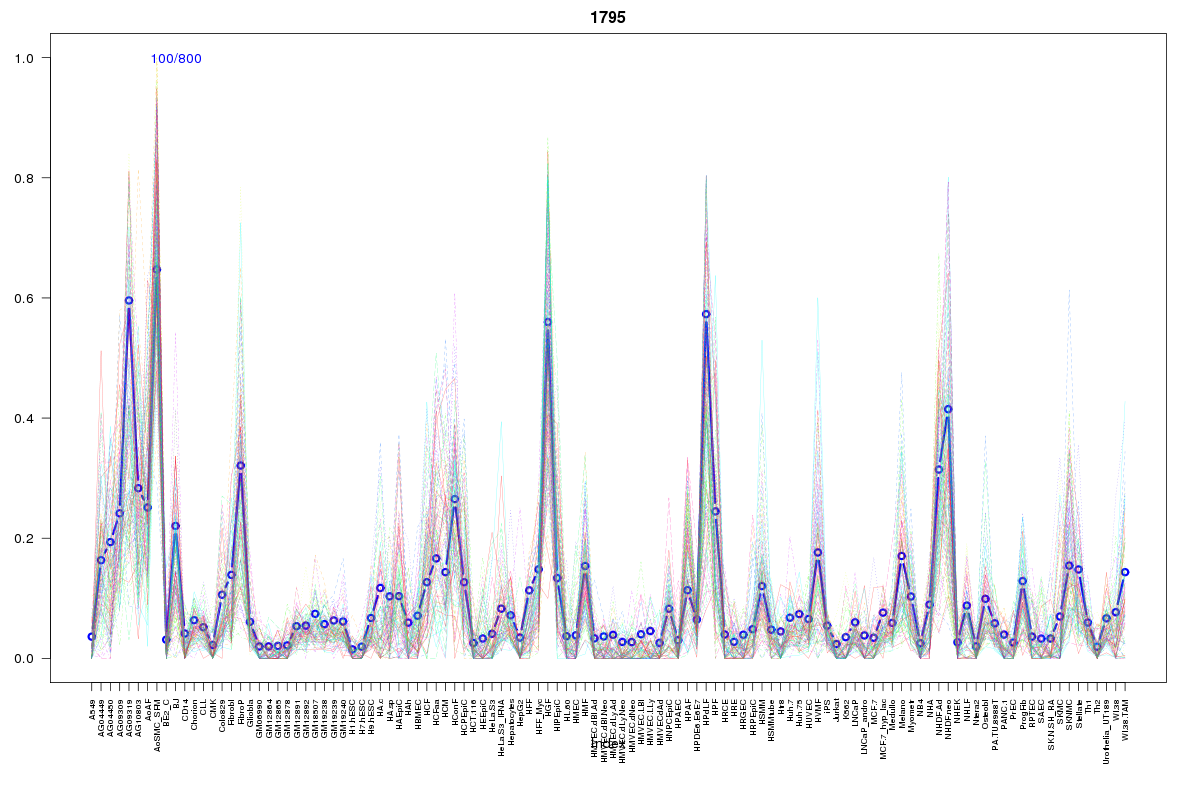 | 1795 | 2 |
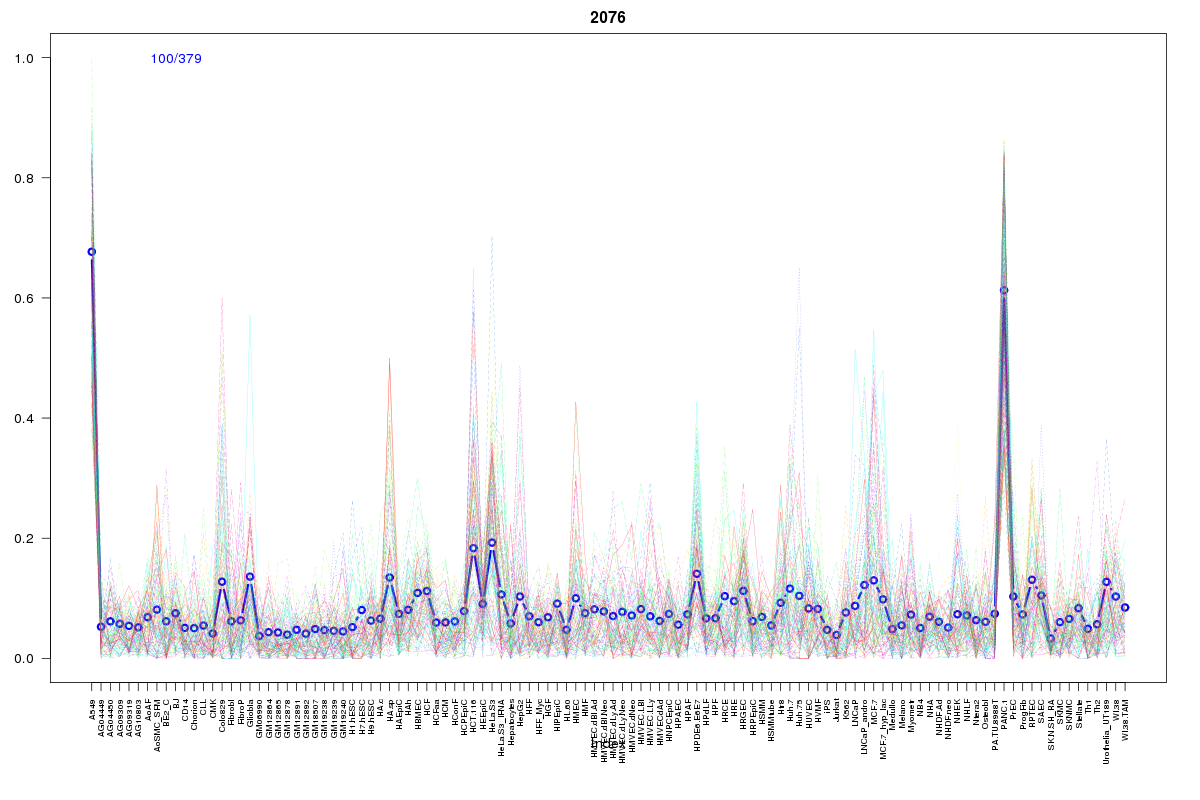 | 2076 | 1 |
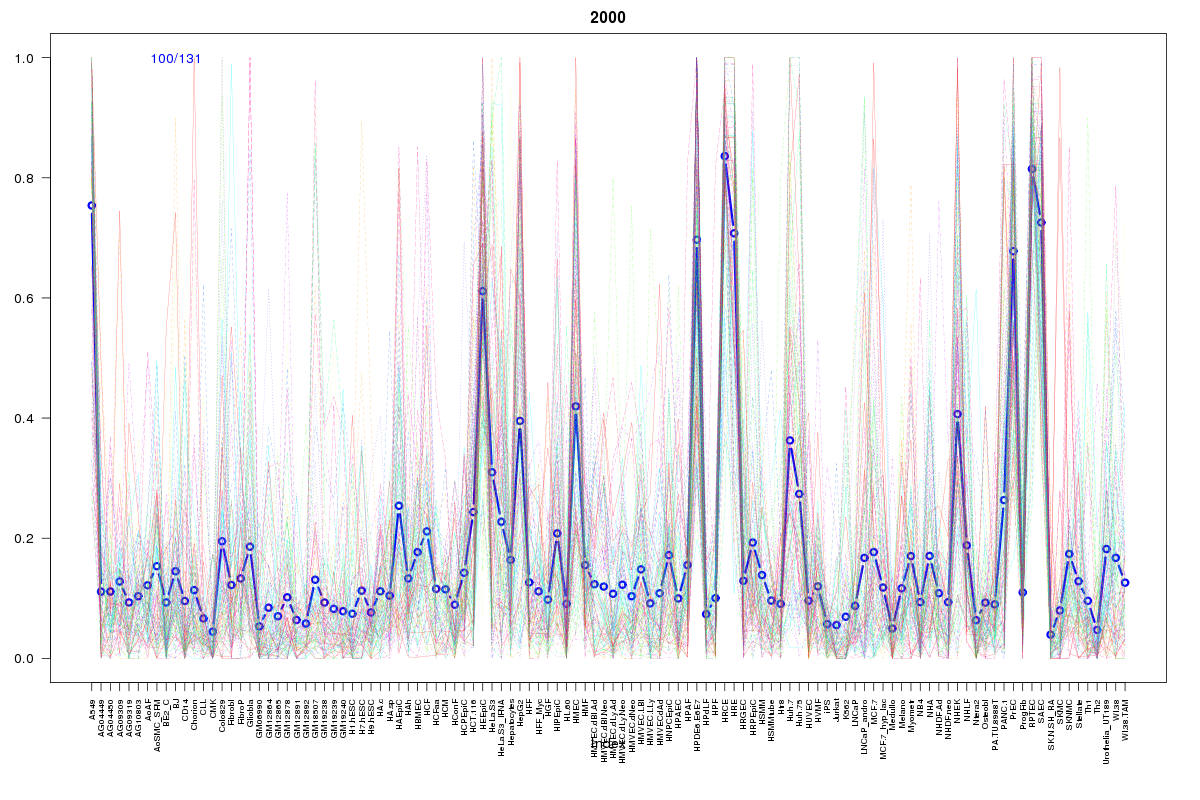 | 2000 | 1 |
 | 862 | 1 |
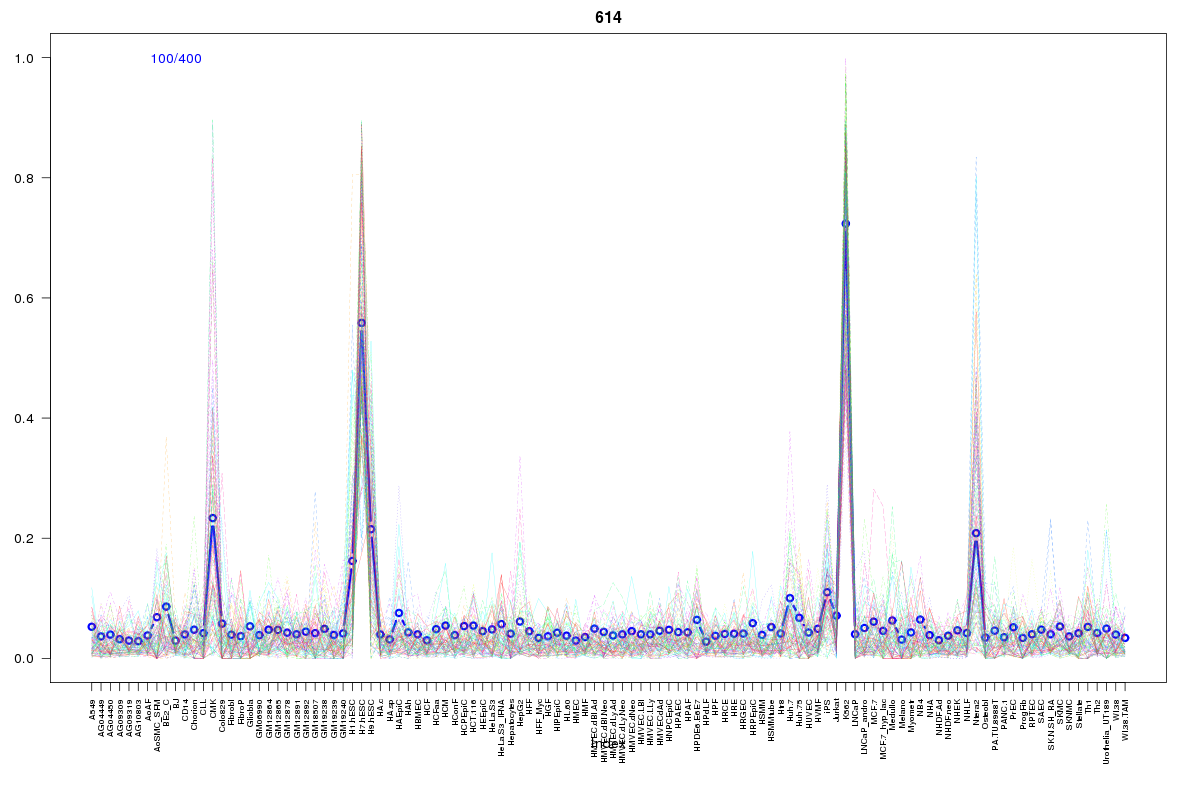 | 614 | 1 |
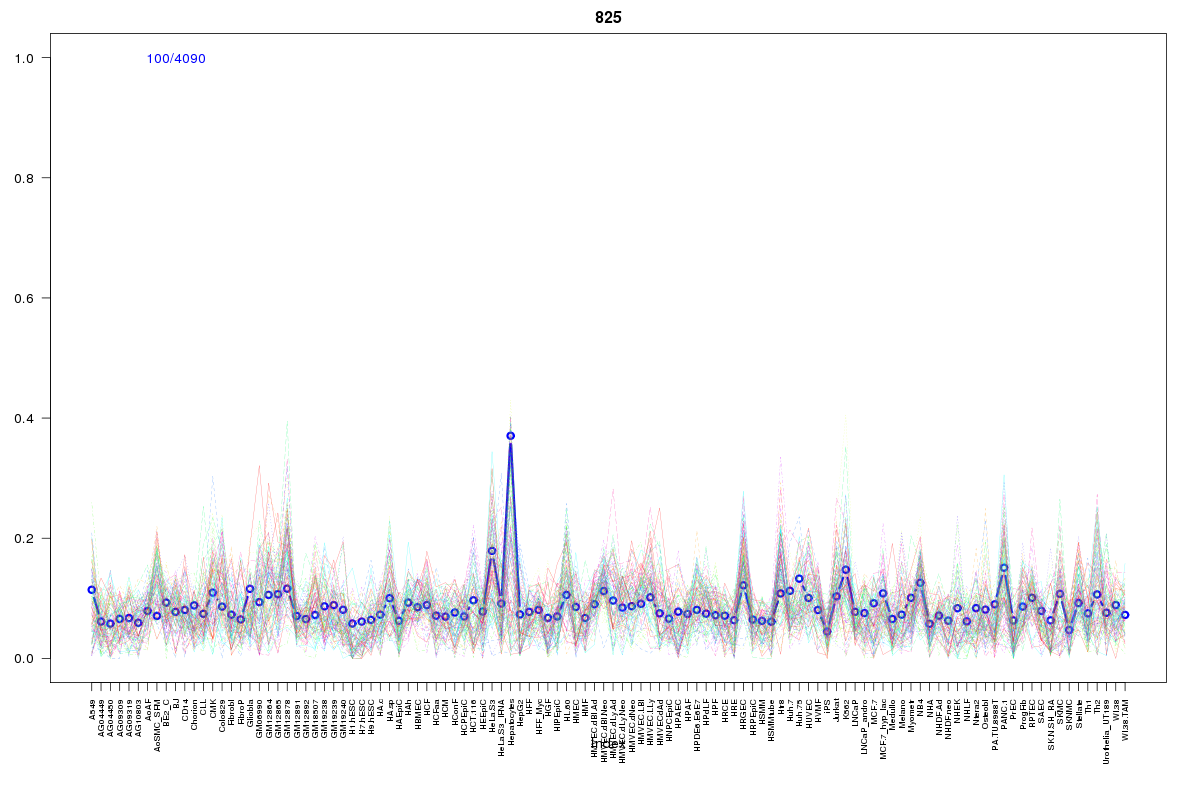 | 825 | 1 |
 | 2195 | 1 |
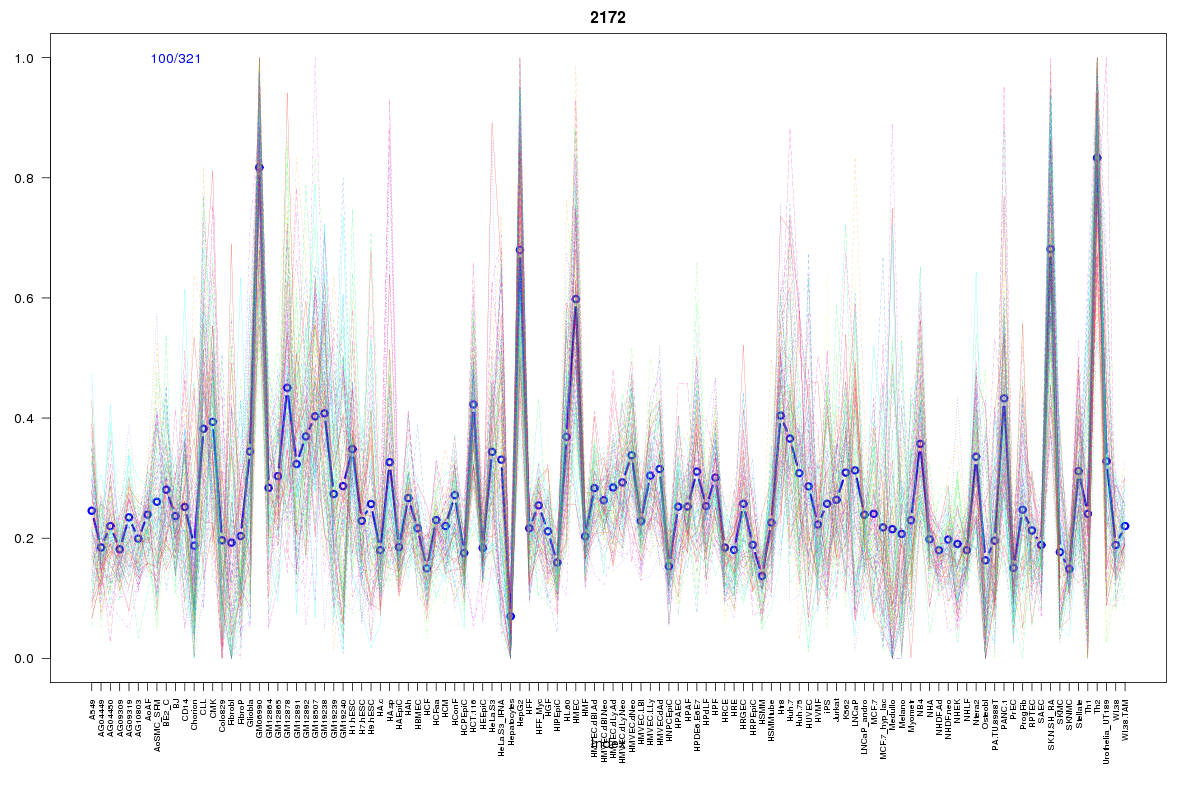 | 2172 | 1 |
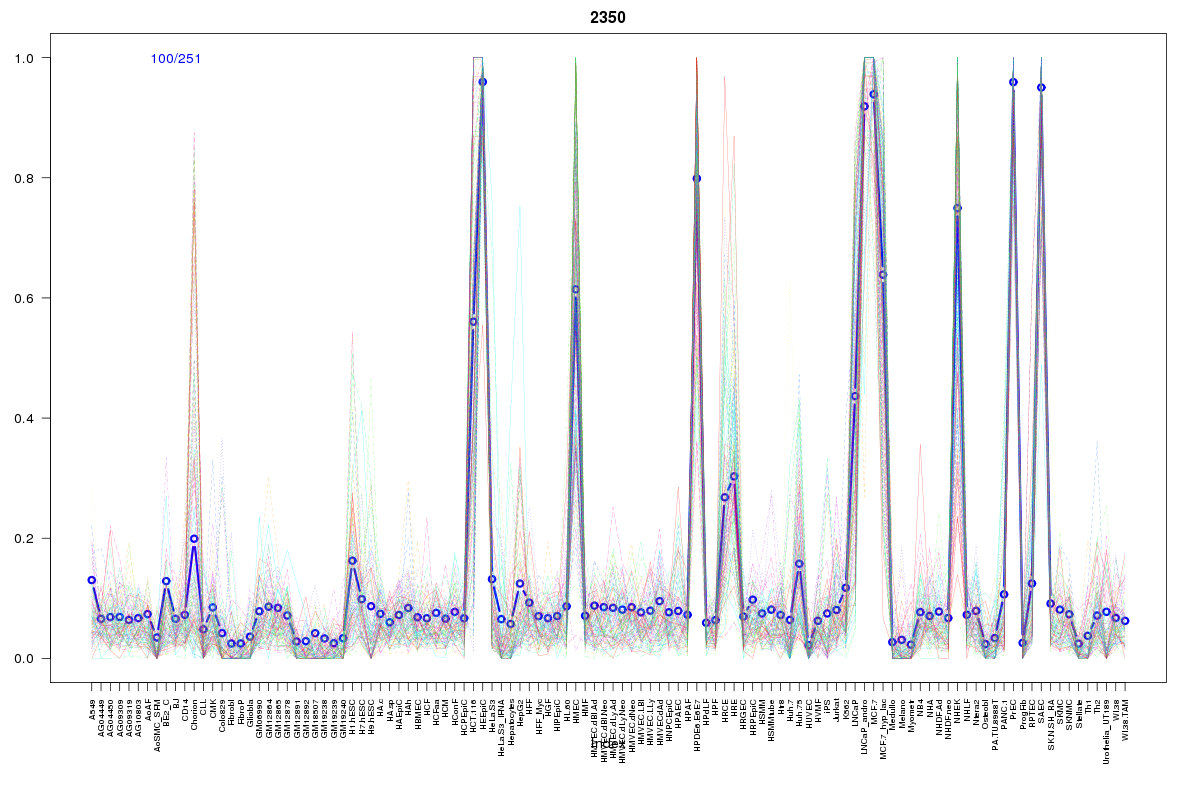 | 2350 | 1 |
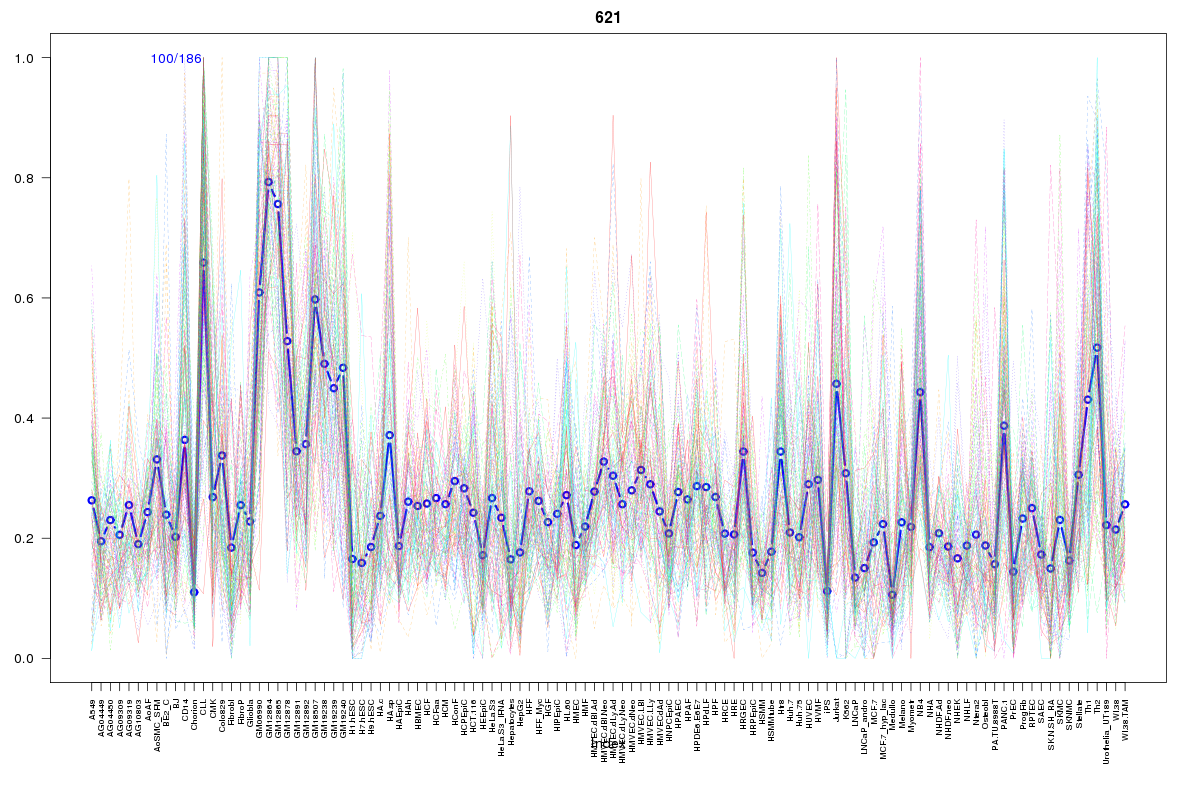 | 621 | 1 |
 | 1724 | 1 |
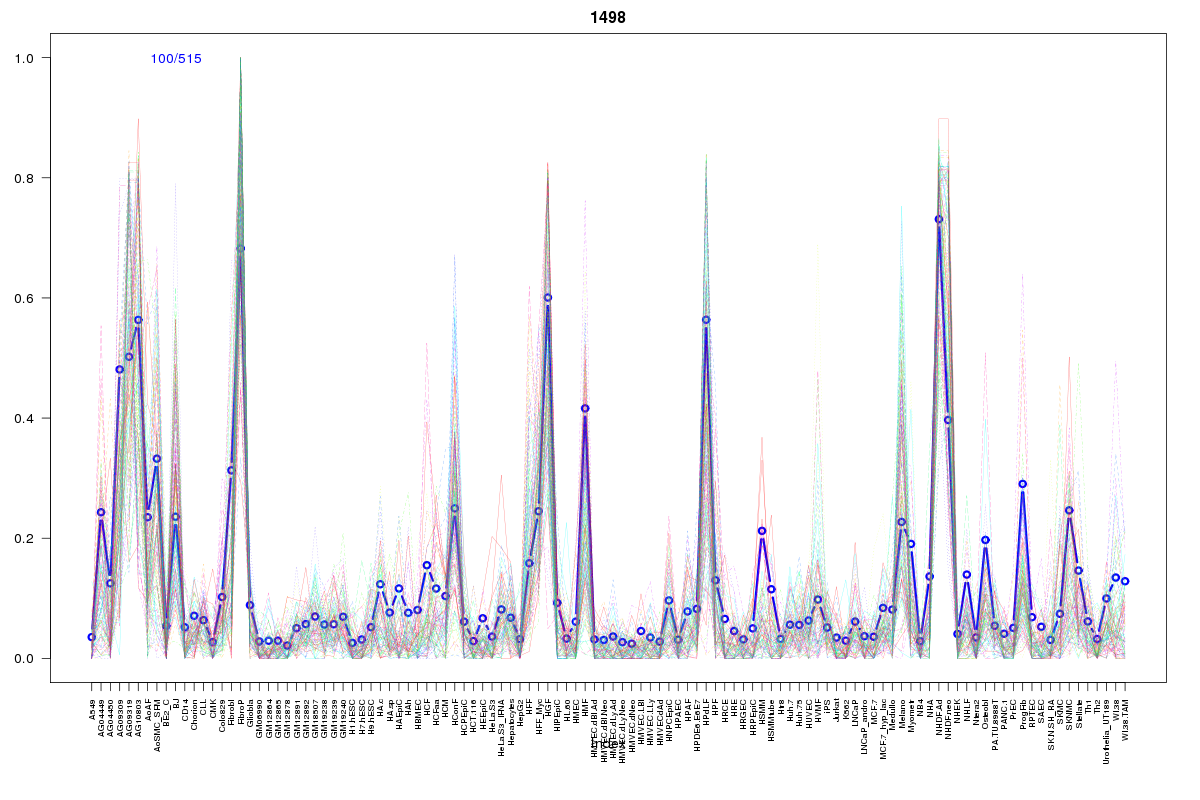 | 1498 | 1 |
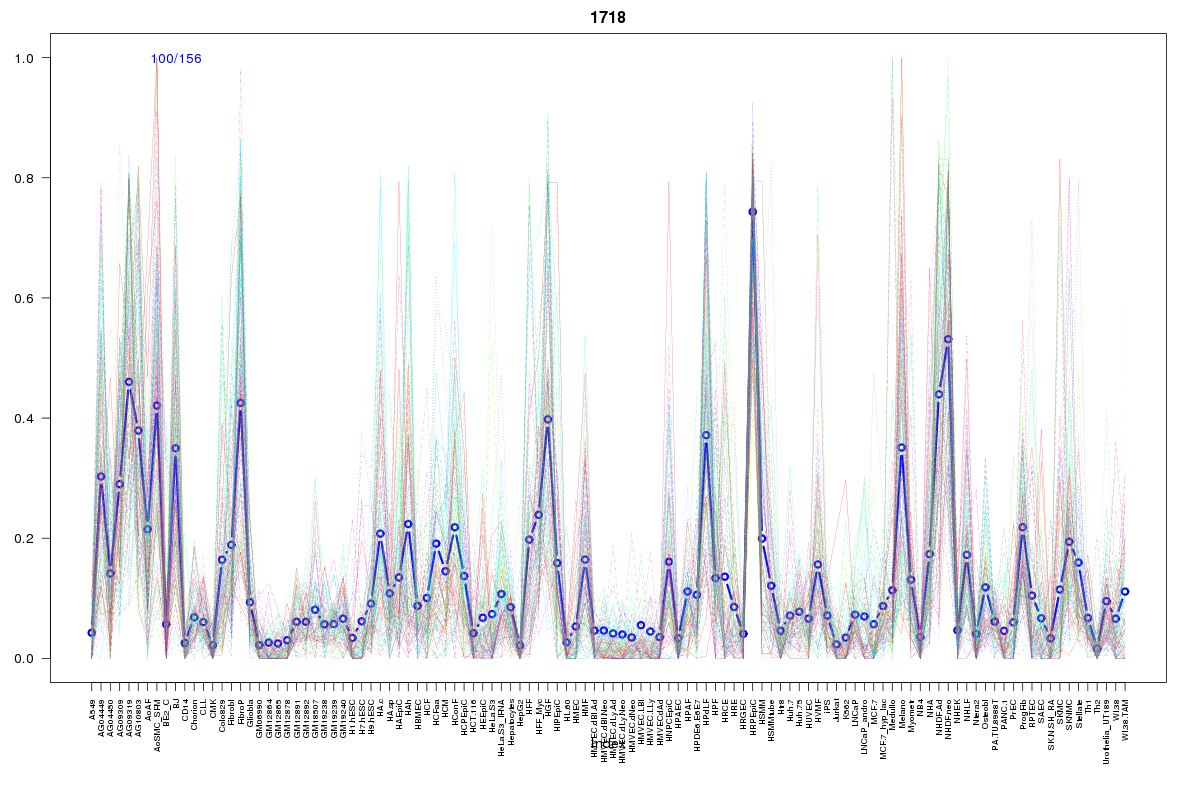 | 1718 | 1 |
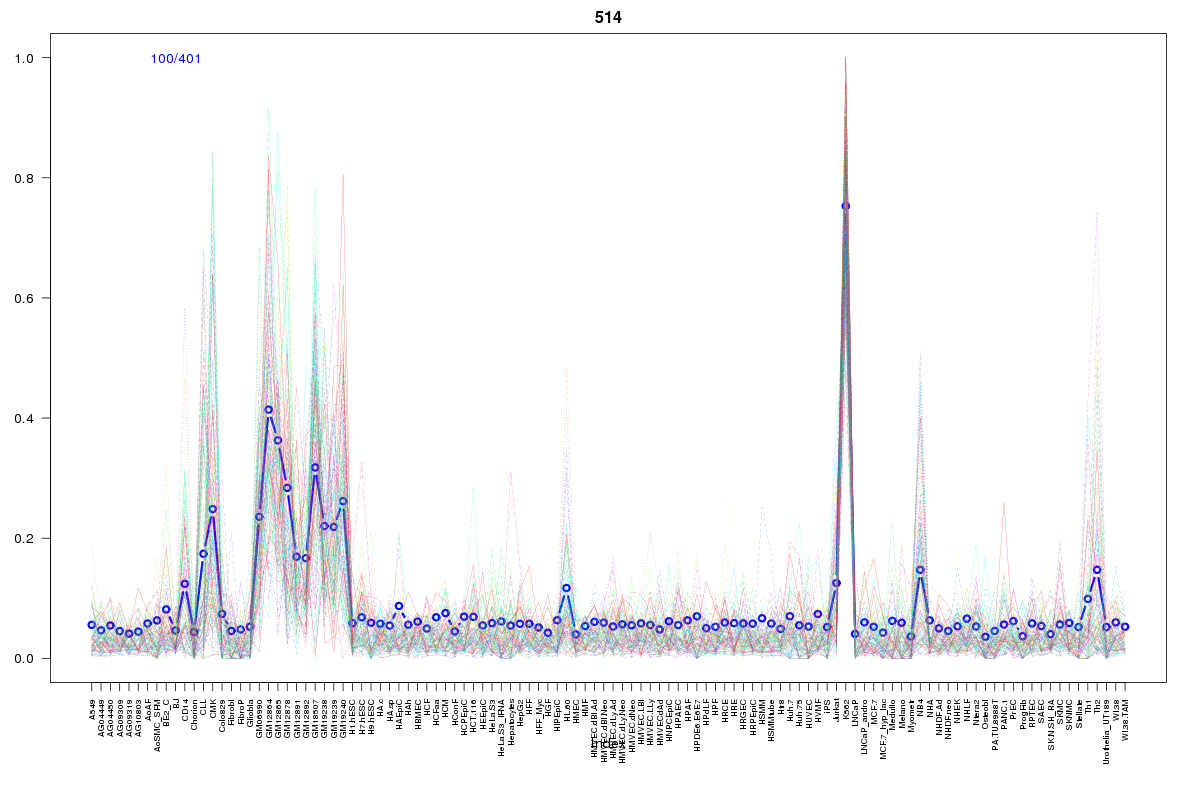 | 514 | 1 |
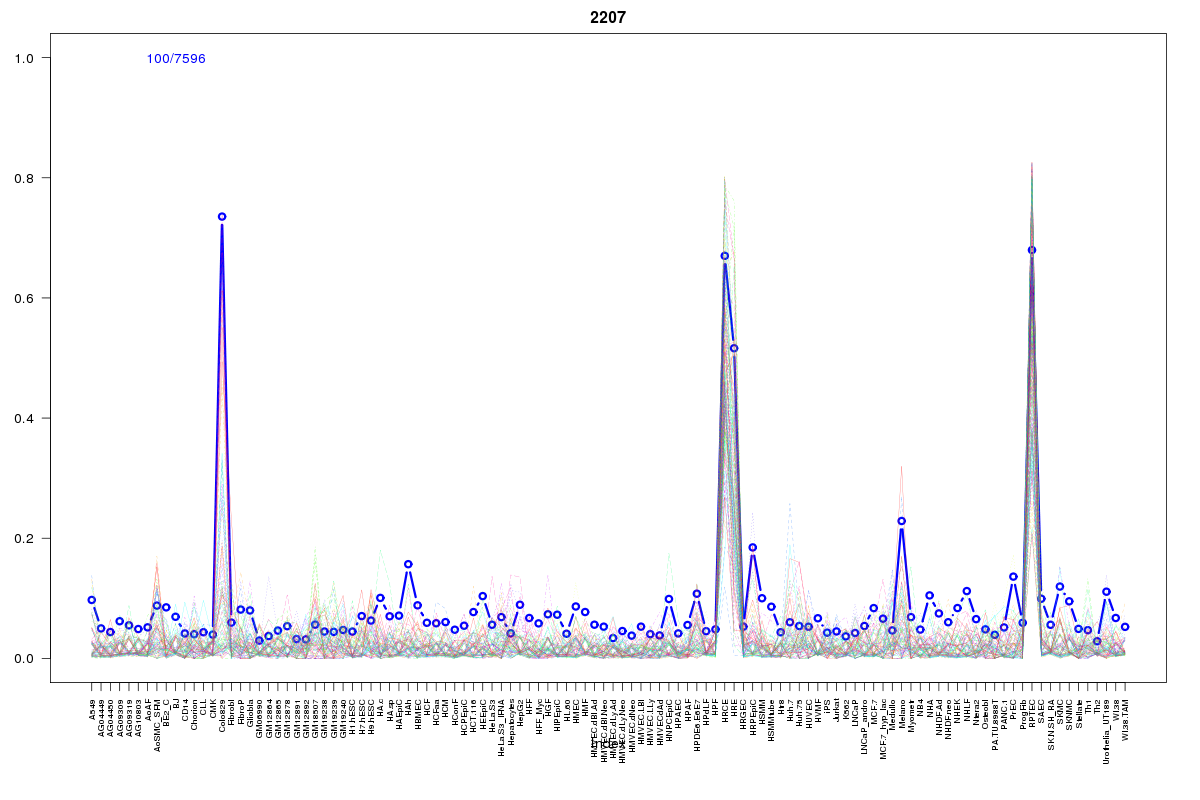 | 2207 | 1 |
 | 2298 | 1 |
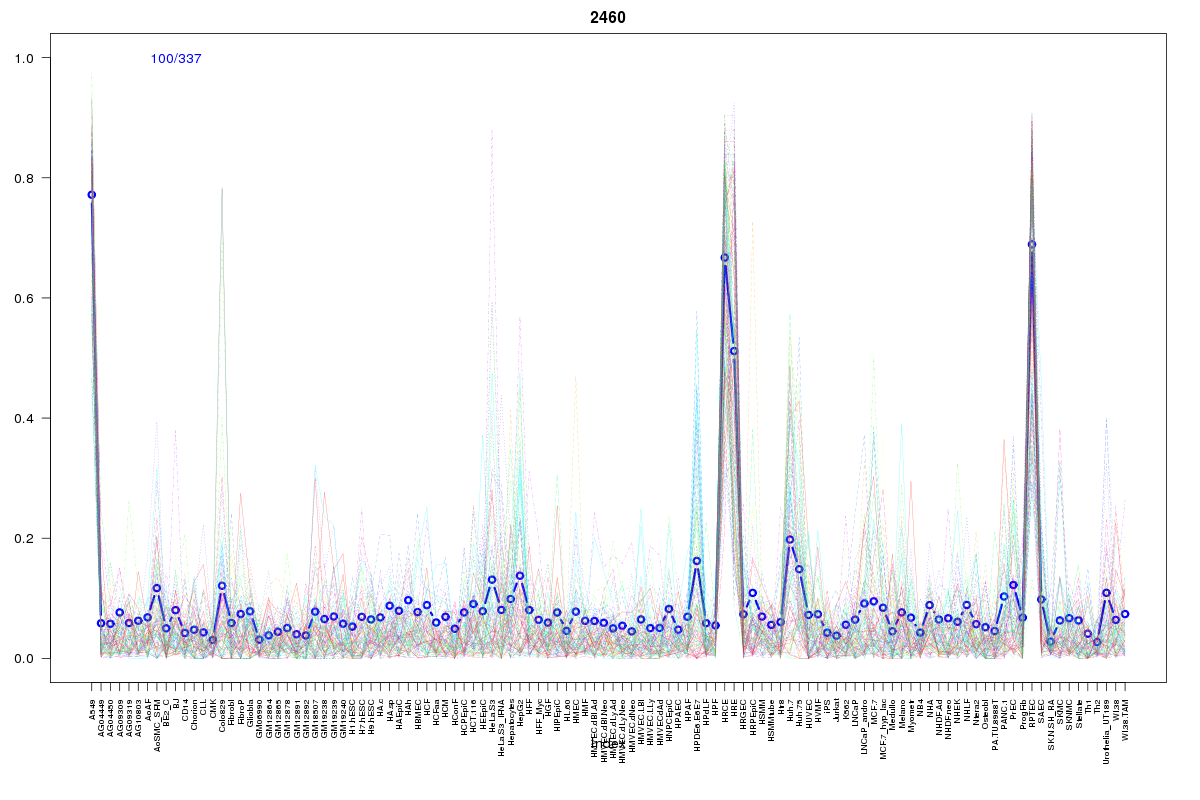 | 2460 | 1 |
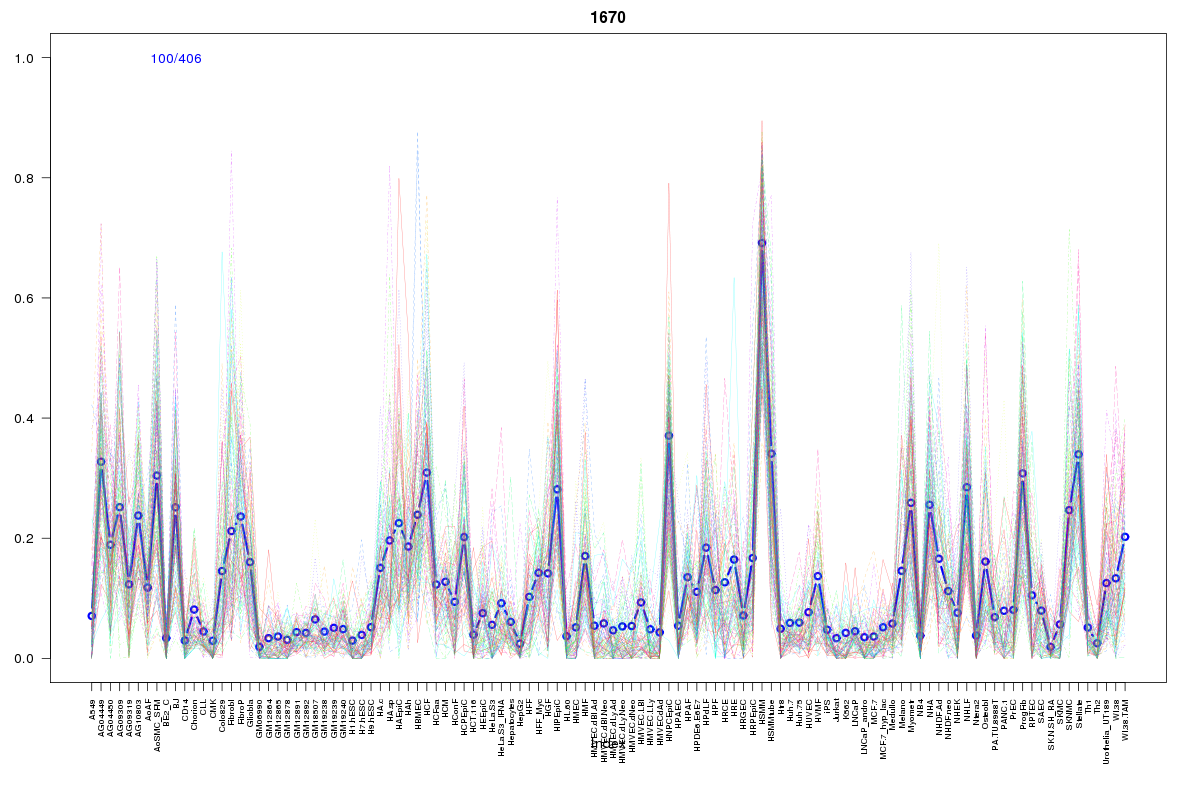 | 1670 | 1 |
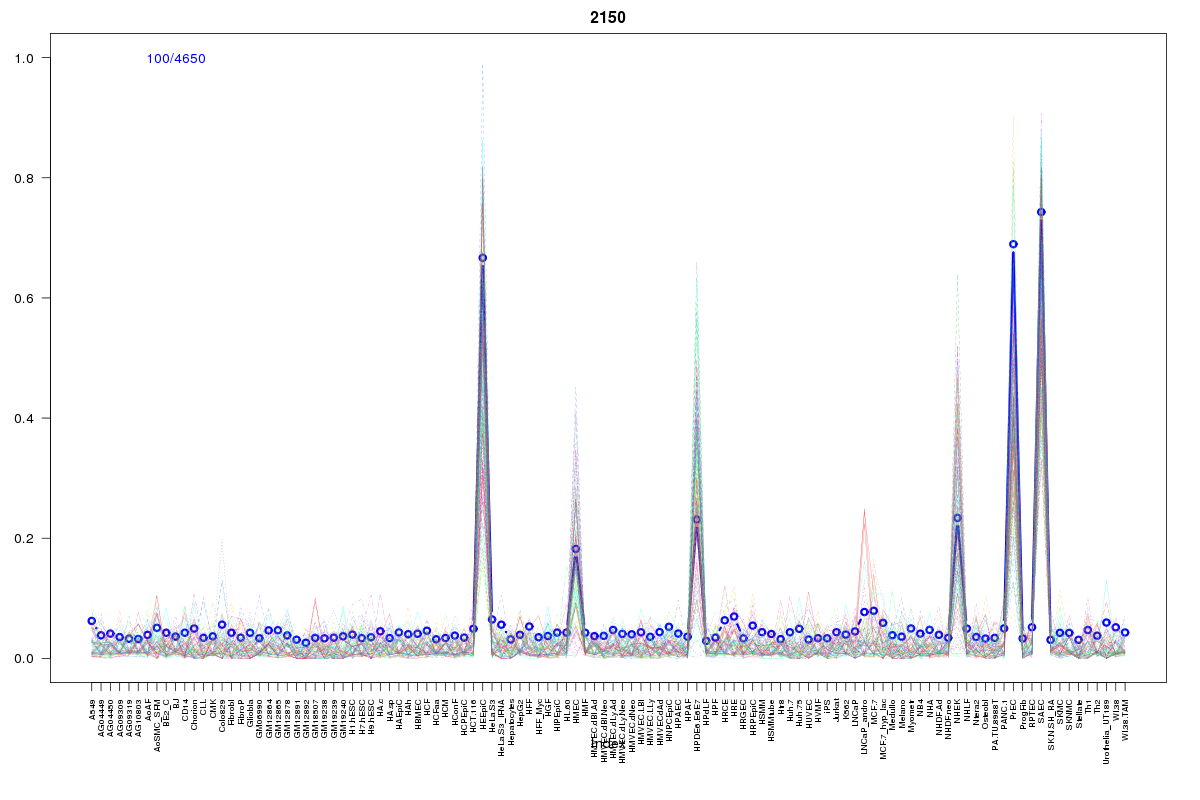 | 2150 | 1 |
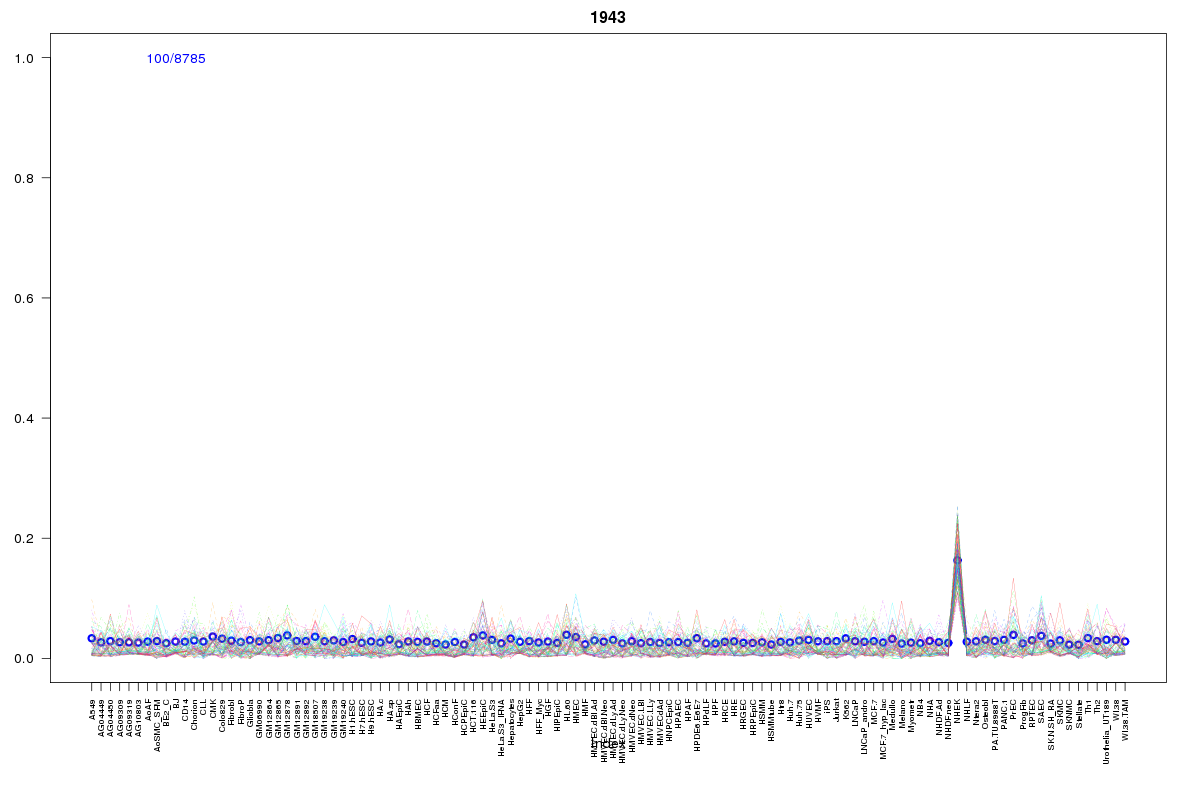 | 1943 | 1 |
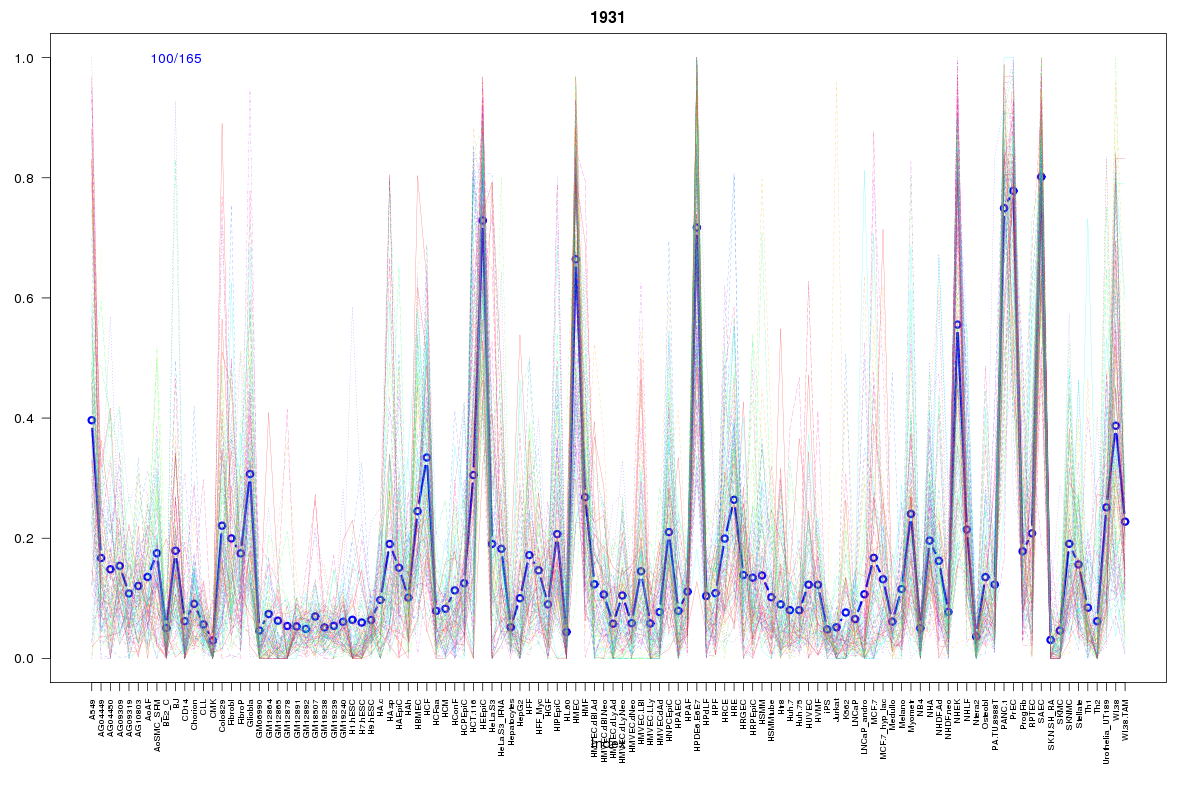 | 1931 | 1 |
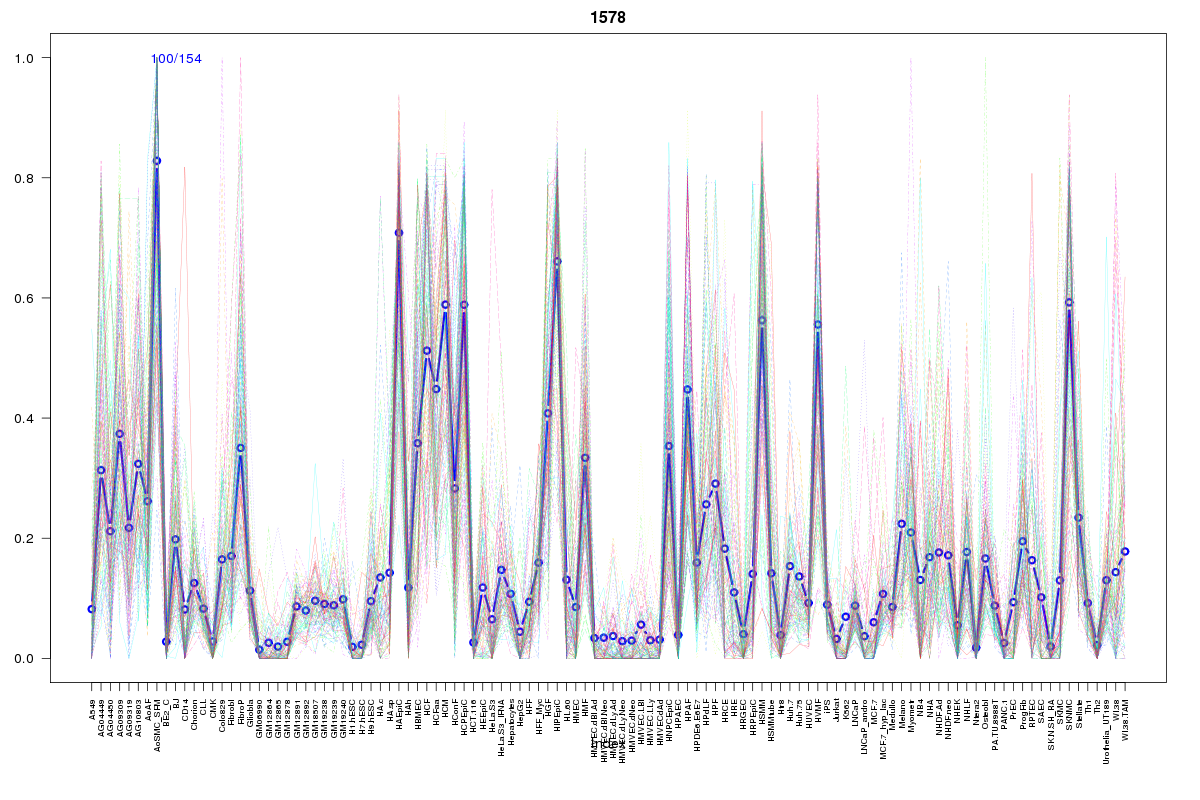 | 1578 | 1 |
 | 2079 | 1 |
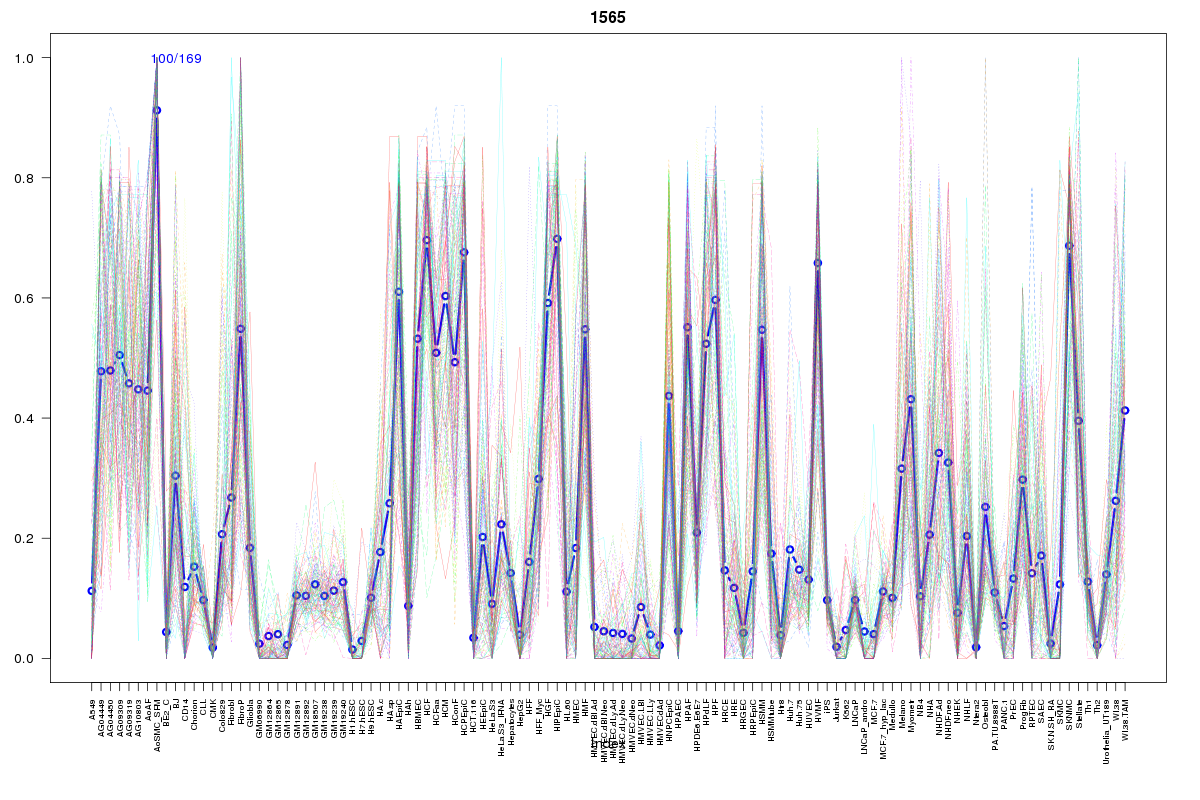 | 1565 | 1 |
Resources
BED file downloads
Connects to 37 DHS sitesTop 10 Correlated DHS Sites
p-values indiciate significant higher or lower correlation| Location | Cluster | P-value |
|---|---|---|
| chr9:115096860-115097010 | 621 | 0 |
| chr9:115096365-115096515 | 2172 | 0.001 |
| chr9:115140980-115141130 | 1848 | 0.001 |
| chr9:114928460-114928610 | 2000 | 0.002 |
| chr9:114909420-114909570 | 2079 | 0.002 |
| chr9:114943265-114943415 | 514 | 0.002 |
| chr9:114908280-114908430 | 1931 | 0.004 |
| chr9:114903340-114903490 | 2150 | 0.004 |
| chr9:115095180-115095330 | 183 | 0.004 |
| chr9:114930585-114930735 | 1848 | 0.004 |
| chr9:114928305-114928455 | 1857 | 0.006 |
External Databases
UCSCEnsembl (ENSG00000119314)