Gene: TSPAN1
chr1: 46640744-46650970Expression Profile
(log scale)
Graphical Connections
Distribution of linked clusters:
You may find it interesting if many of the connected DHS sites belong to the same cluster.| Cluster Profile | Cluster ID | Number of DHS sites in this cluster |
|---|---|---|
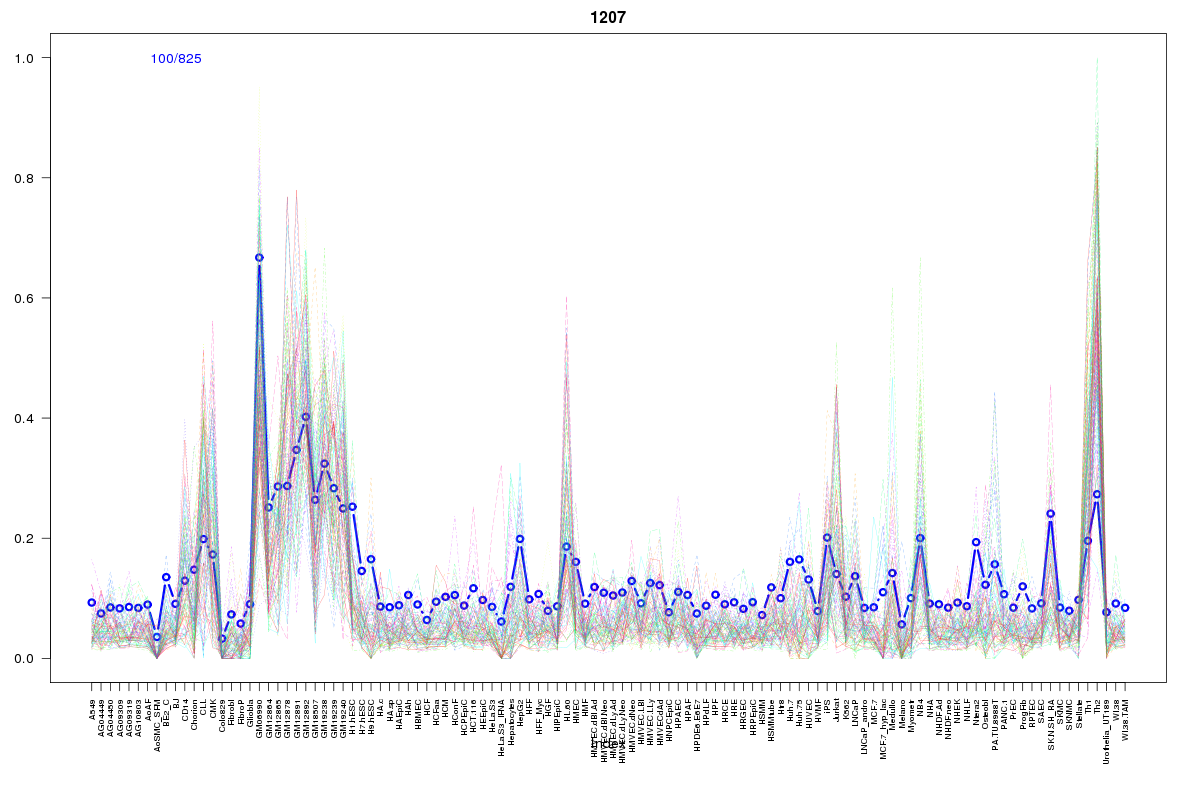 | 1207 | 2 |
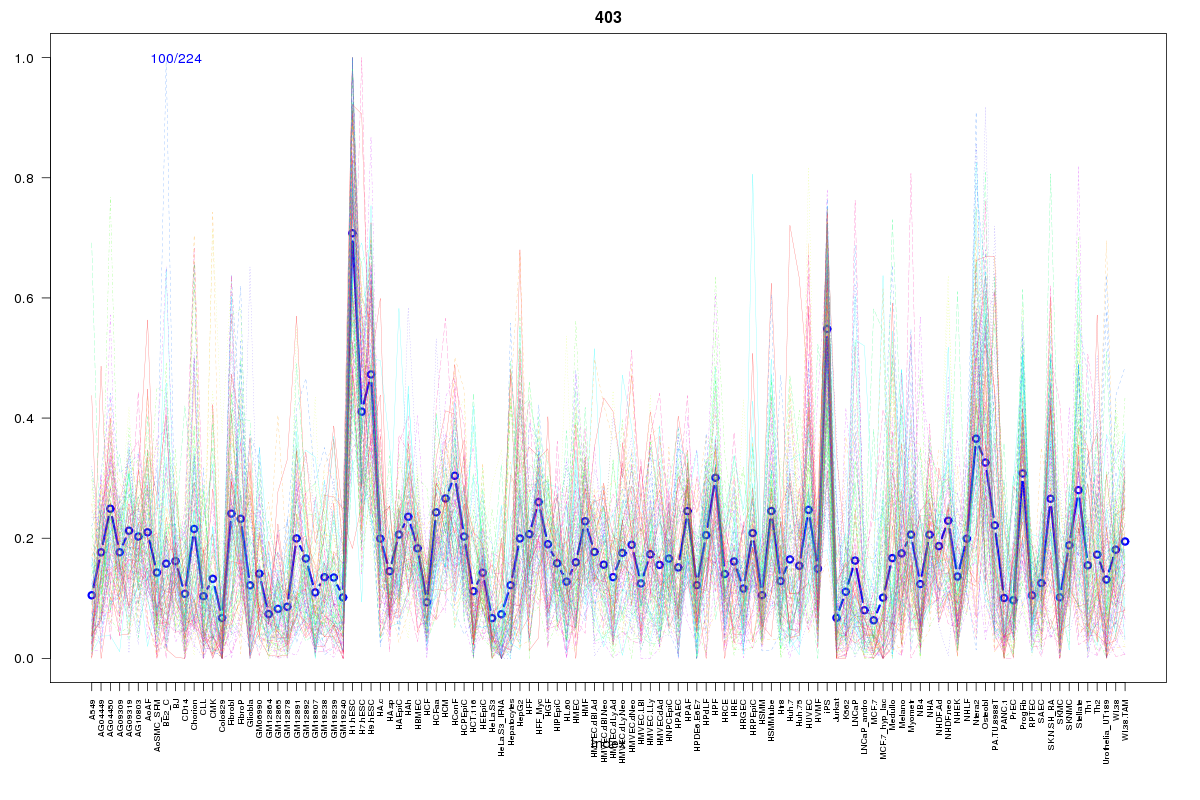 | 403 | 1 |
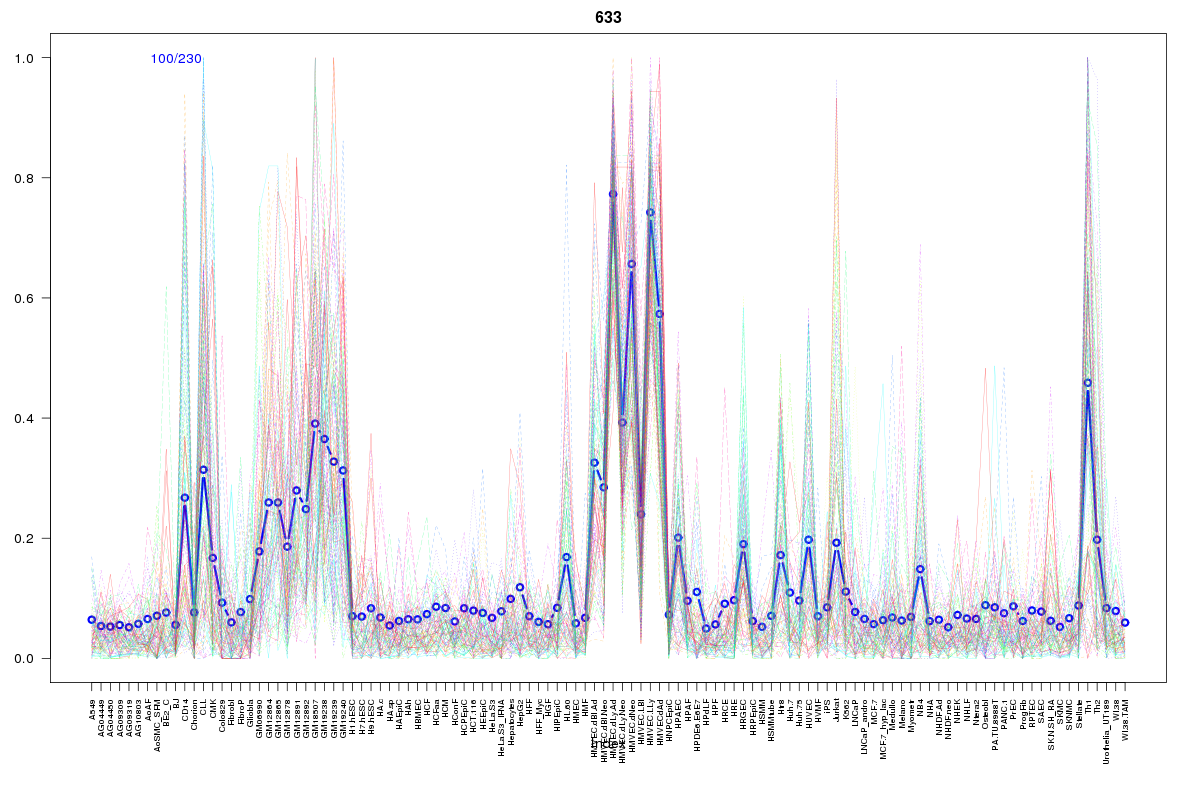 | 633 | 1 |
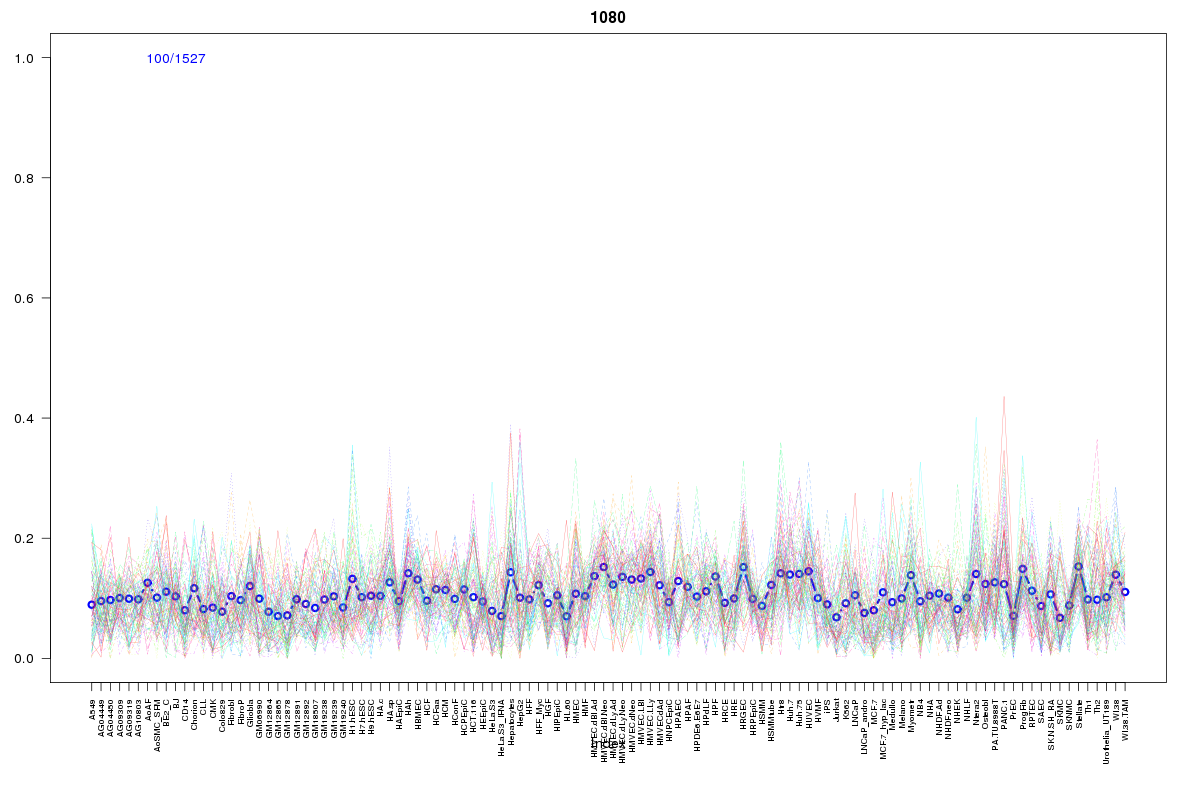 | 1080 | 1 |
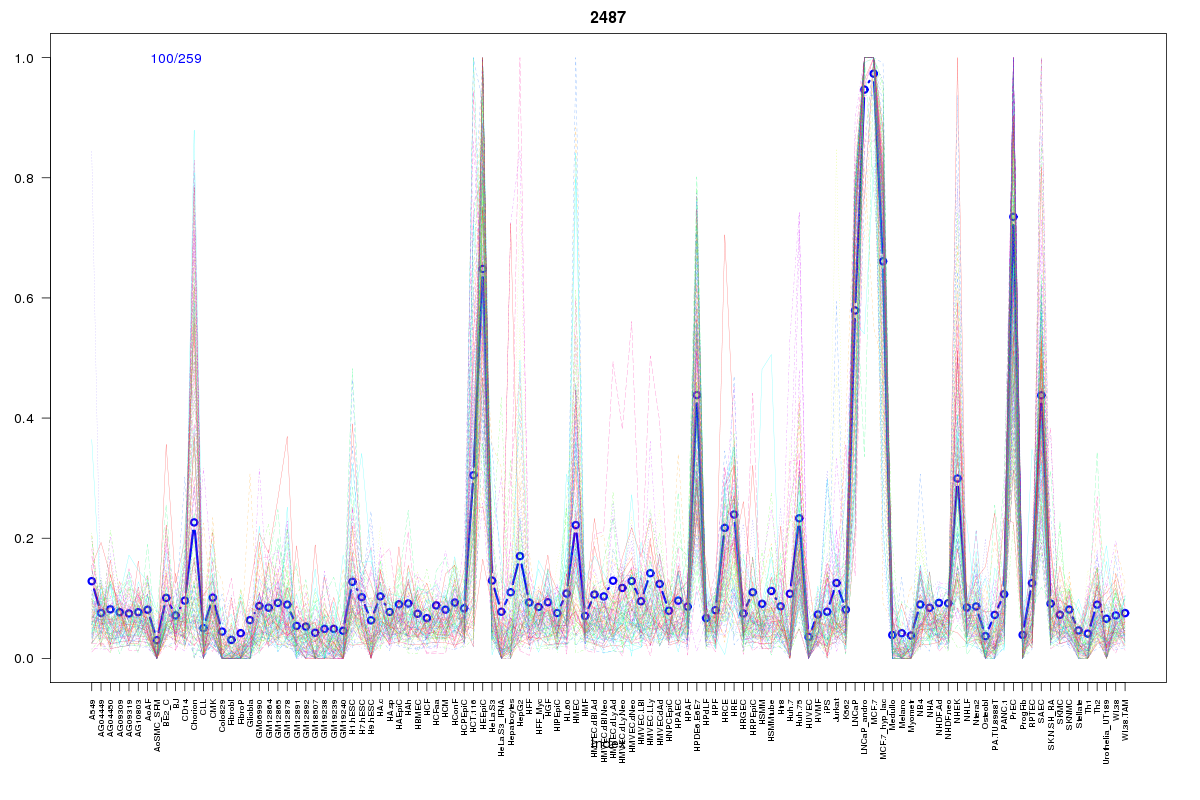 | 2487 | 1 |
 | 2298 | 1 |
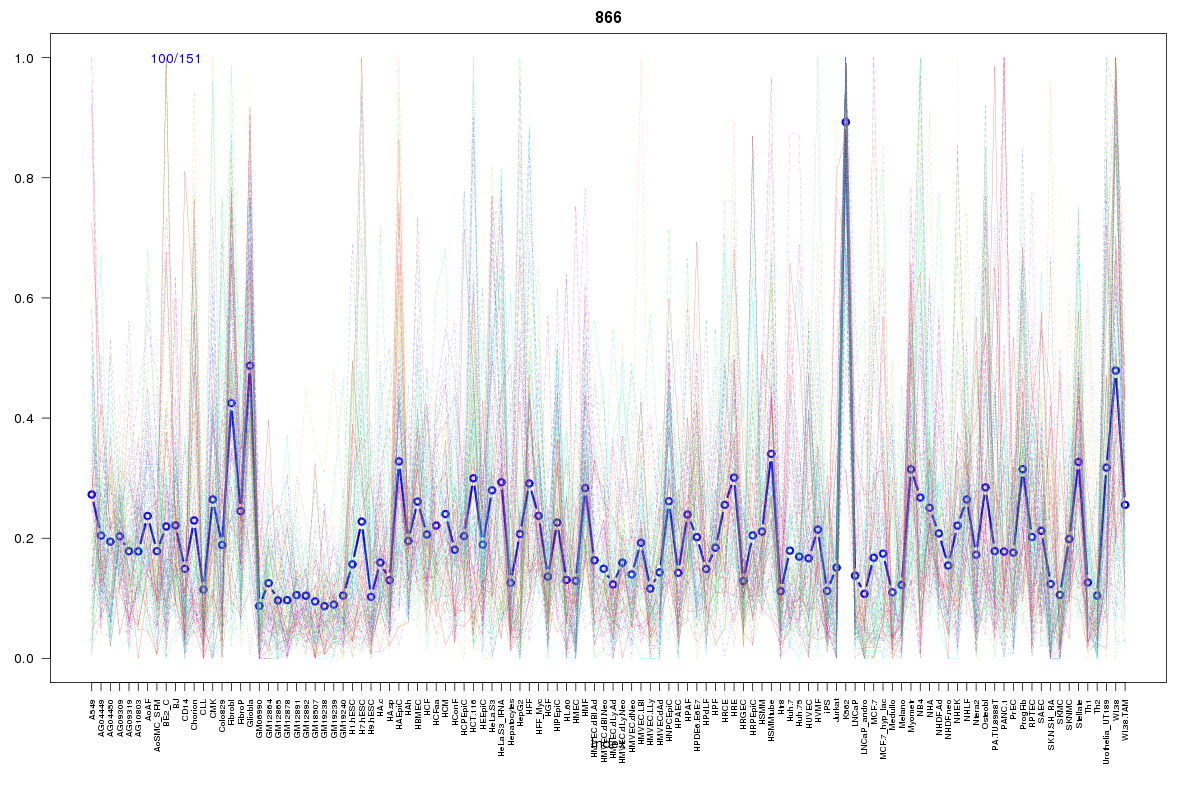 | 866 | 1 |
 | 1605 | 1 |
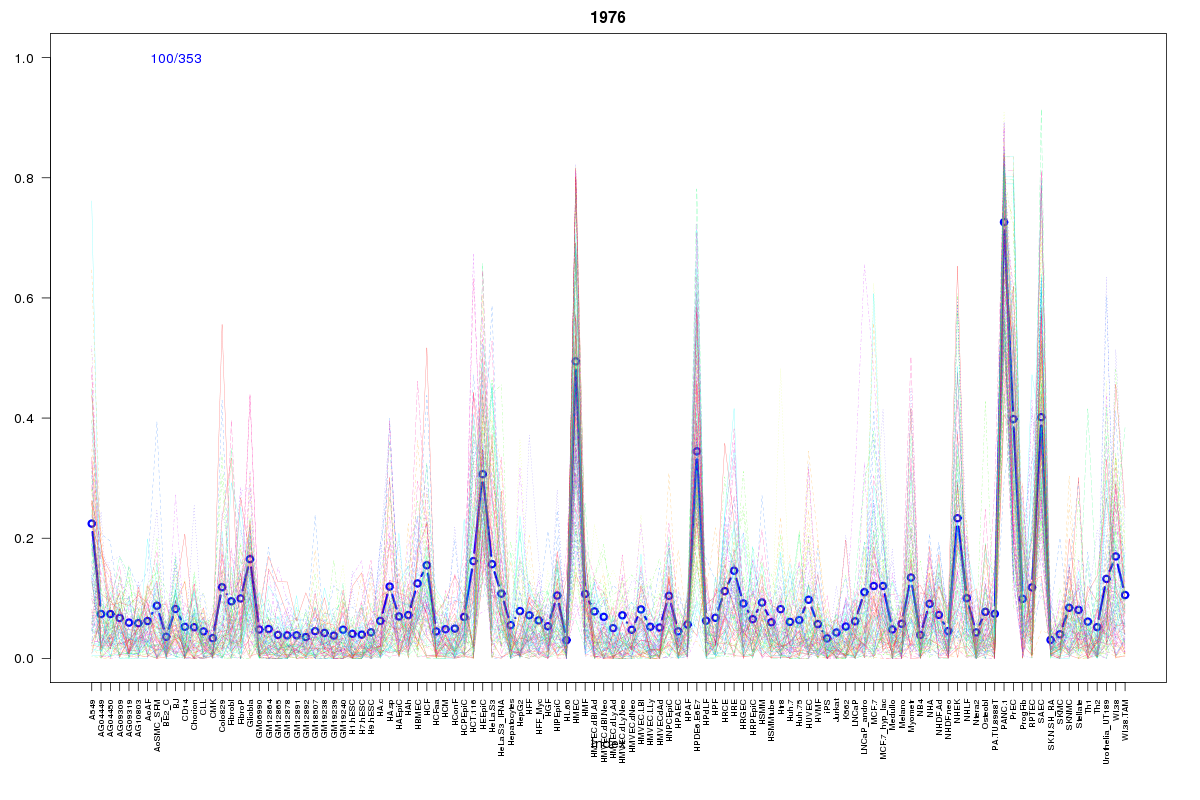 | 1976 | 1 |
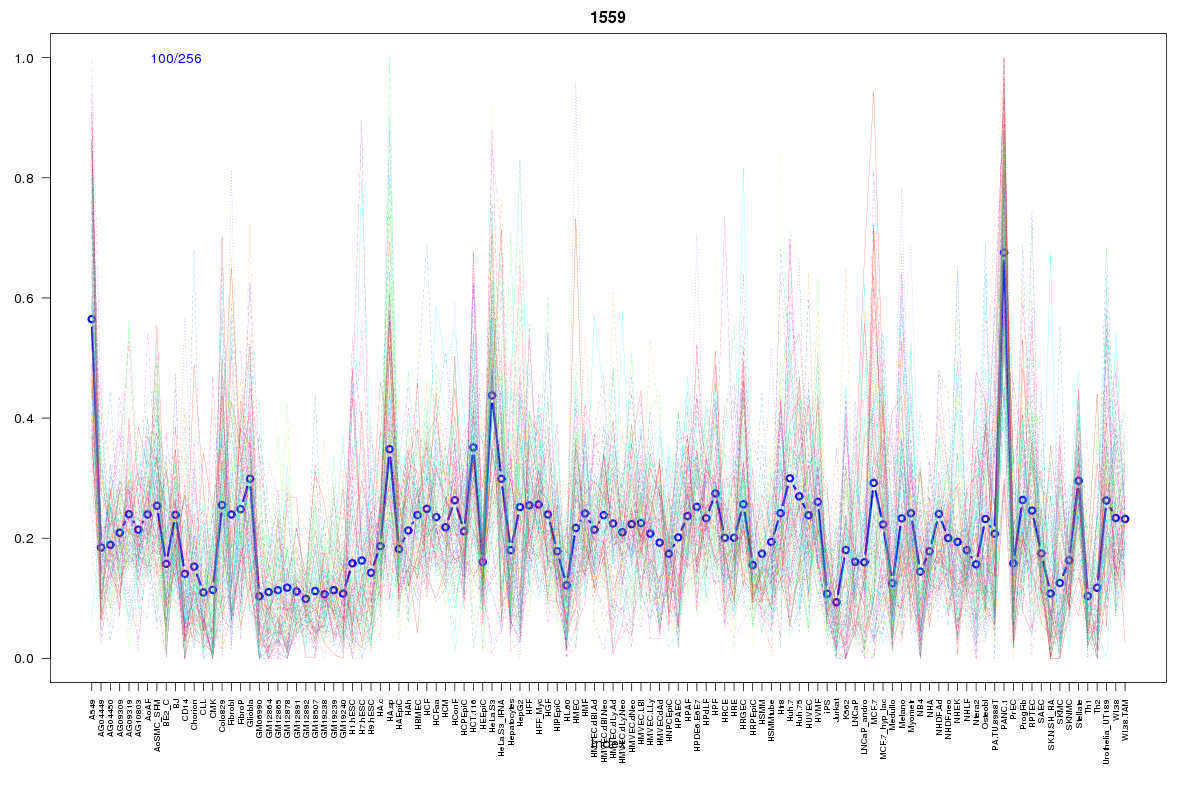 | 1559 | 1 |
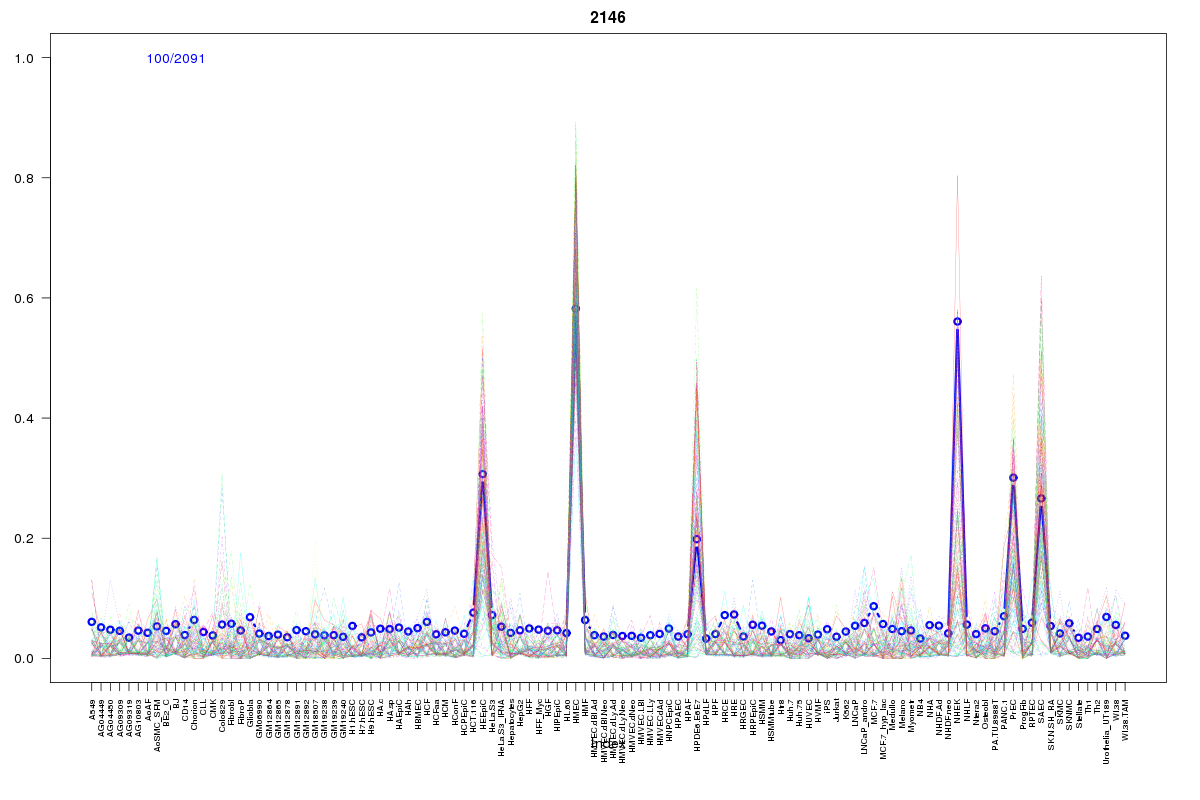 | 2146 | 1 |
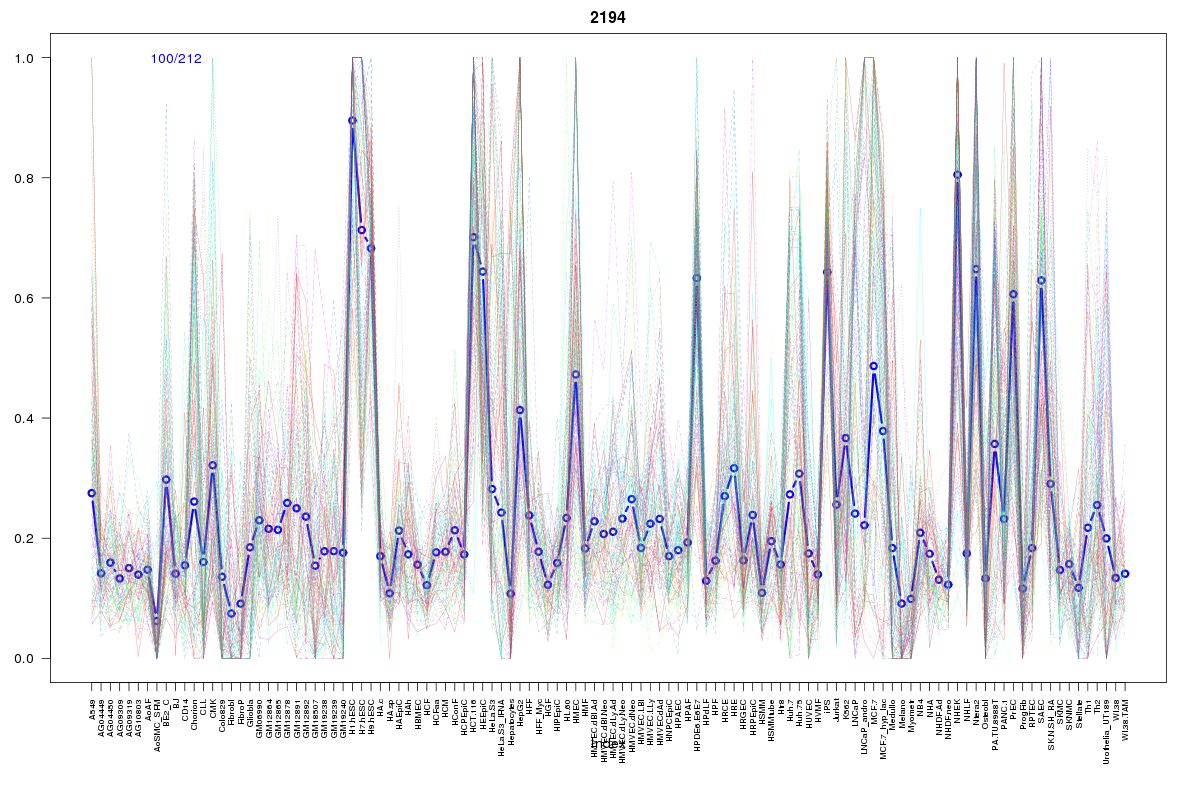 | 2194 | 1 |
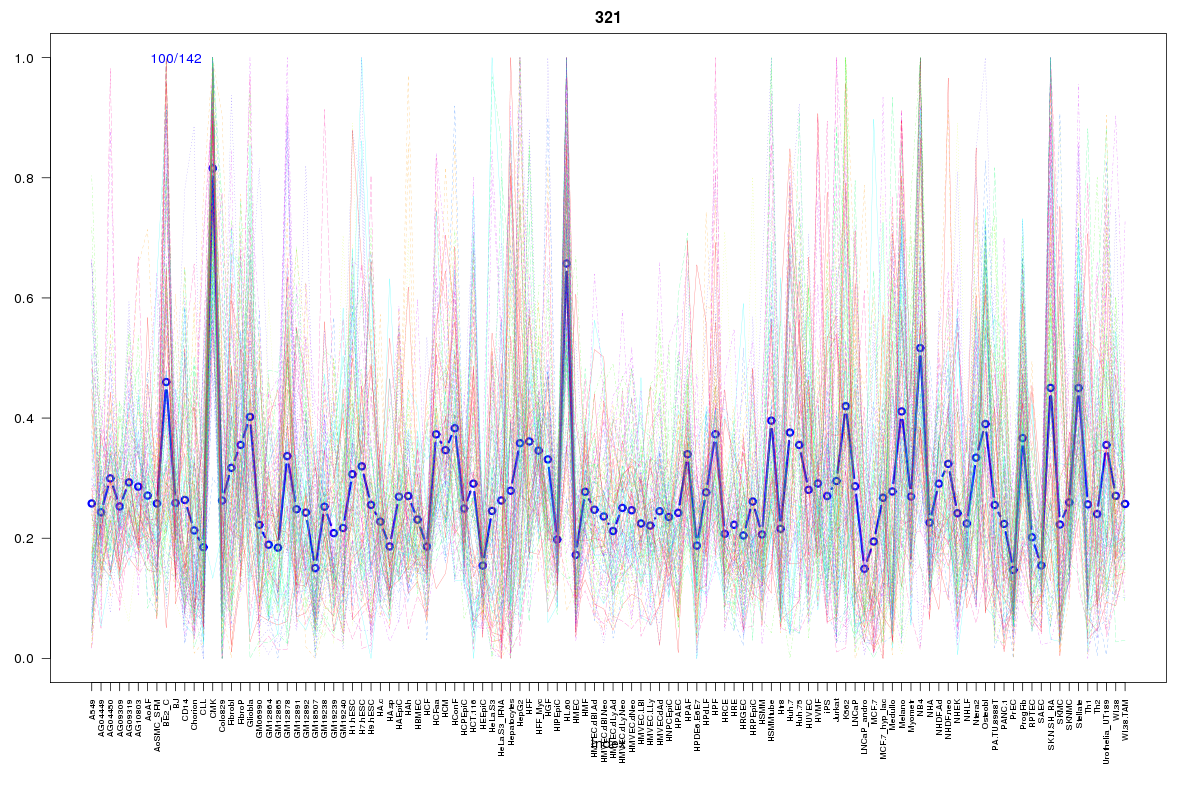 | 321 | 1 |
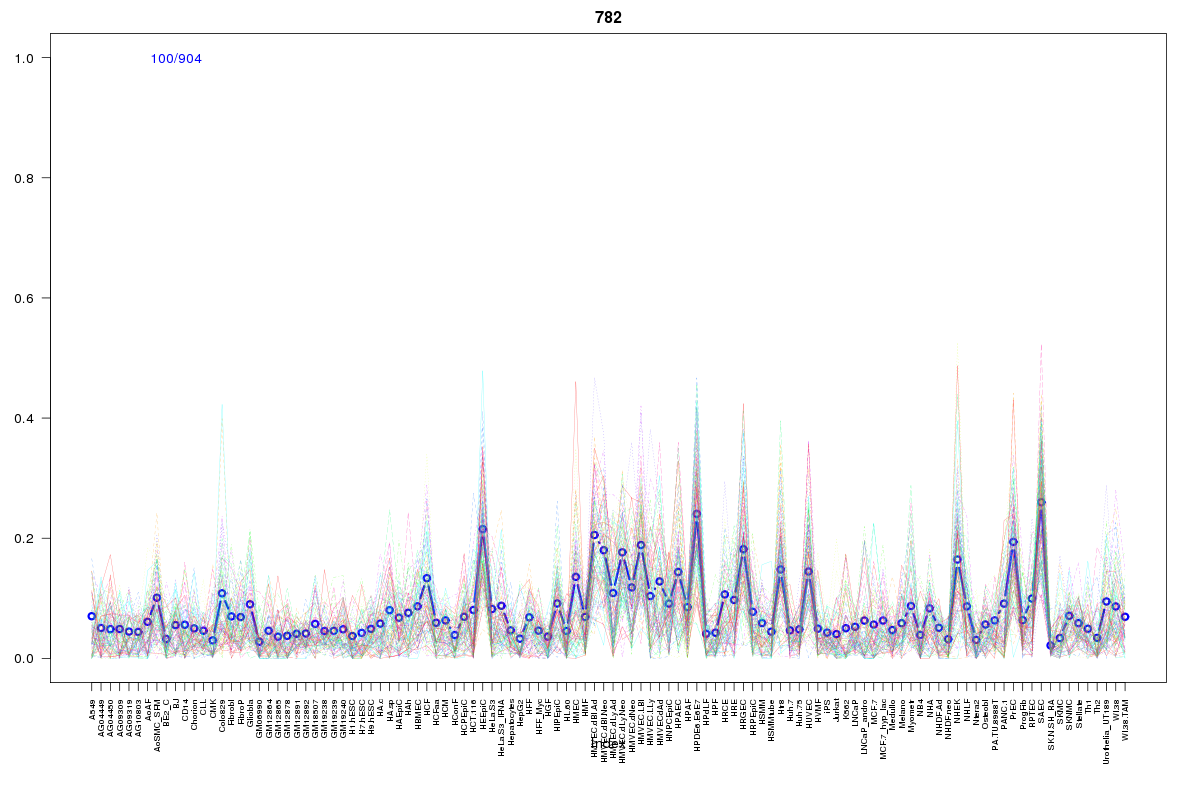 | 782 | 1 |
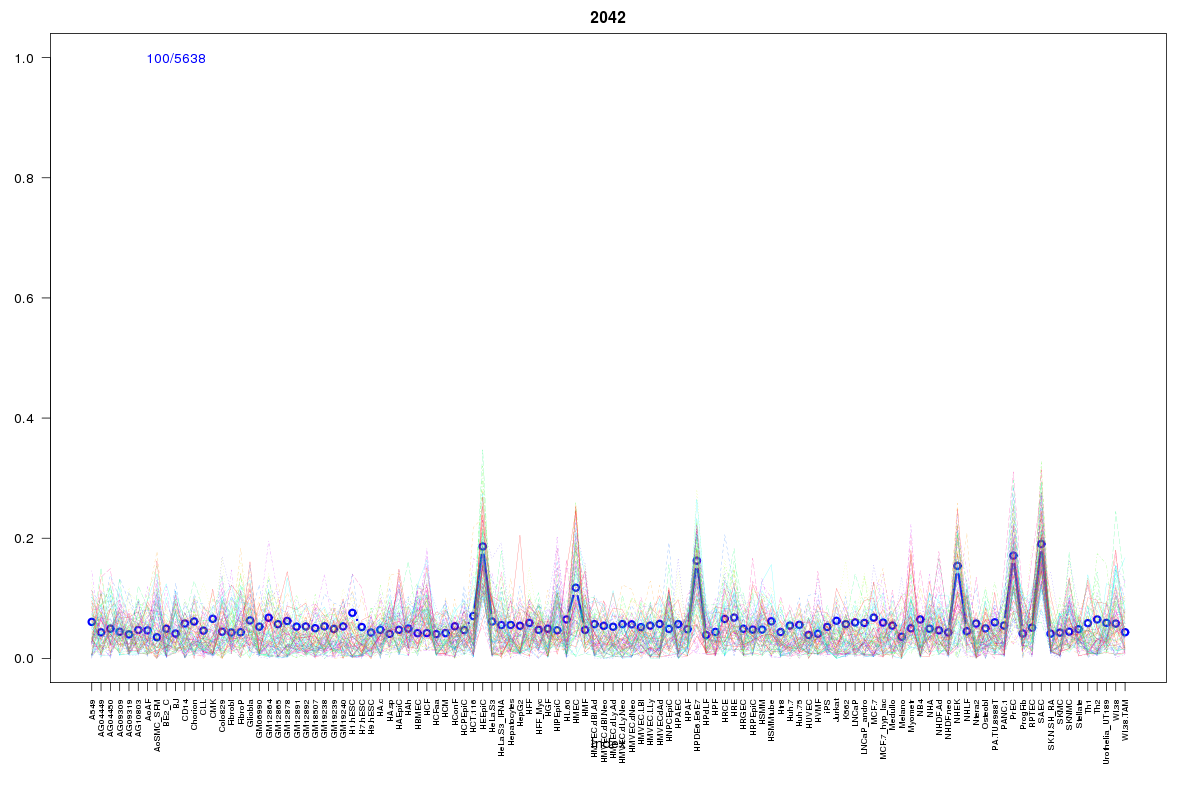 | 2042 | 1 |
 | 928 | 1 |
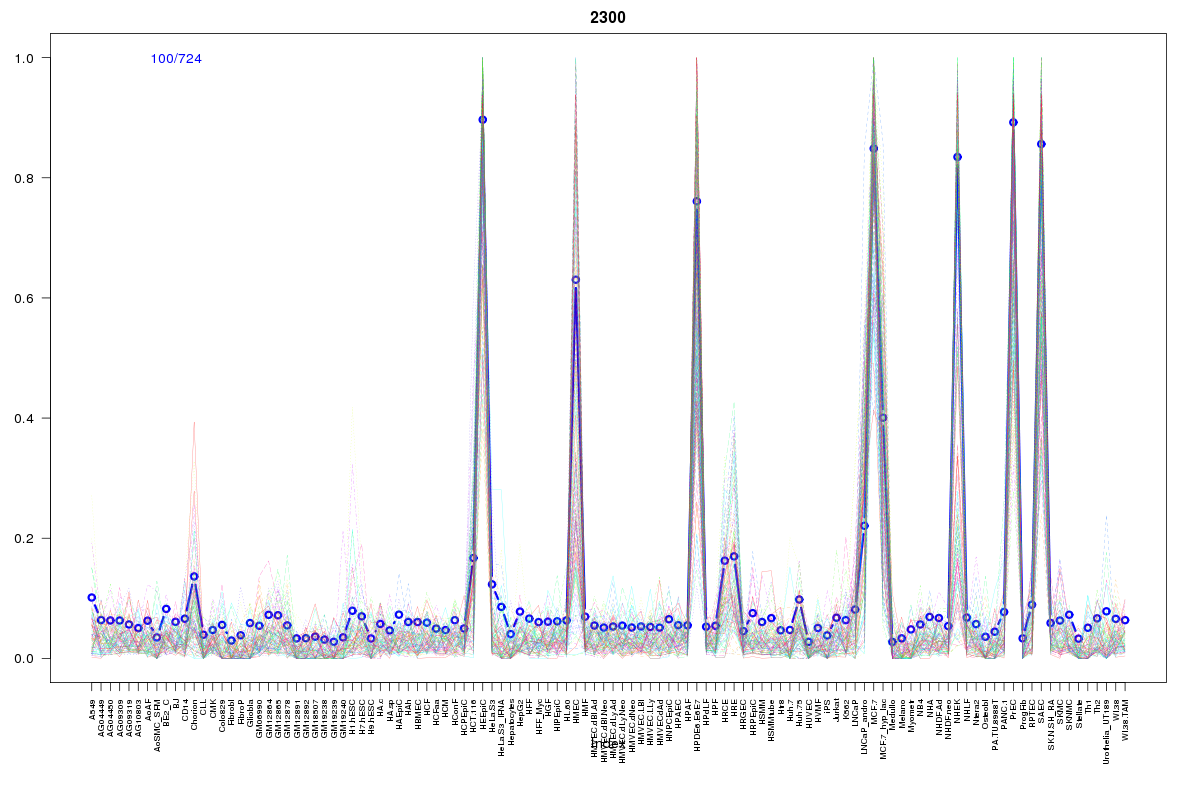 | 2300 | 1 |
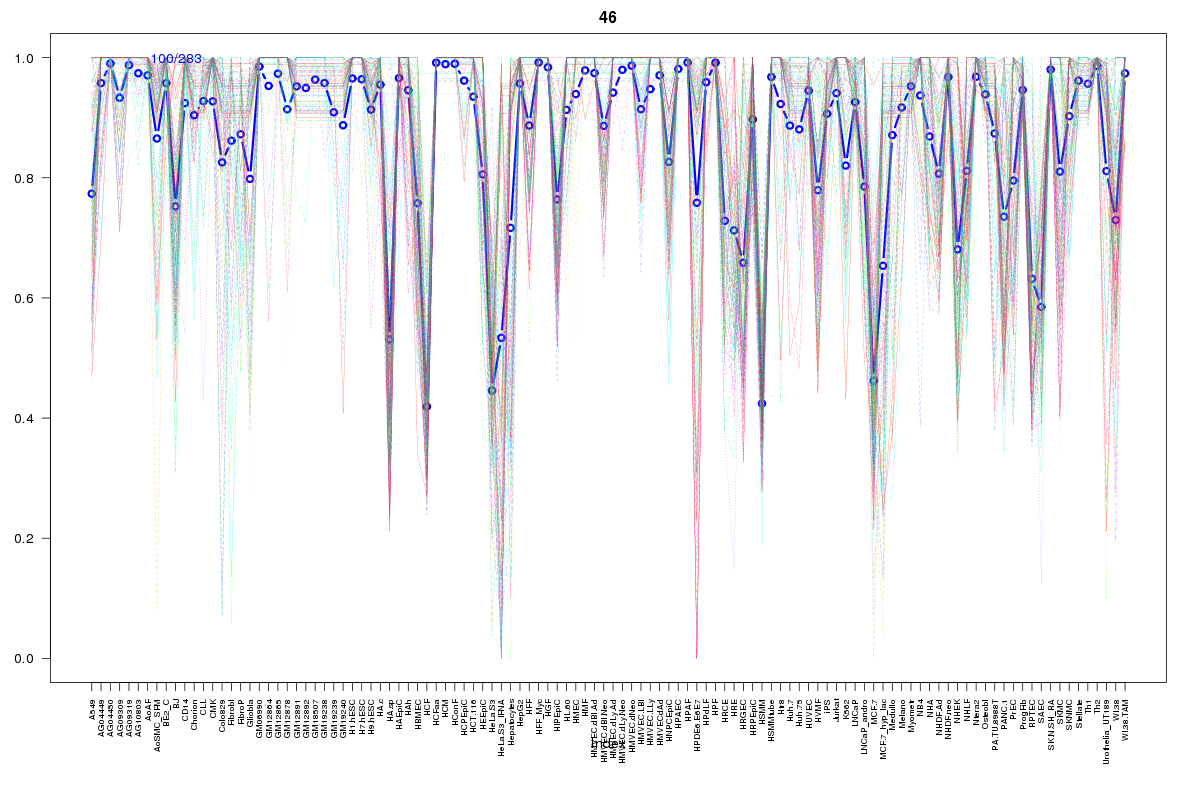 | 46 | 1 |
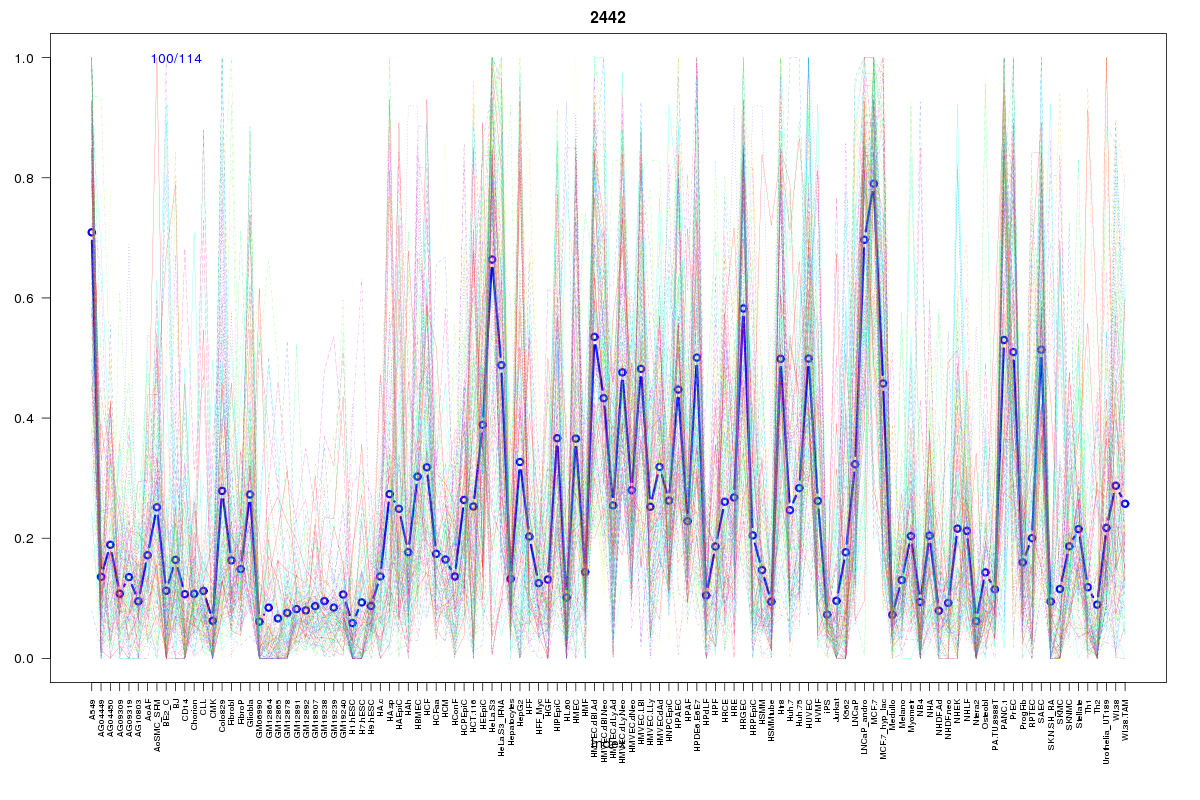 | 2442 | 1 |
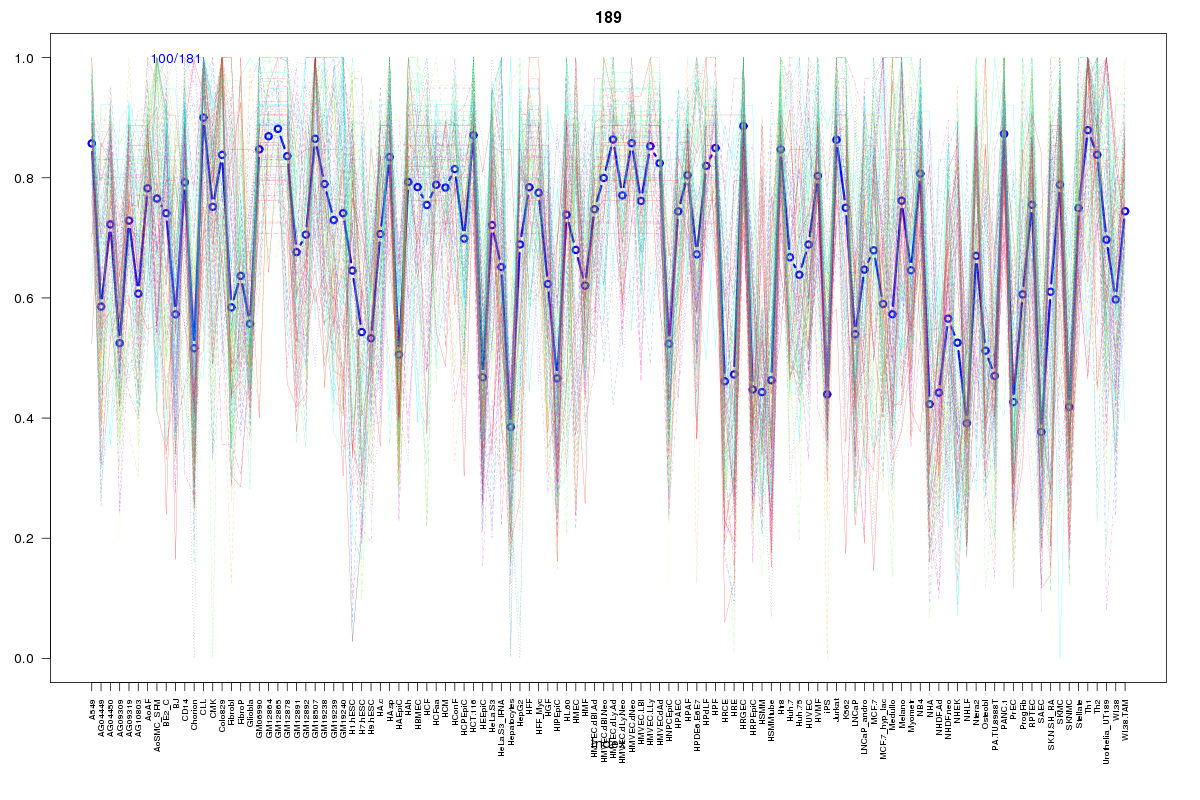 | 189 | 1 |
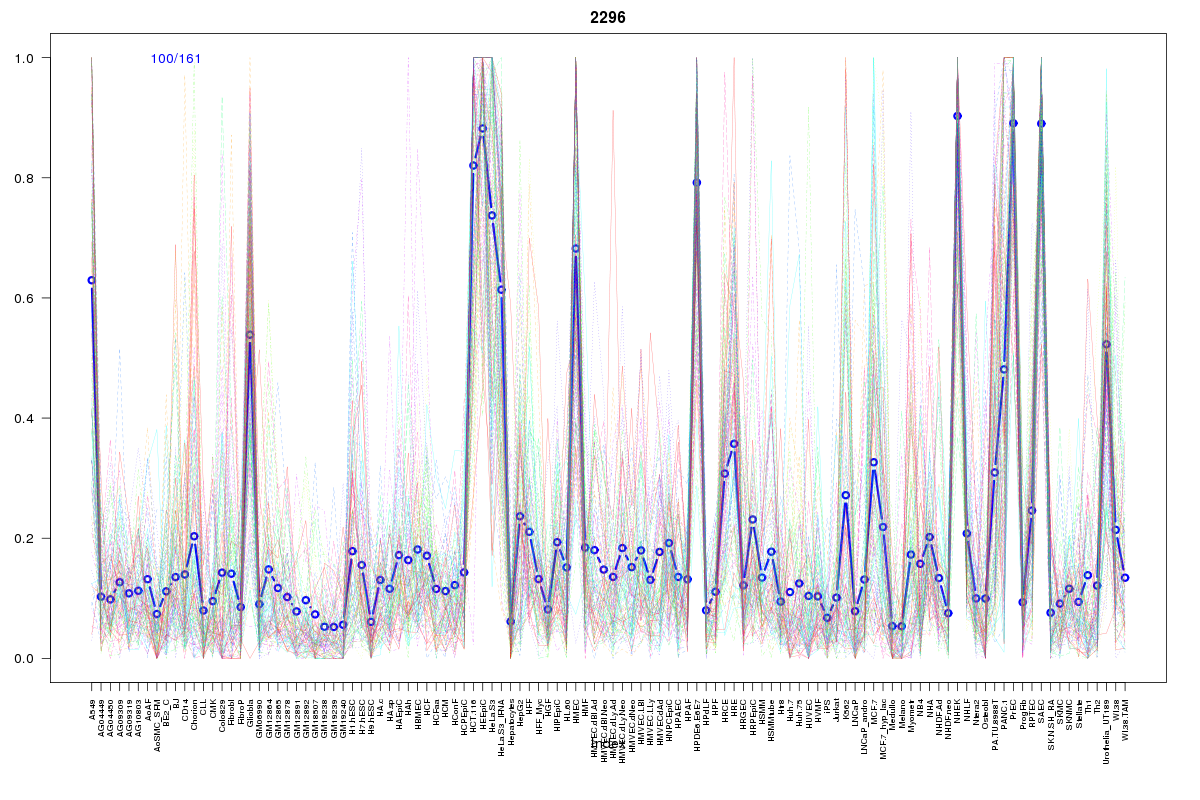 | 2296 | 1 |
 | 134 | 1 |
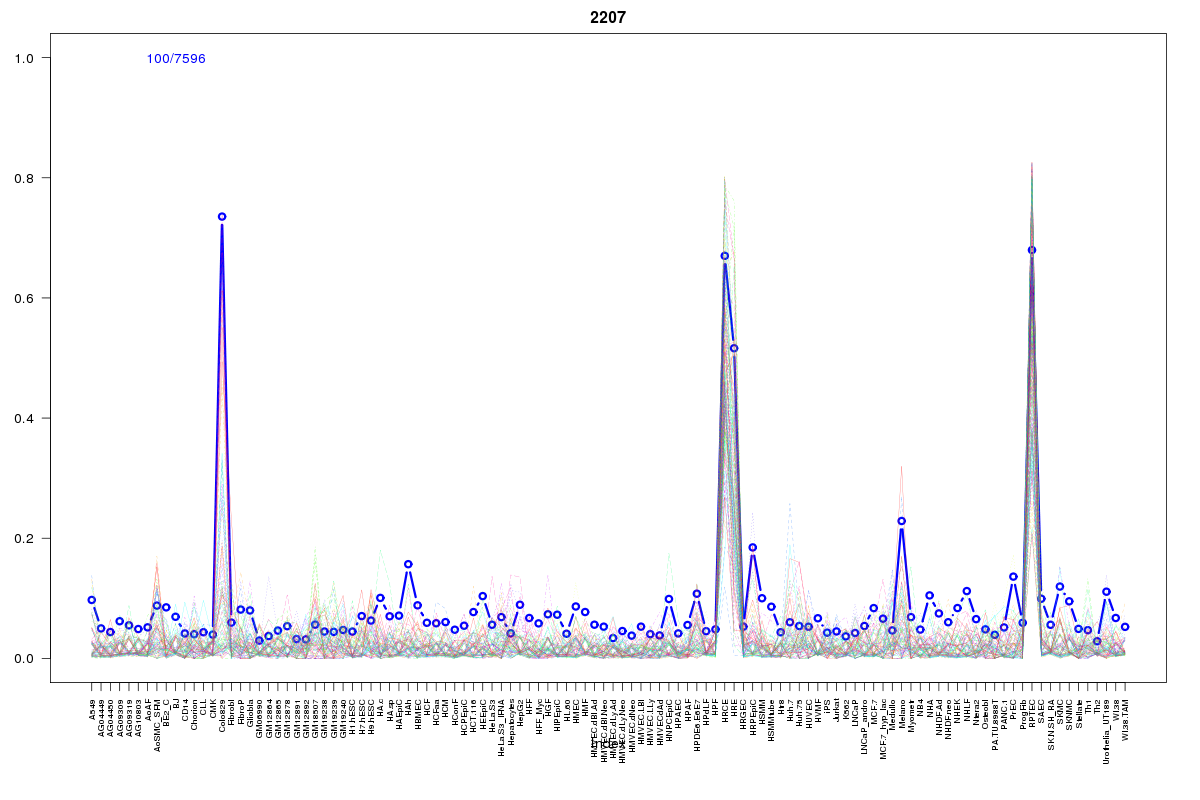 | 2207 | 1 |
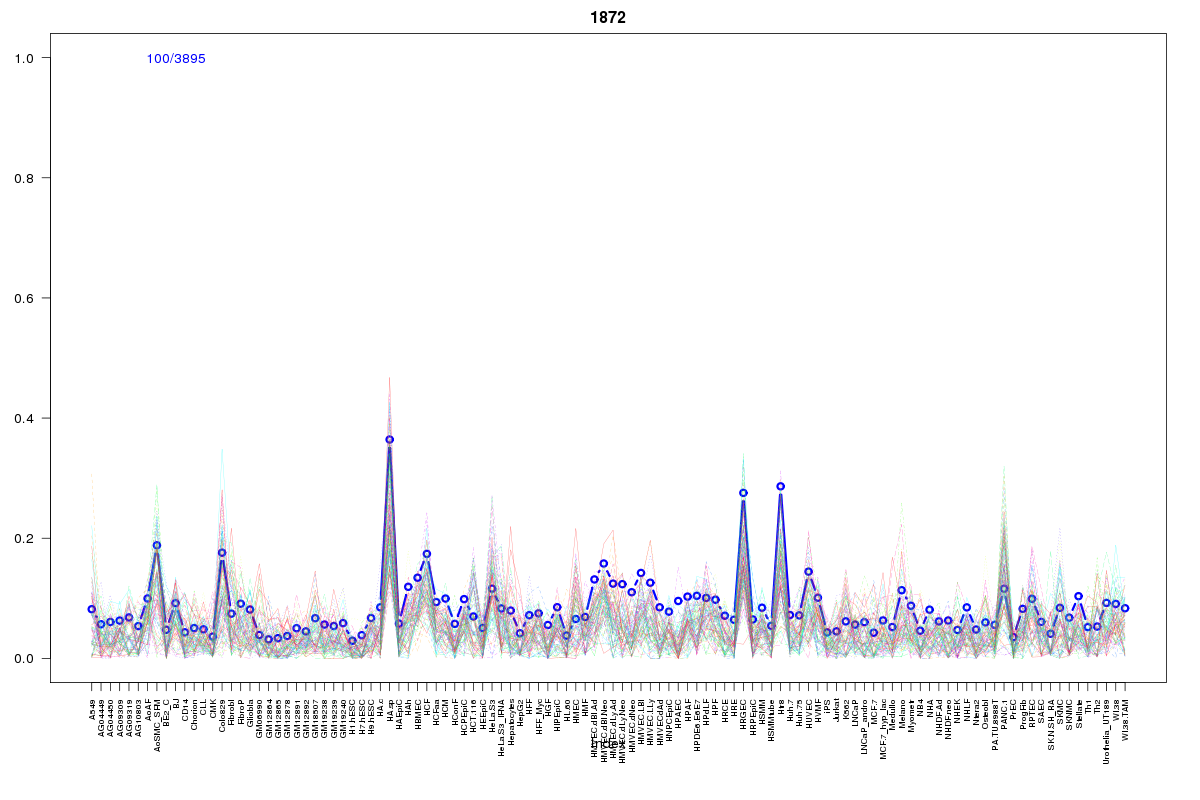 | 1872 | 1 |
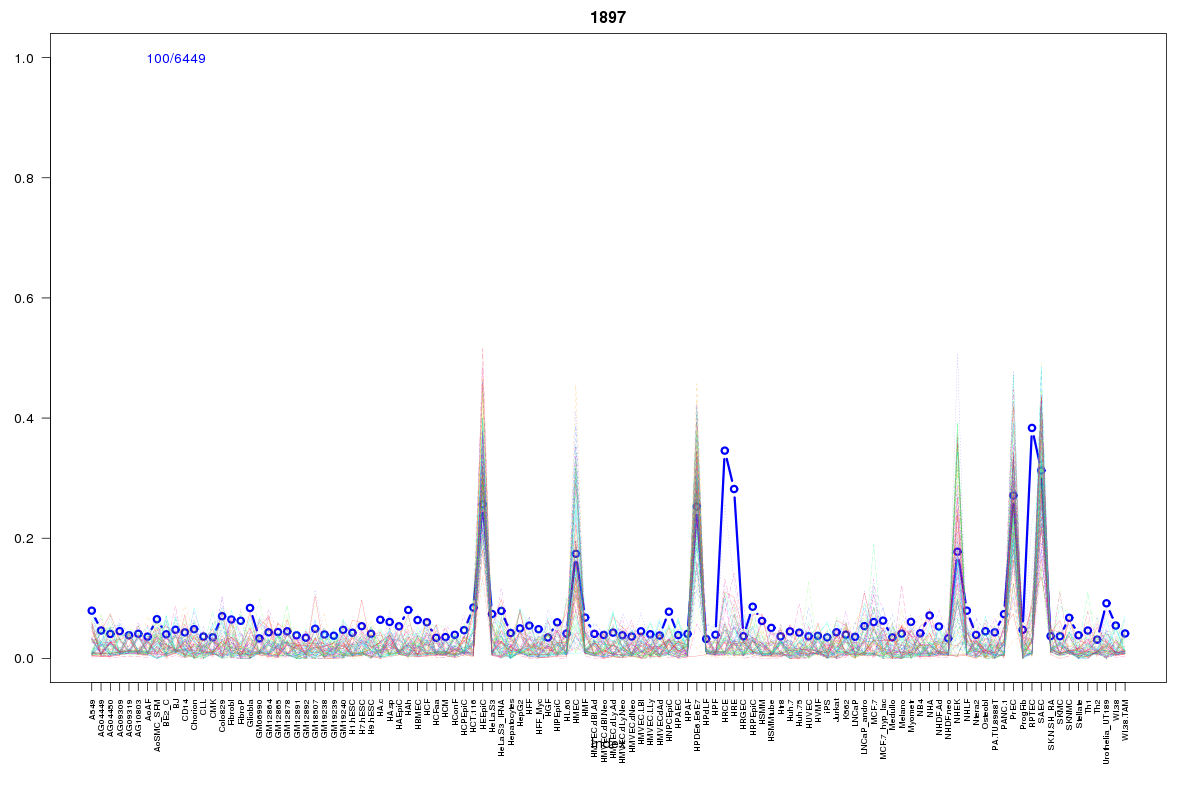 | 1897 | 1 |
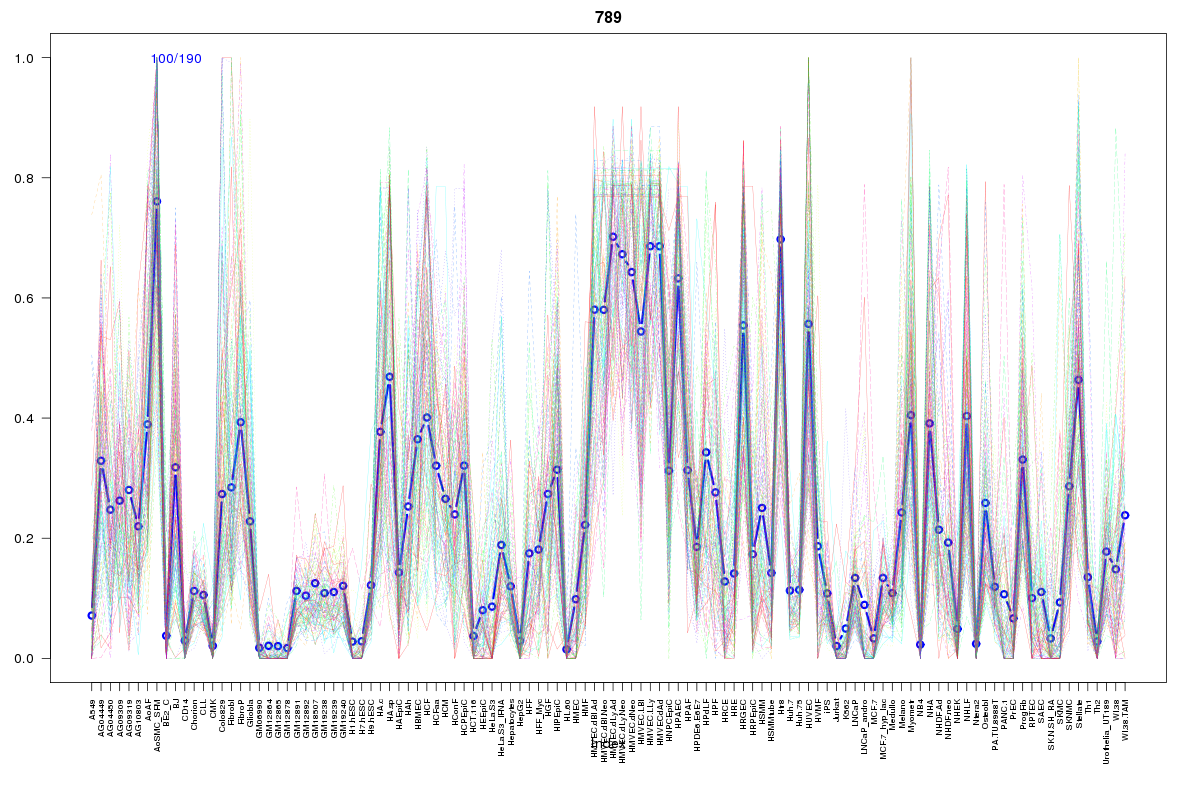 | 789 | 1 |
 | 251 | 1 |
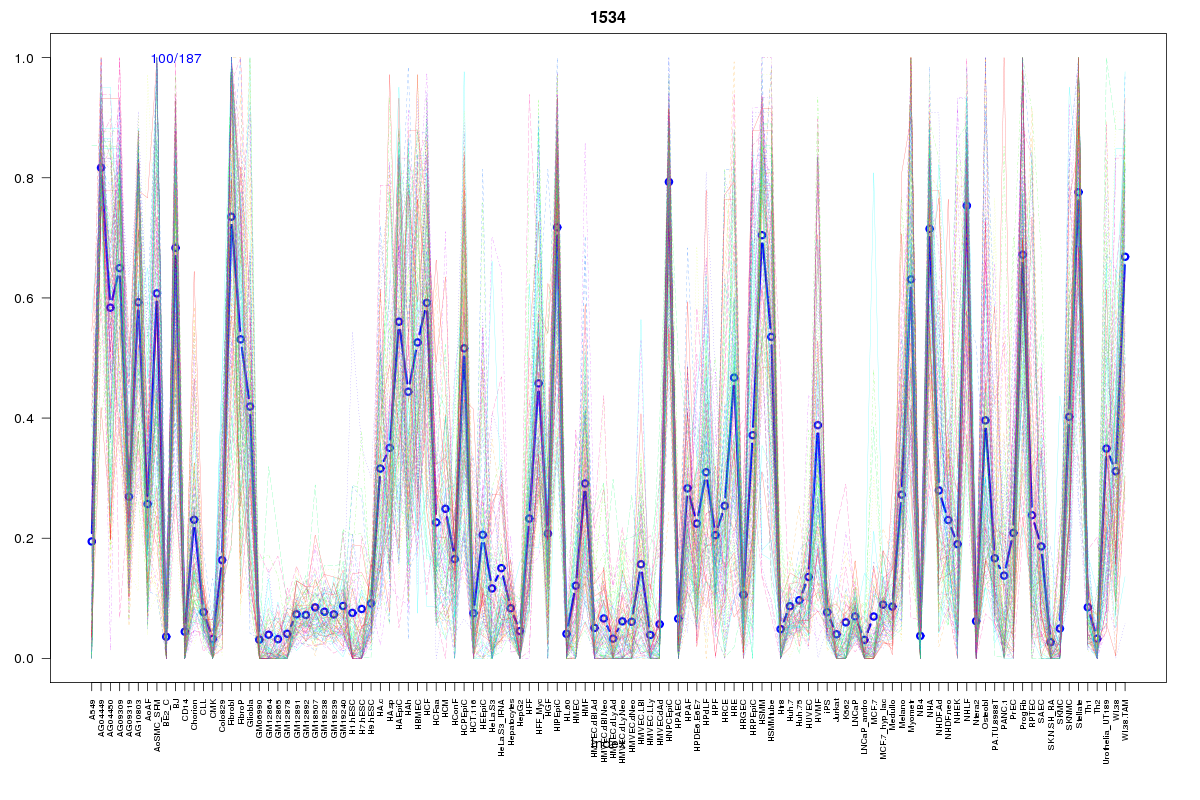 | 1534 | 1 |
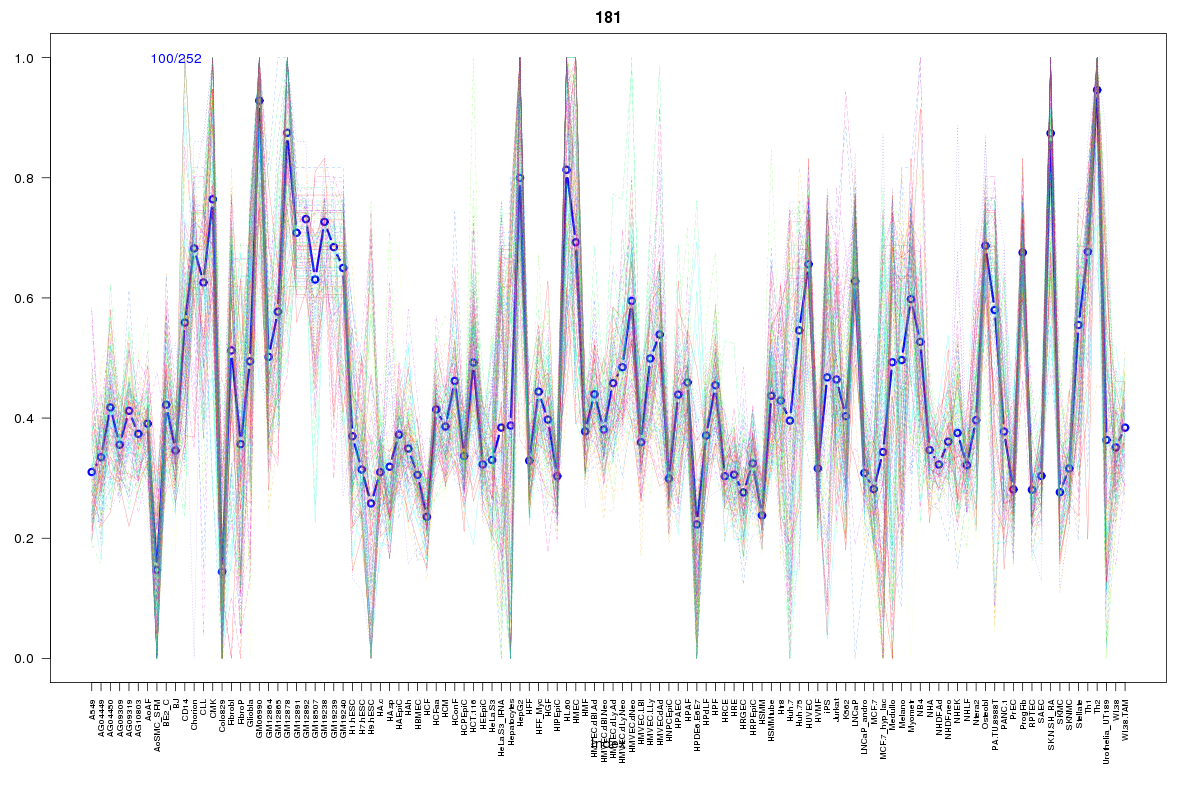 | 181 | 1 |
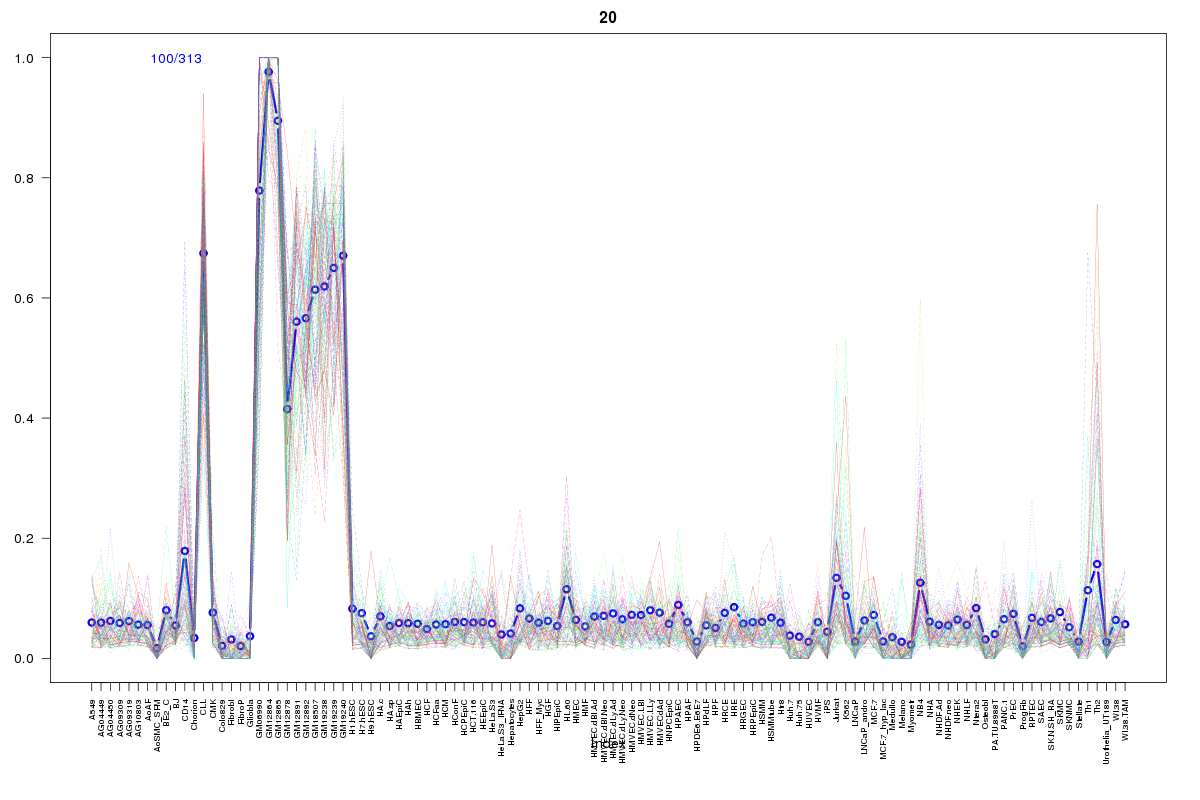 | 20 | 1 |
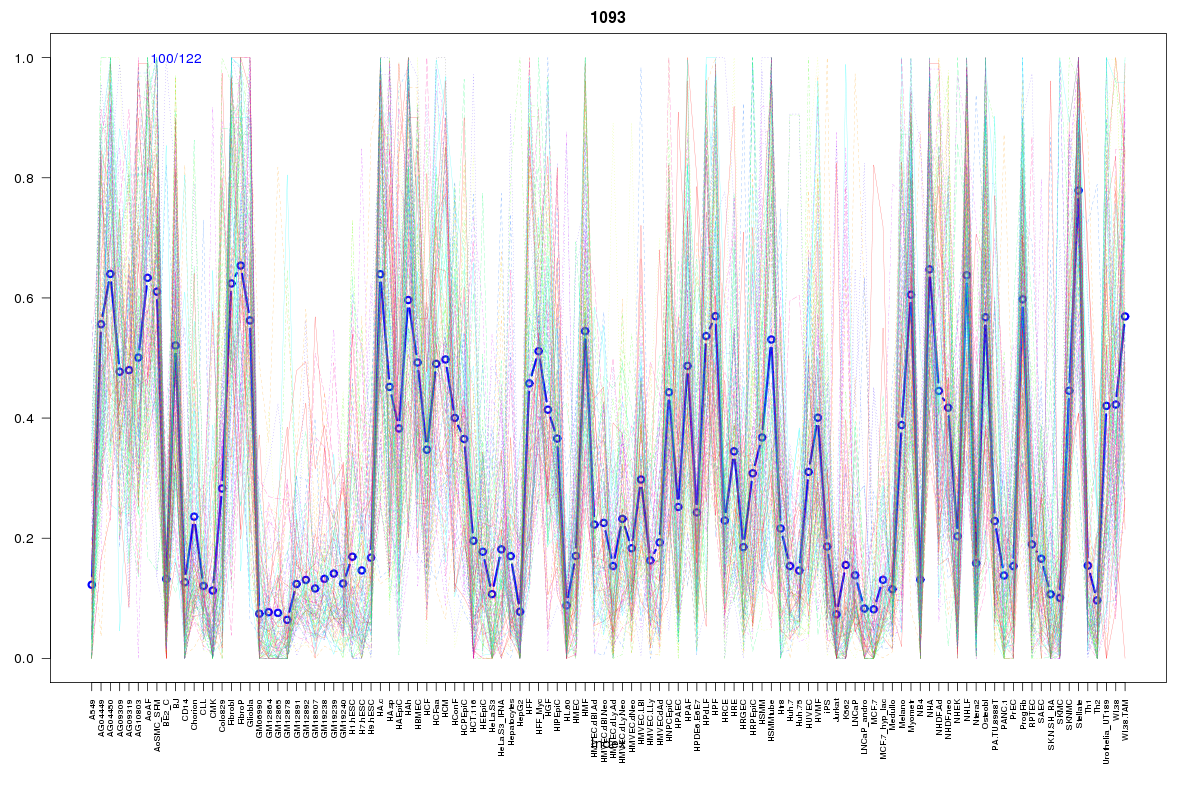 | 1093 | 1 |
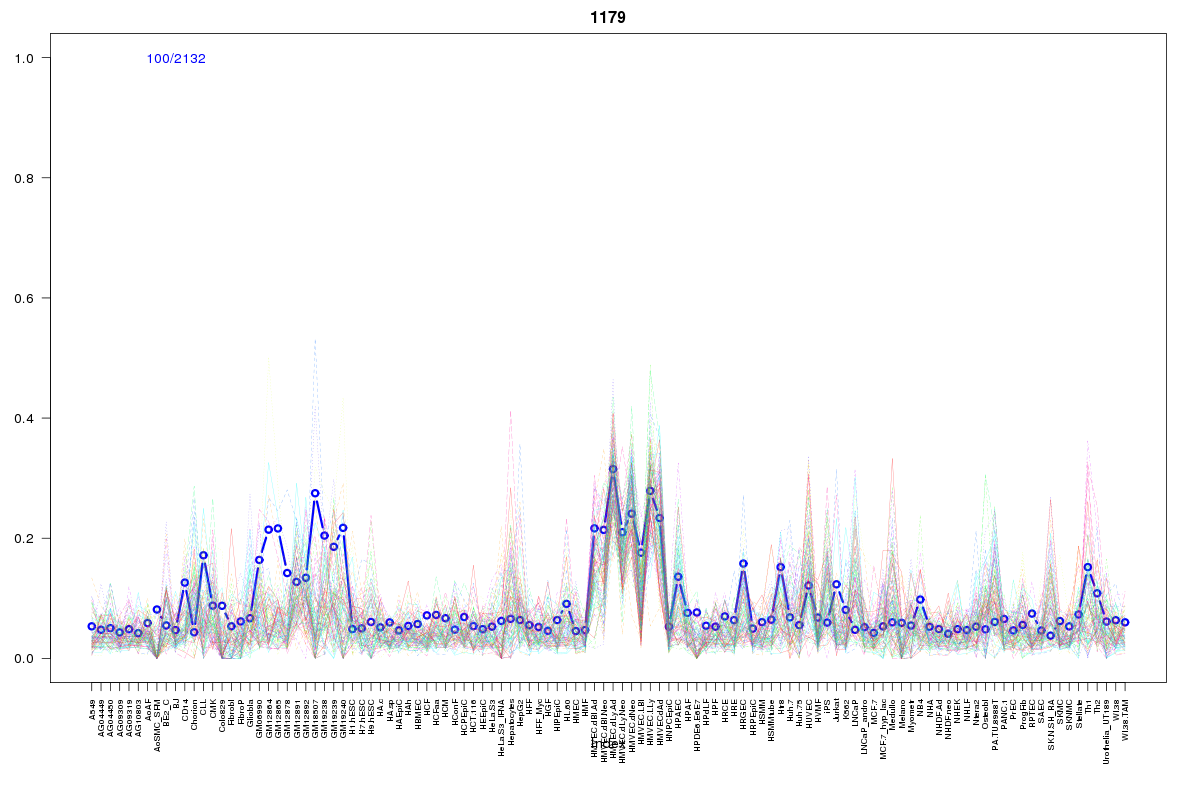 | 1179 | 1 |
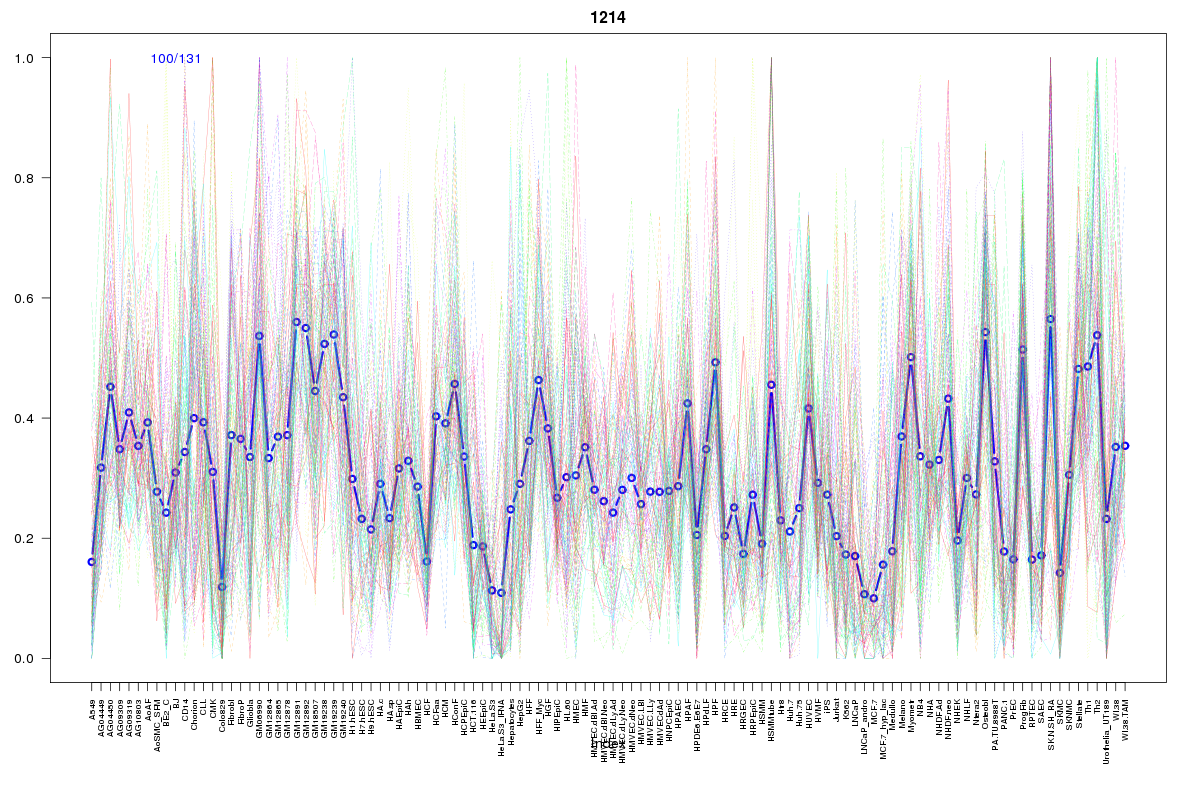 | 1214 | 1 |
Resources
BED file downloads
Connects to 34 DHS sitesTop 10 Correlated DHS Sites
p-values indiciate significant higher or lower correlation| Location | Cluster | P-value |
|---|---|---|
| chr1:46649320-46649470 | 2296 | 0 |
| chr1:46645740-46645890 | 1976 | 0.001 |
| chr1:46684260-46684410 | 2298 | 0.002 |
| chr1:46647180-46647330 | 2300 | 0.003 |
| chr1:46684505-46684655 | 1605 | 0.005 |
| chr1:46656245-46656395 | 1897 | 0.005 |
| chr1:46689445-46689595 | 1559 | 0.005 |
| chr1:46646945-46647095 | 2042 | 0.005 |
| chr1:46646040-46646190 | 2194 | 0.005 |
| chr1:46543480-46543630 | 2146 | 0.005 |
| chr1:46594120-46594270 | 928 | 0.005 |
External Databases
UCSCEnsembl (ENSG00000117472)