Gene: ETV3
chr1: 157090982-157108159Expression Profile
(log scale)
Graphical Connections
Distribution of linked clusters:
You may find it interesting if many of the connected DHS sites belong to the same cluster.| Cluster Profile | Cluster ID | Number of DHS sites in this cluster |
|---|---|---|
 | 1755 | 4 |
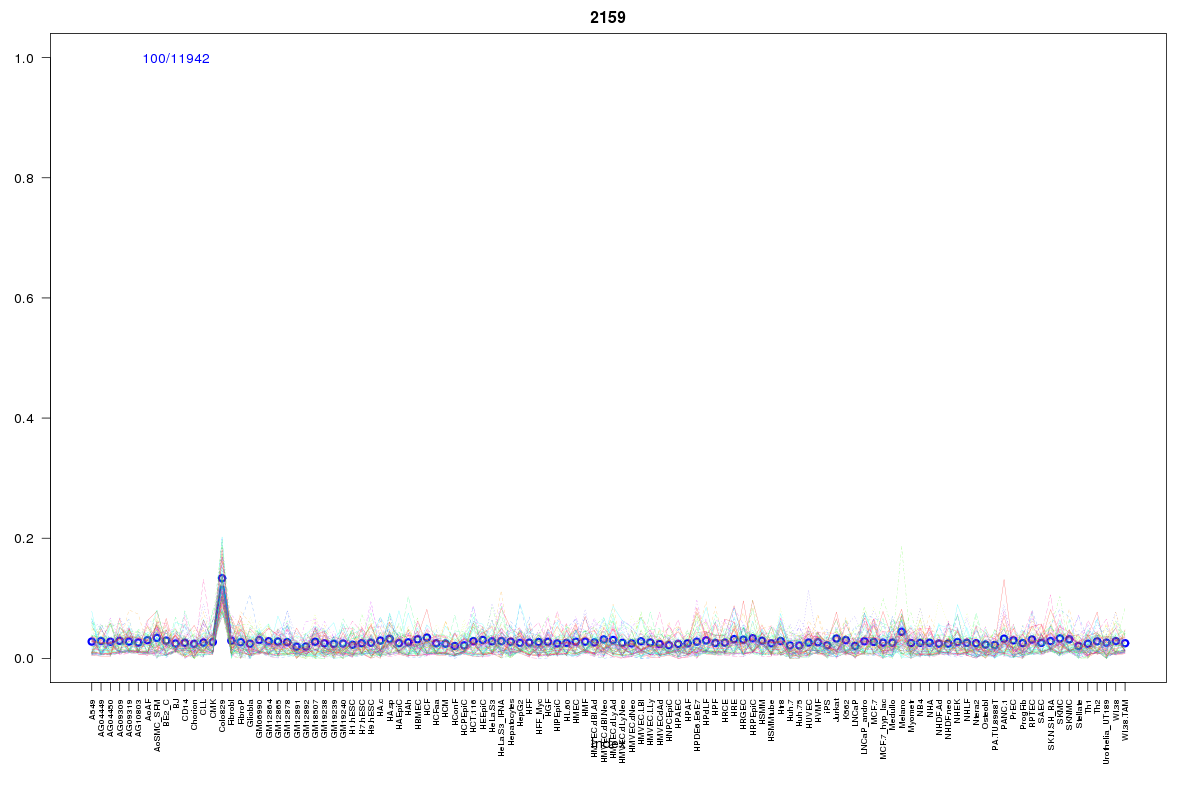 | 2159 | 2 |
 | 416 | 2 |
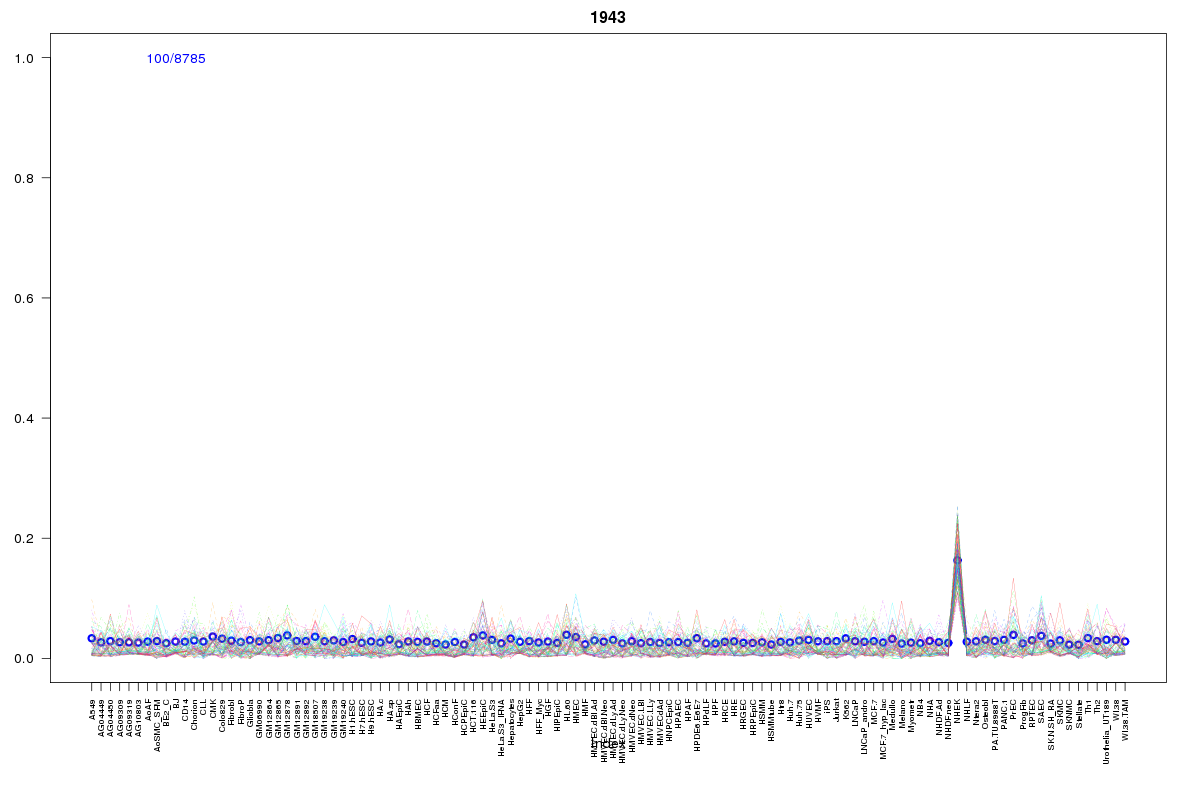 | 1943 | 1 |
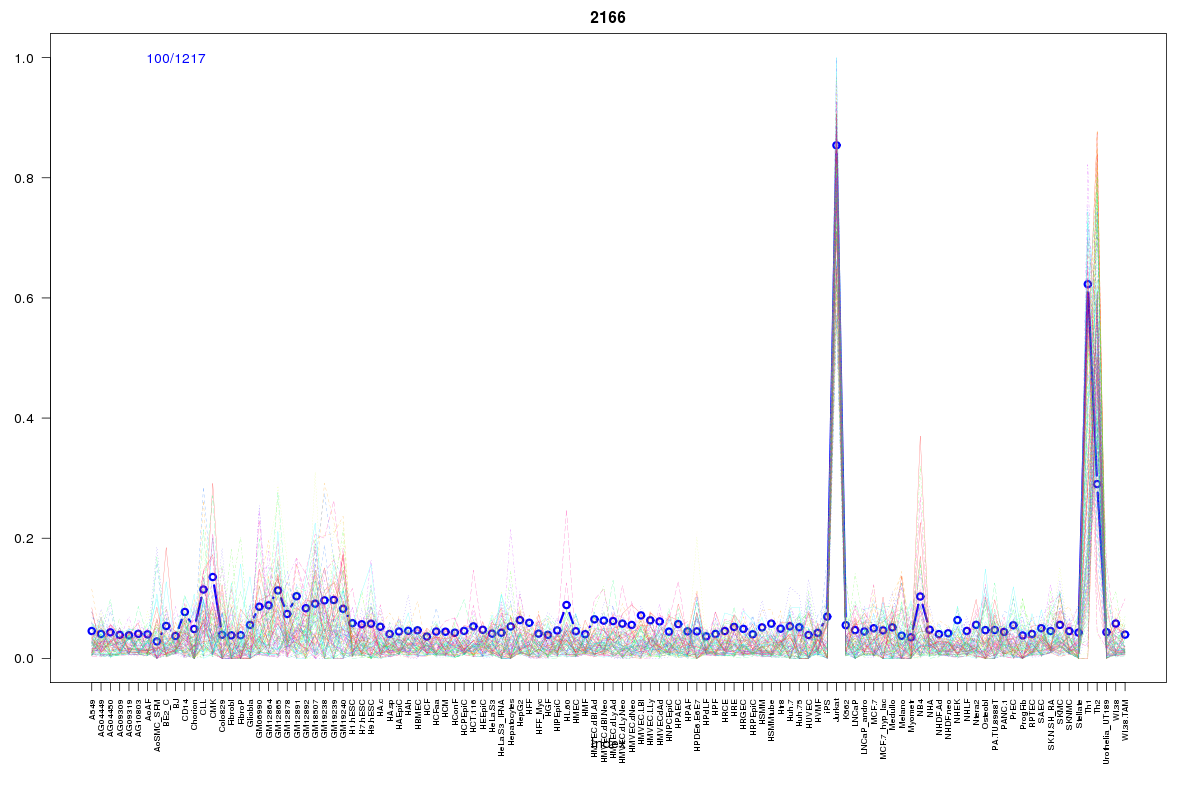 | 2166 | 1 |
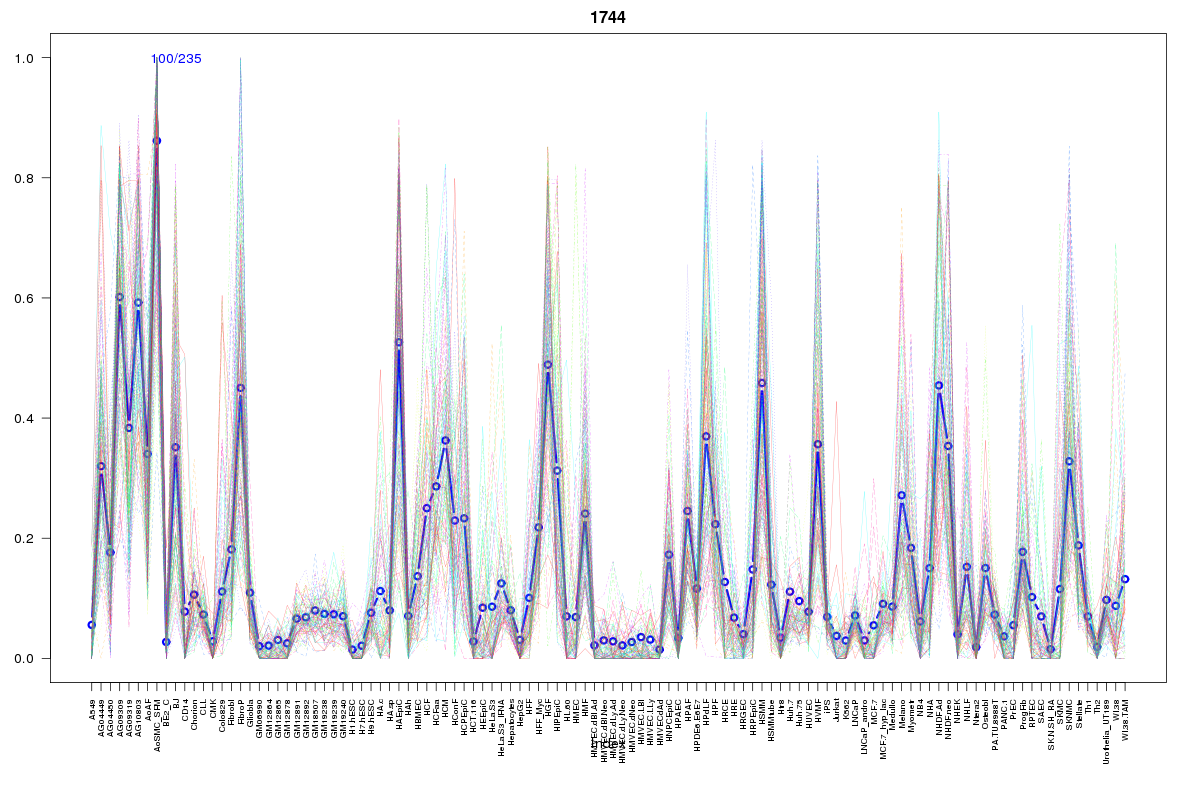 | 1744 | 1 |
 | 2072 | 1 |
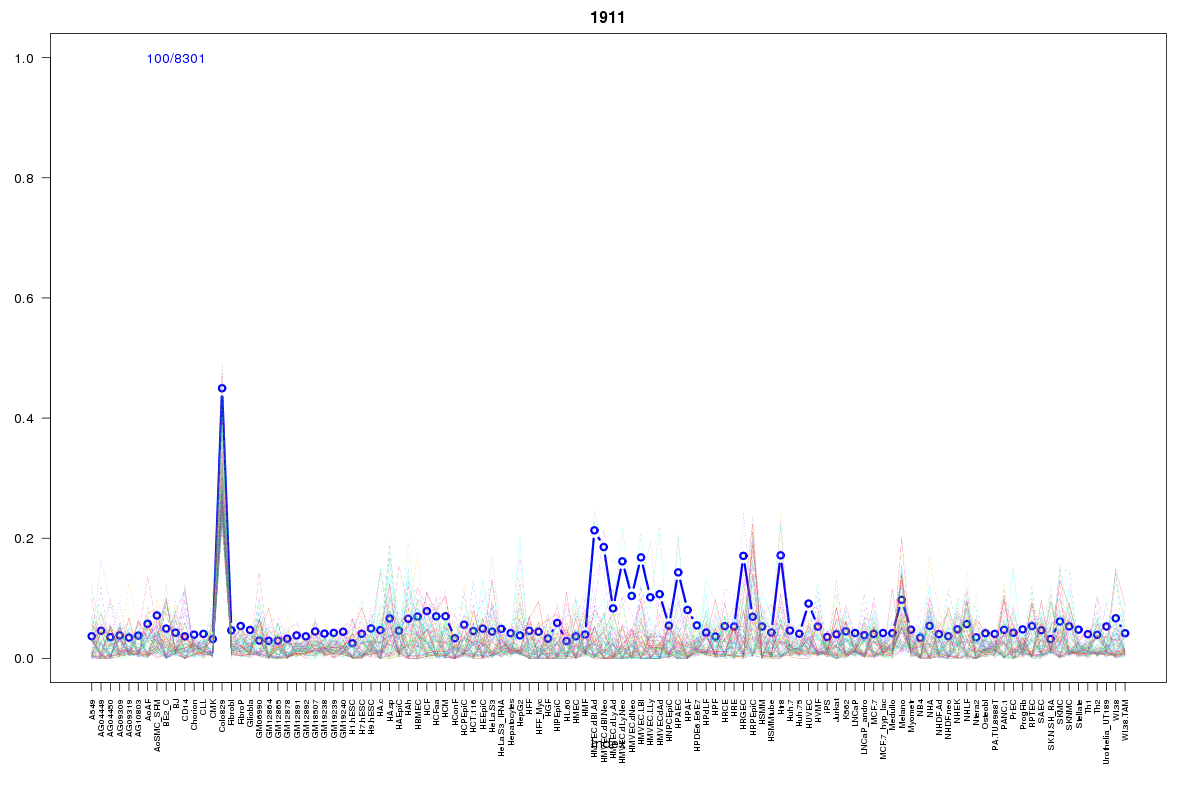 | 1911 | 1 |
 | 1605 | 1 |
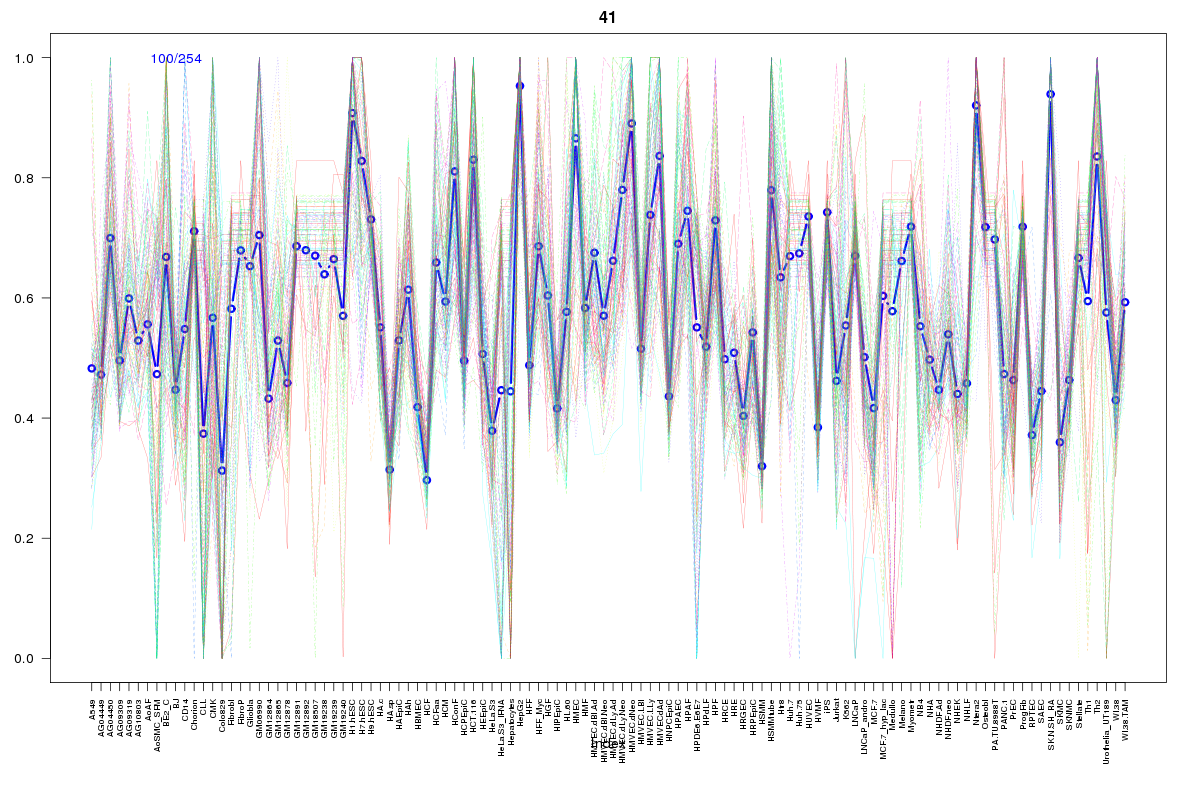 | 41 | 1 |
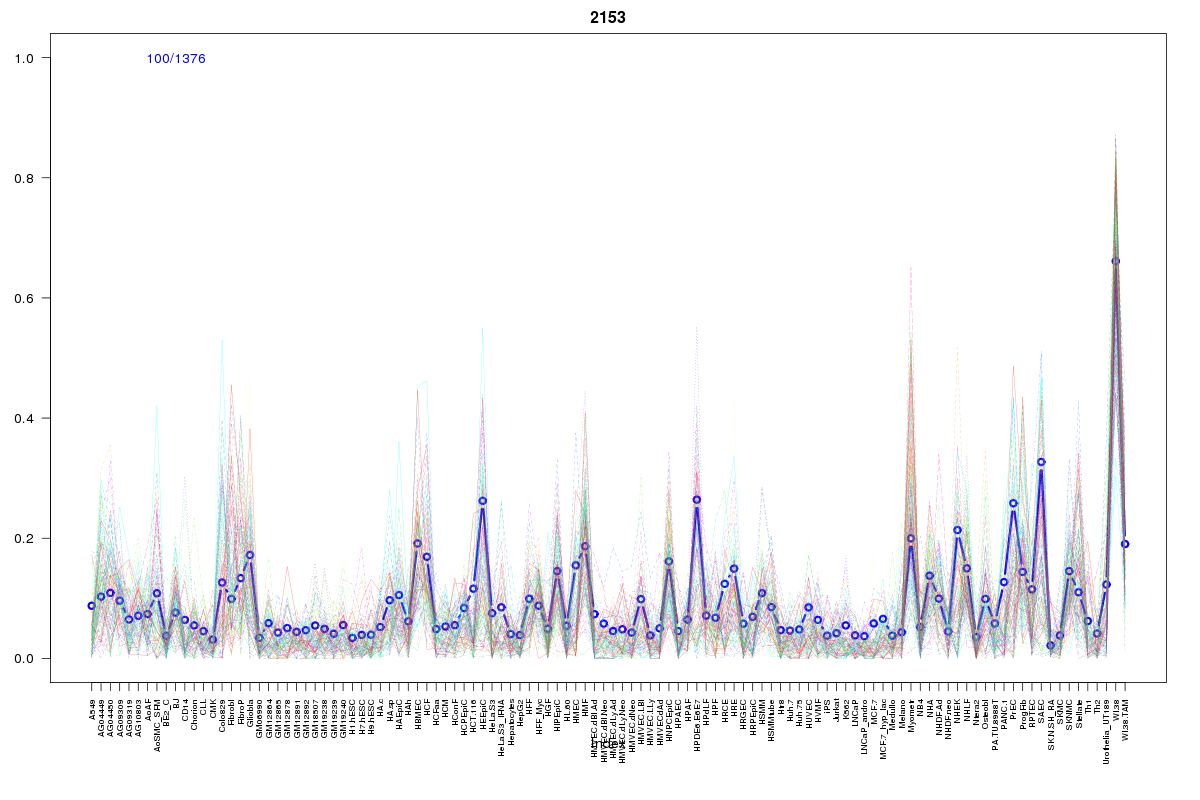 | 2153 | 1 |
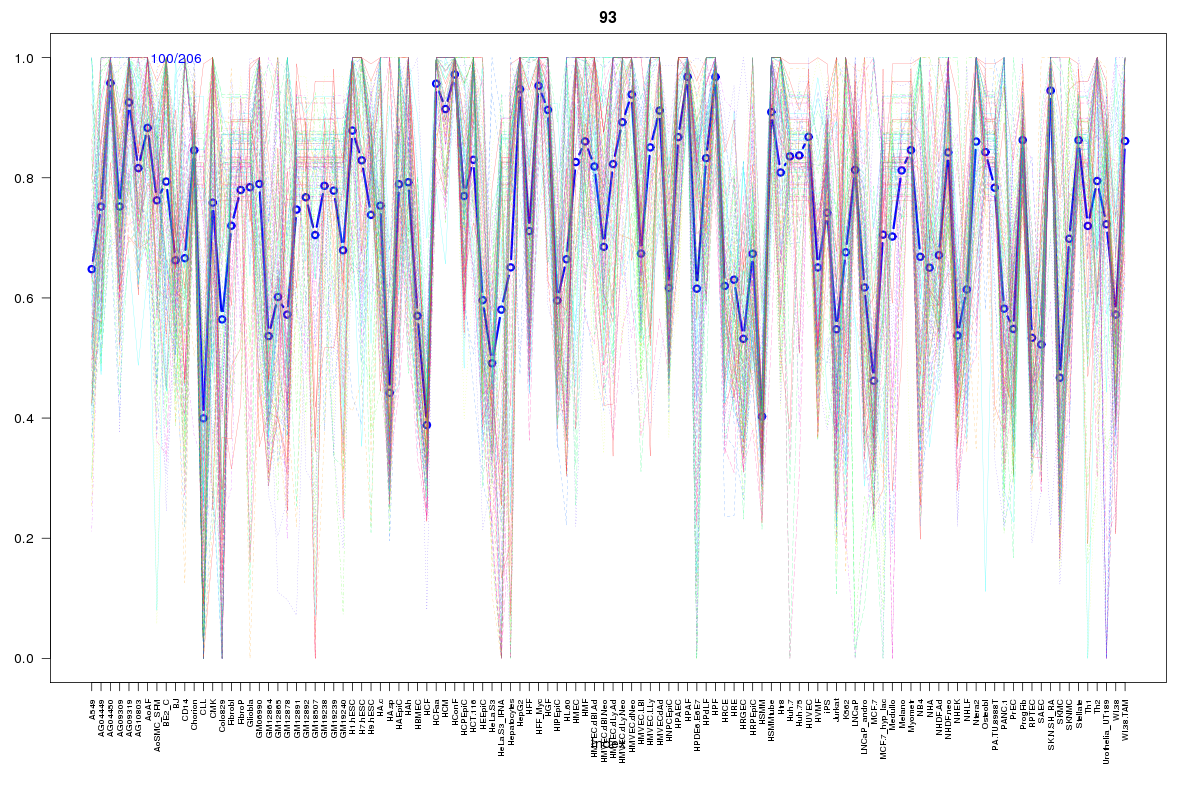 | 93 | 1 |
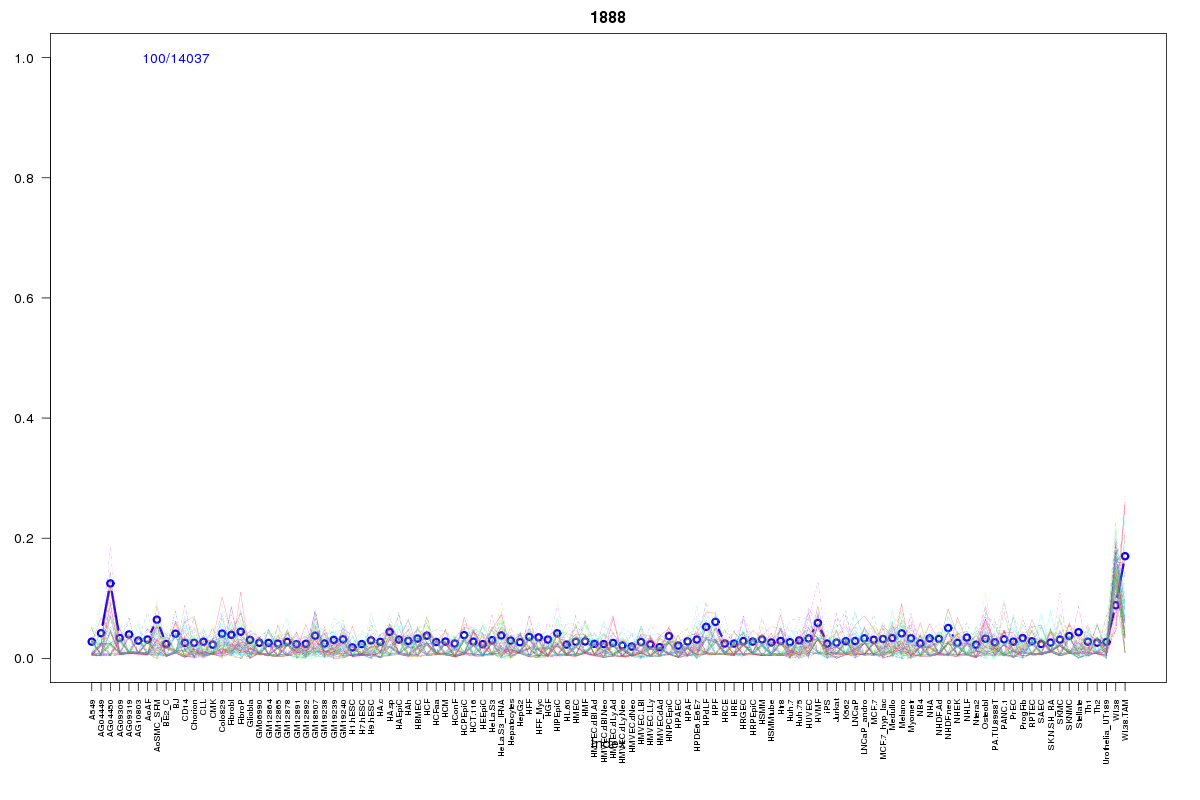 | 1888 | 1 |
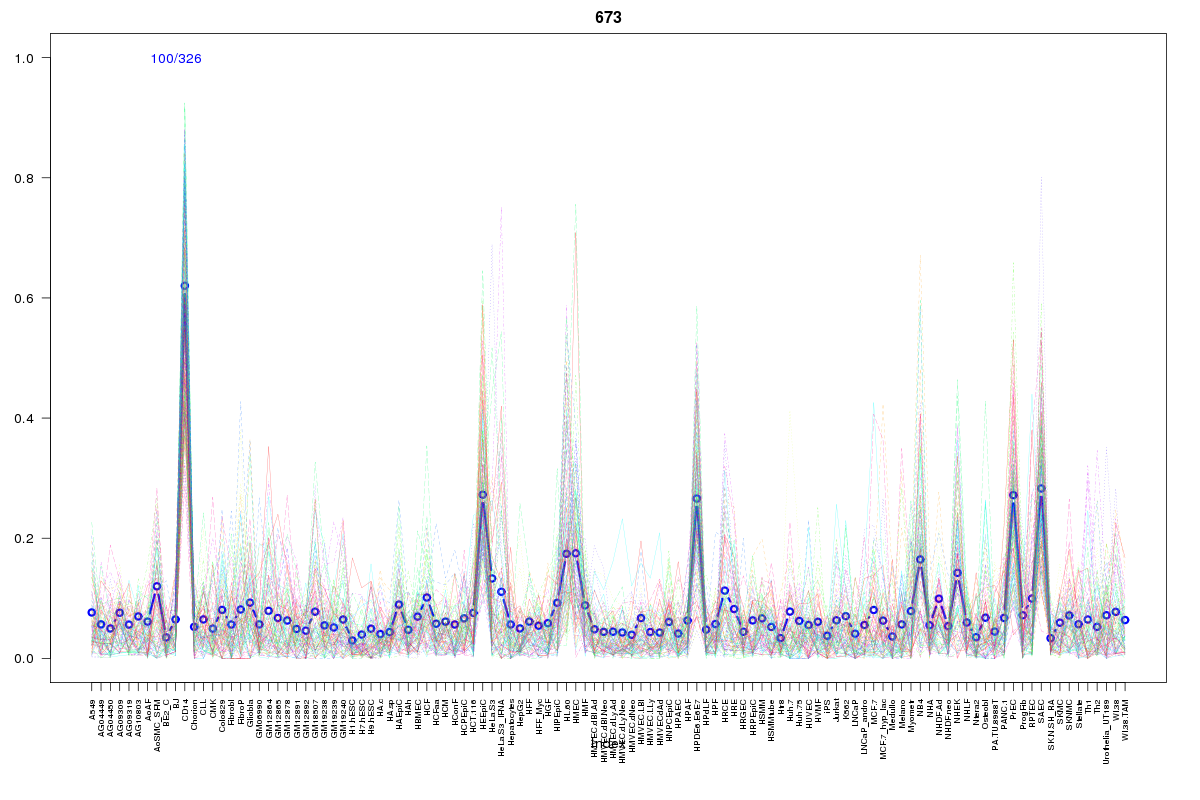 | 673 | 1 |
 | 2205 | 1 |
 | 626 | 1 |
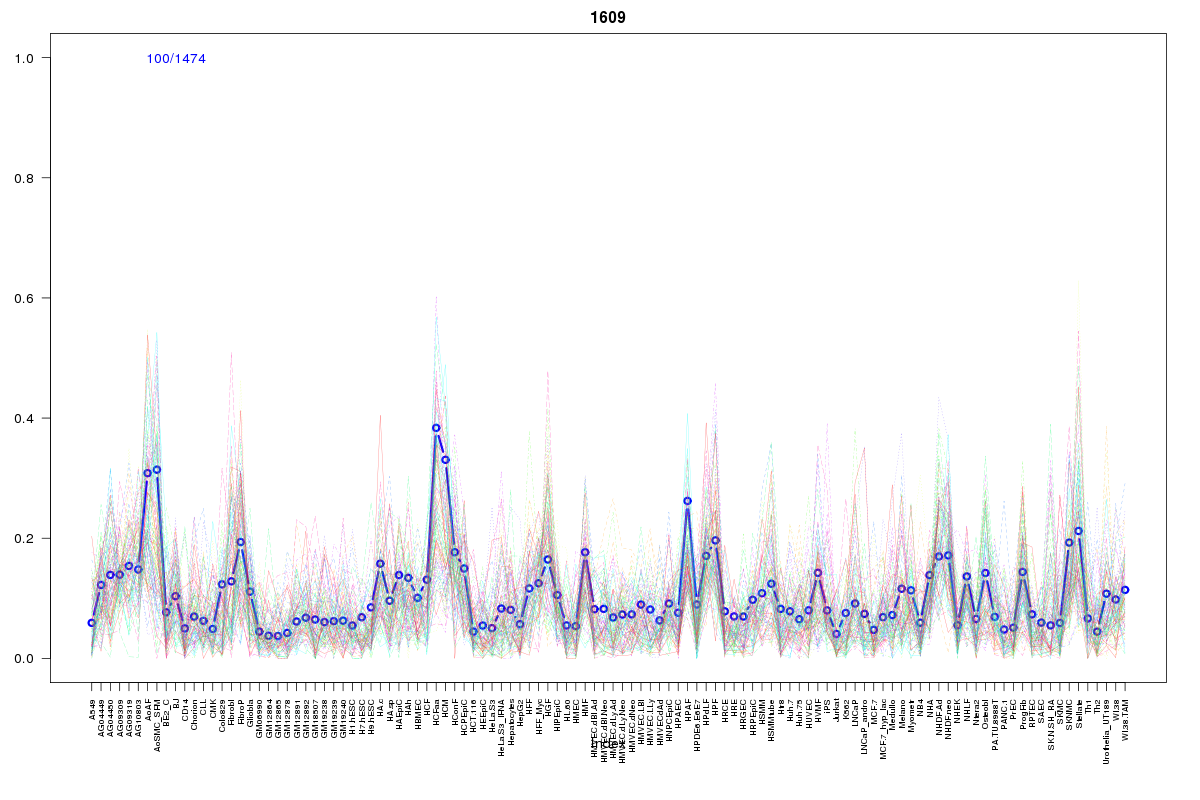 | 1609 | 1 |
 | 510 | 1 |
 | 2055 | 1 |
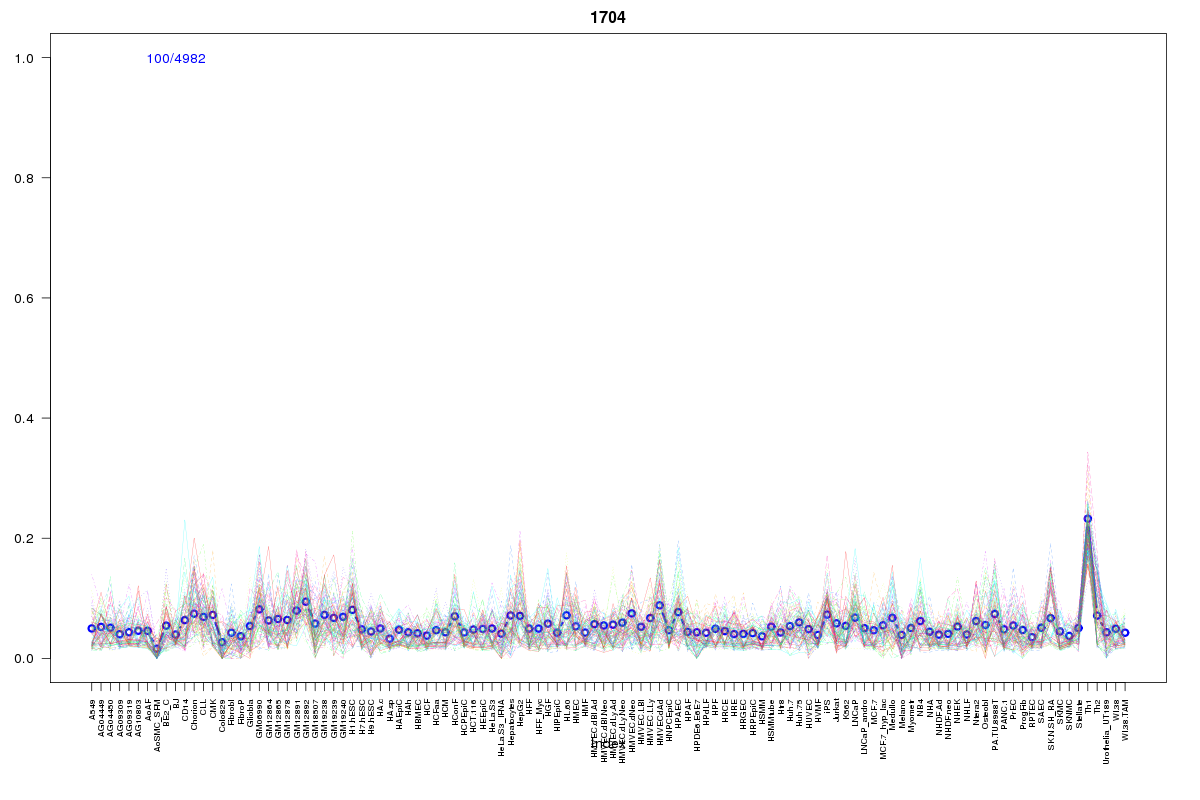 | 1704 | 1 |
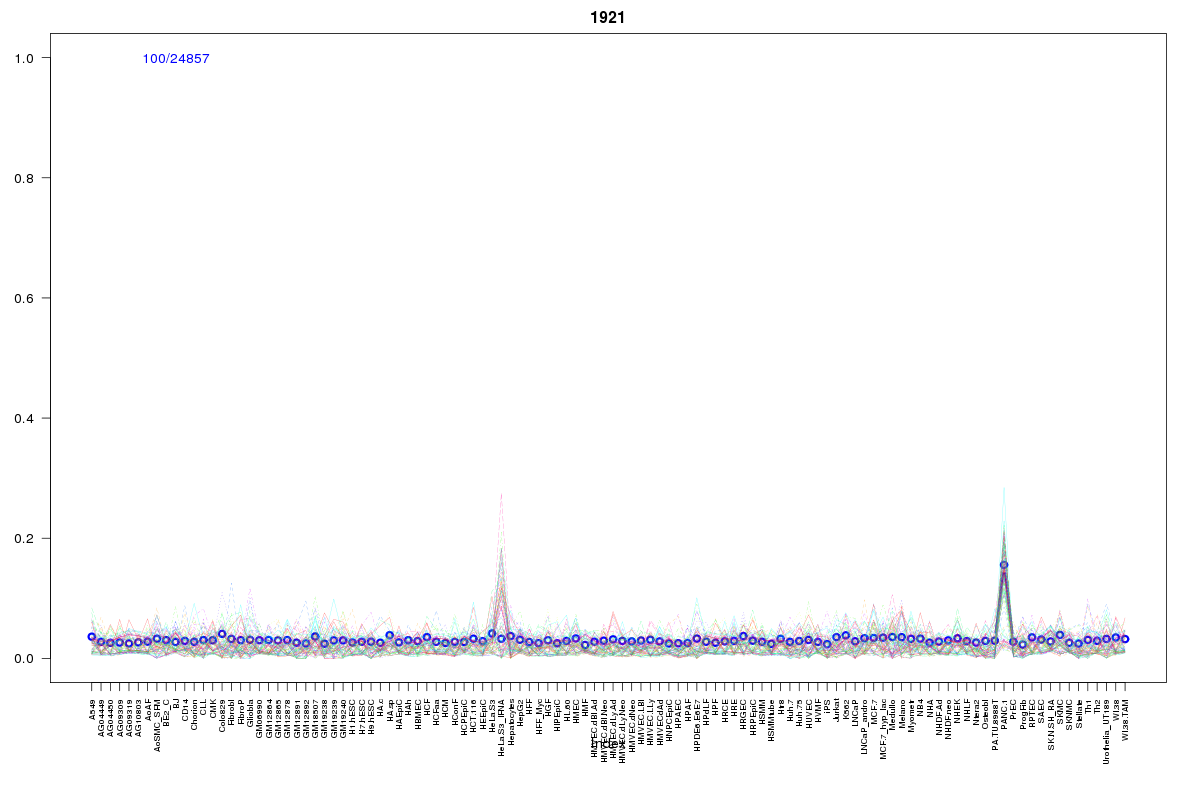 | 1921 | 1 |
 | 655 | 1 |
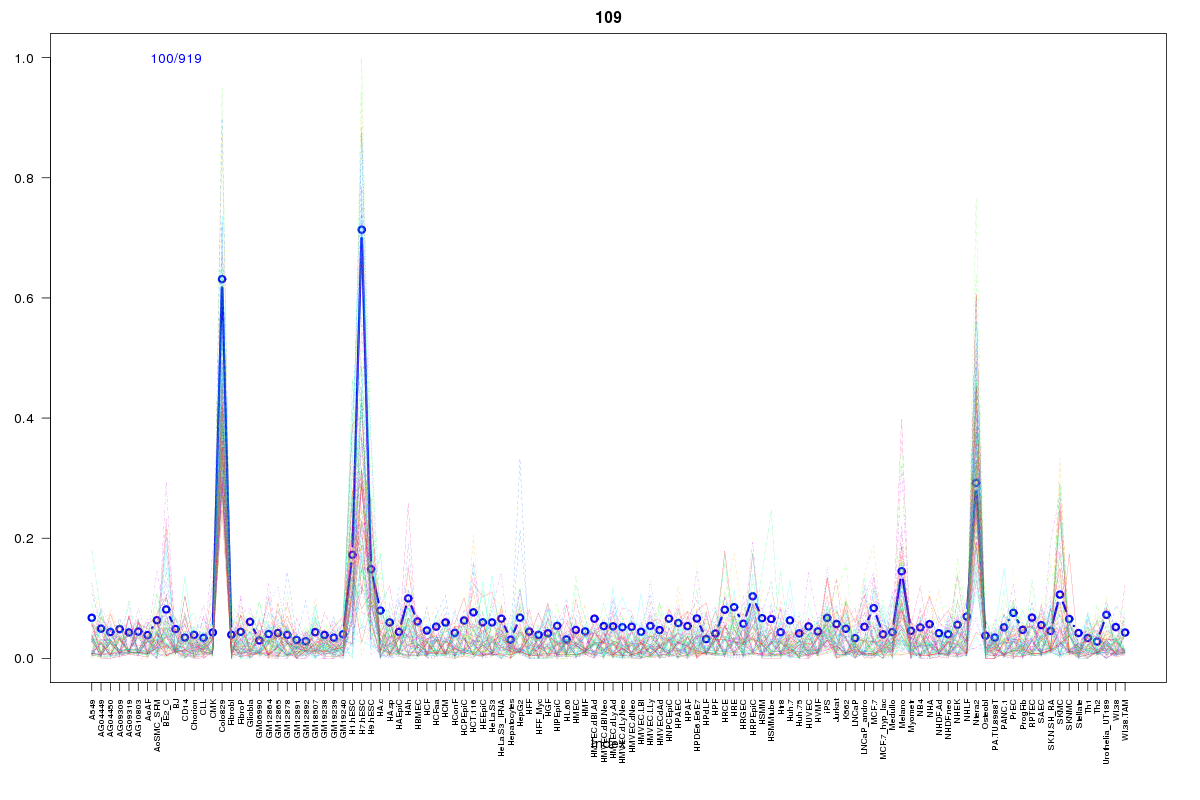 | 109 | 1 |
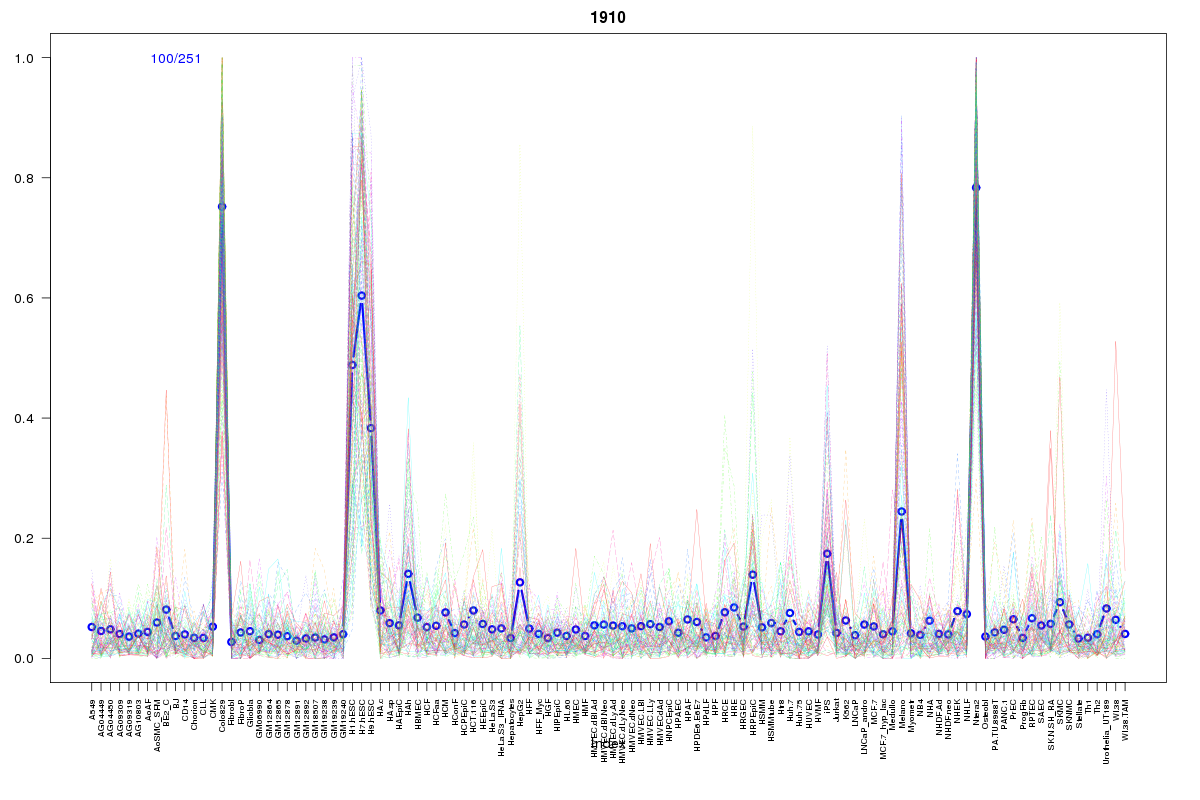 | 1910 | 1 |
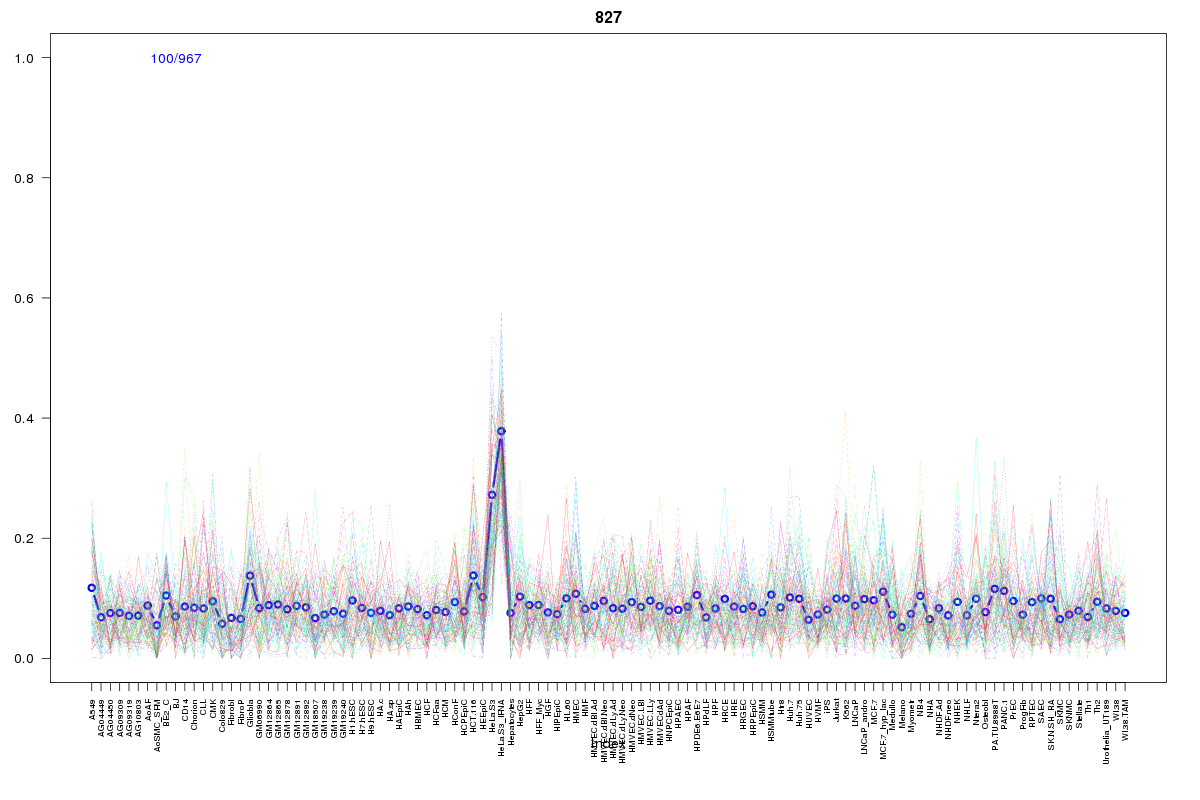 | 827 | 1 |
Resources
BED file downloads
Connects to 30 DHS sitesTop 10 Correlated DHS Sites
p-values indiciate significant higher or lower correlation| Location | Cluster | P-value |
|---|---|---|
| chr1:157109880-157110030 | 2072 | 0 |
| chr1:157086605-157086755 | 1755 | 0.001 |
| chr1:157110600-157110750 | 2159 | 0.002 |
| chr1:157065425-157065575 | 1704 | 0.002 |
| chr1:157117720-157117870 | 673 | 0.003 |
| chr1:157172565-157172715 | 1921 | 0.003 |
| chr1:157167605-157167755 | 2055 | 0.003 |
| chr1:157060725-157060875 | 2205 | 0.005 |
| chr1:157020745-157020895 | 2159 | 0.006 |
| chr1:157068945-157069095 | 1755 | 0.01 |
| chr1:157122620-157122770 | 626 | 0.012 |
External Databases
UCSCEnsembl (ENSG00000117036)