Gene: TCEANC2
chr1: 54519259-54578192Expression Profile
(log scale)
Graphical Connections
Distribution of linked clusters:
You may find it interesting if many of the connected DHS sites belong to the same cluster.| Cluster Profile | Cluster ID | Number of DHS sites in this cluster |
|---|---|---|
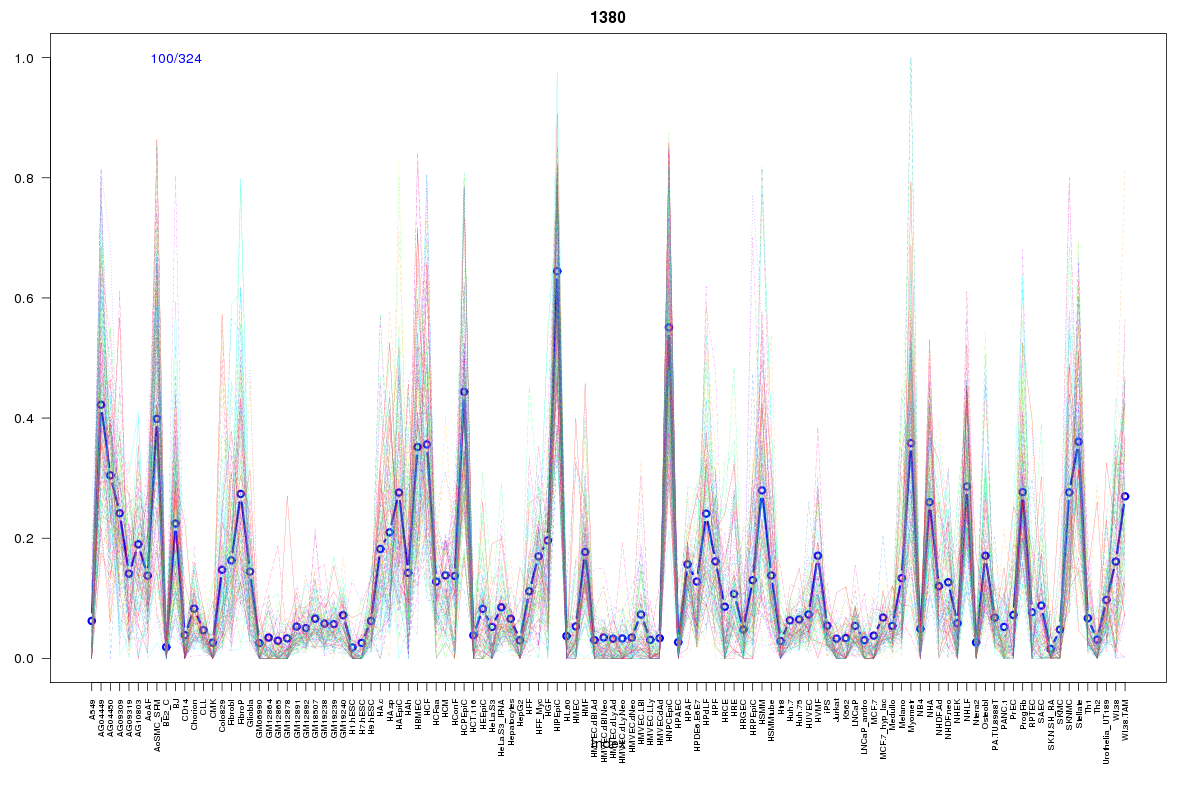 | 1380 | 1 |
 | 2072 | 1 |
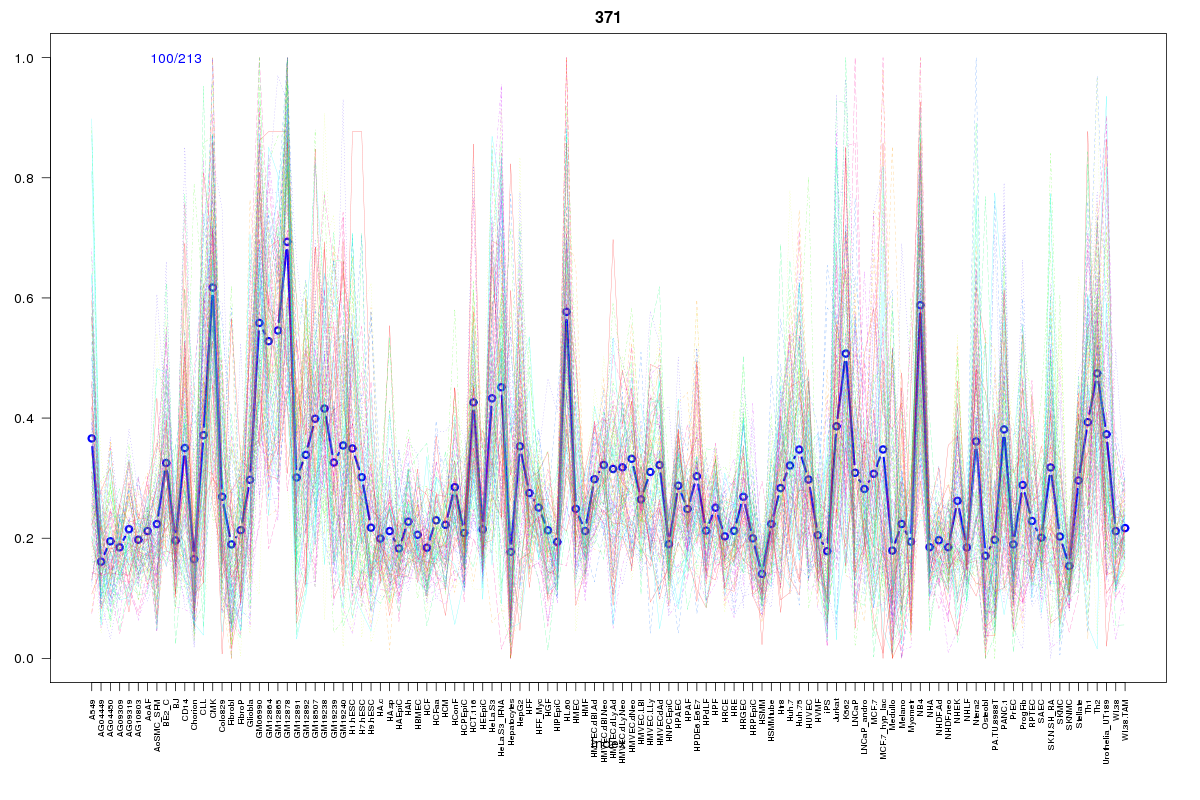 | 371 | 1 |
 | 1404 | 1 |
 | 1008 | 1 |
 | 1095 | 1 |
 | 2055 | 1 |
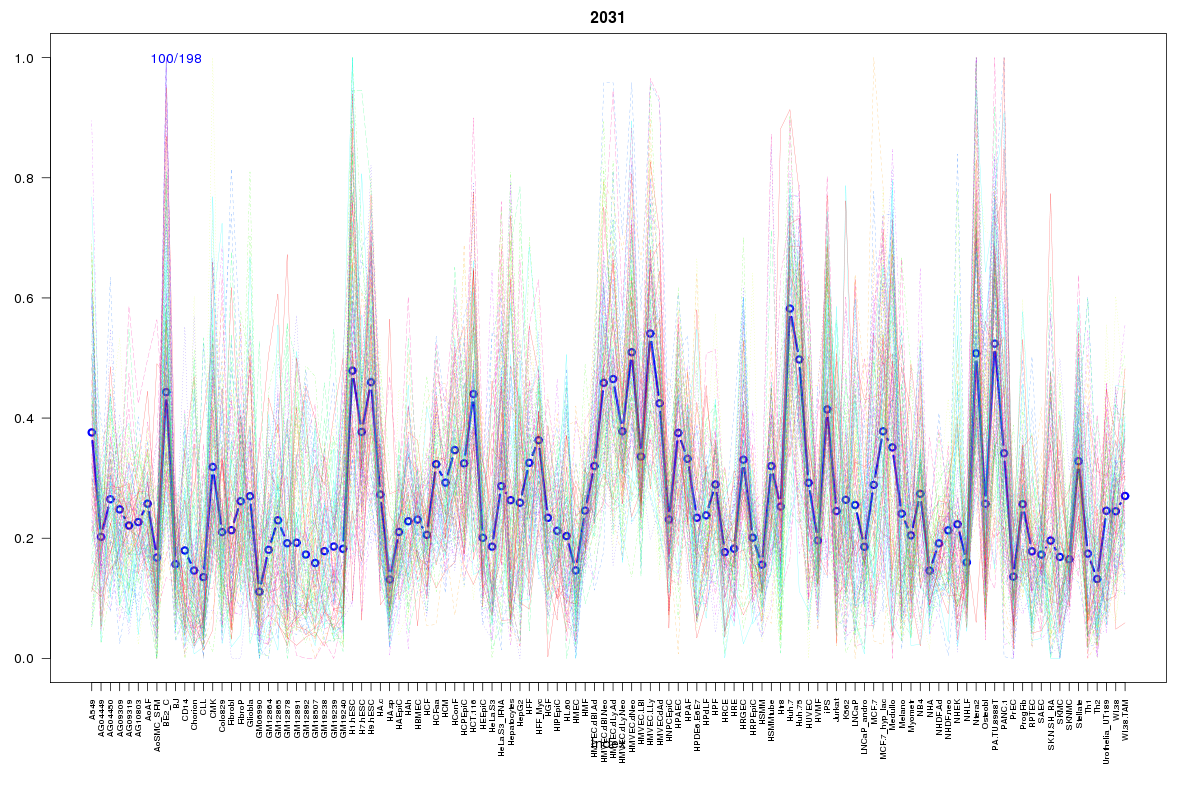 | 2031 | 1 |
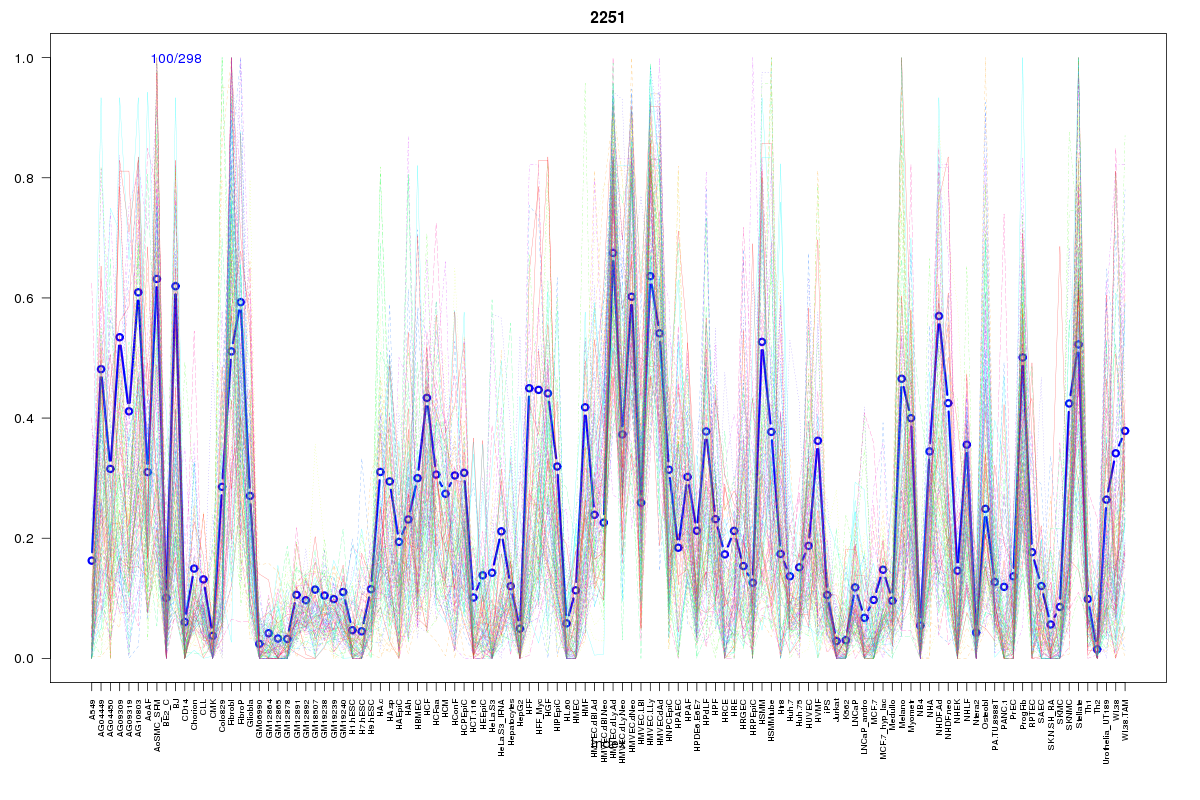 | 2251 | 1 |
Resources
BED file downloads
Connects to 9 DHS sitesTop 10 Correlated DHS Sites
p-values indiciate significant higher or lower correlation| Location | Cluster | P-value |
|---|---|---|
| chr1:54452280-54452430 | 2072 | 0.021 |
| chr1:54518400-54518550 | 371 | 0.022 |
| chr1:54518620-54518770 | 1404 | 0.022 |
| chr1:54603505-54603655 | 2251 | 0.02 |
| chr1:54437580-54437730 | 1380 | 0.018 |
| chr1:54575500-54575650 | 1008 | 0.015 |
| chr1:54584480-54584630 | 1095 | 0.015 |
| chr1:54589945-54590095 | 2055 | 0.004 |
| chr1:54591500-54591650 | 2031 | 0.004 |
External Databases
UCSCEnsembl (ENSG00000116205)