Gene: TPI1
chr12: 6976282-6980112Expression Profile
(log scale)
Graphical Connections
Distribution of linked clusters:
You may find it interesting if many of the connected DHS sites belong to the same cluster.| Cluster Profile | Cluster ID | Number of DHS sites in this cluster |
|---|---|---|
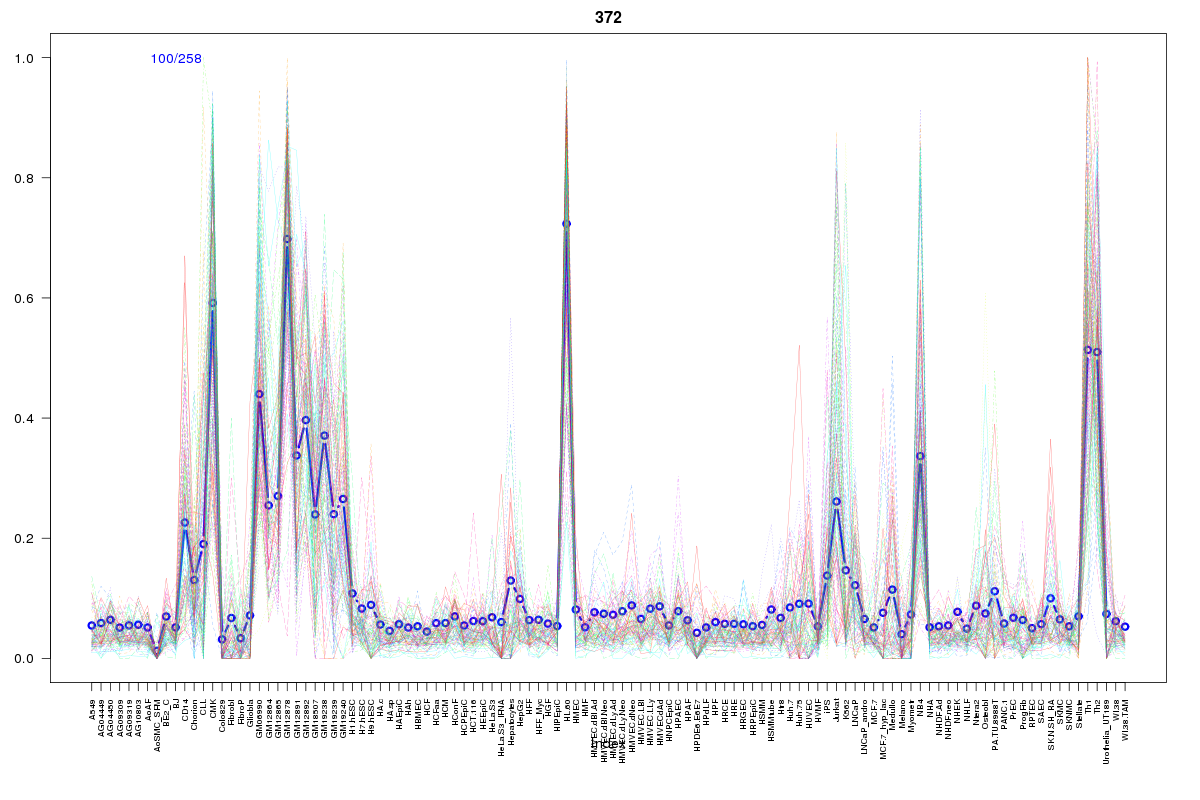 | 372 | 4 |
 | 2122 | 4 |
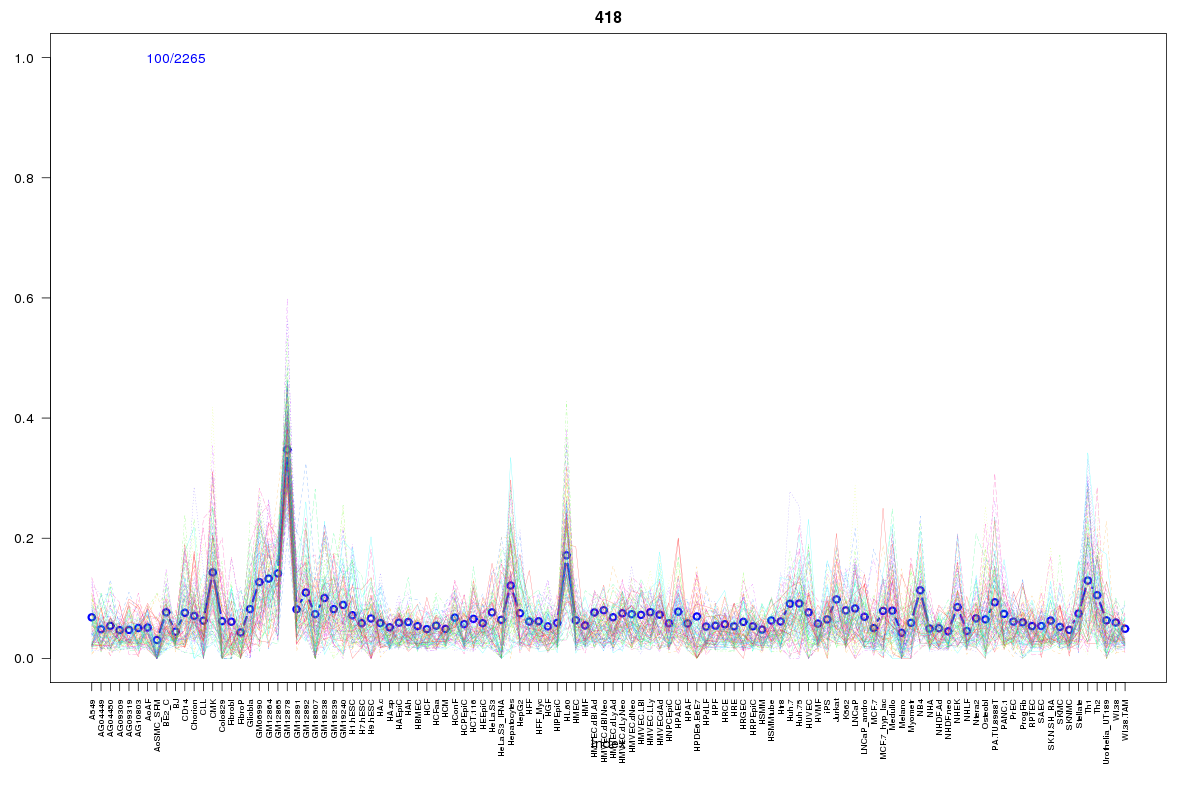 | 418 | 3 |
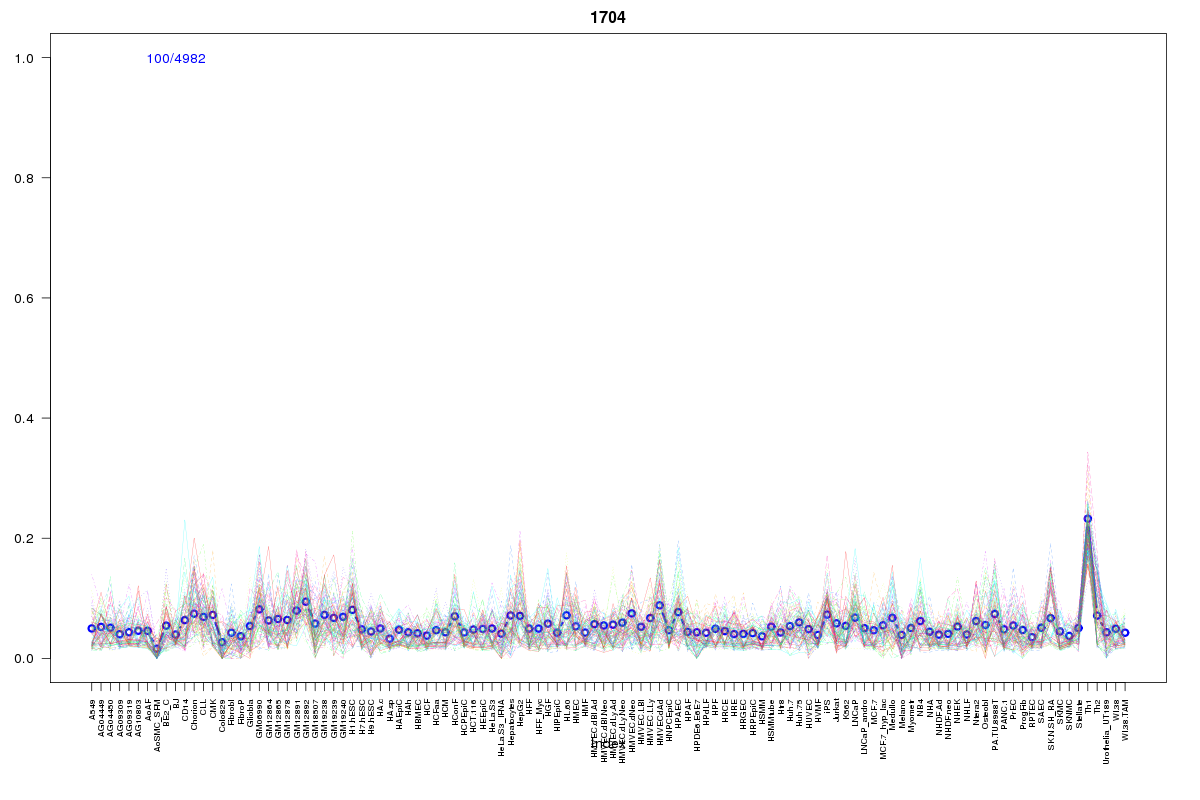 | 1704 | 2 |
 | 10 | 2 |
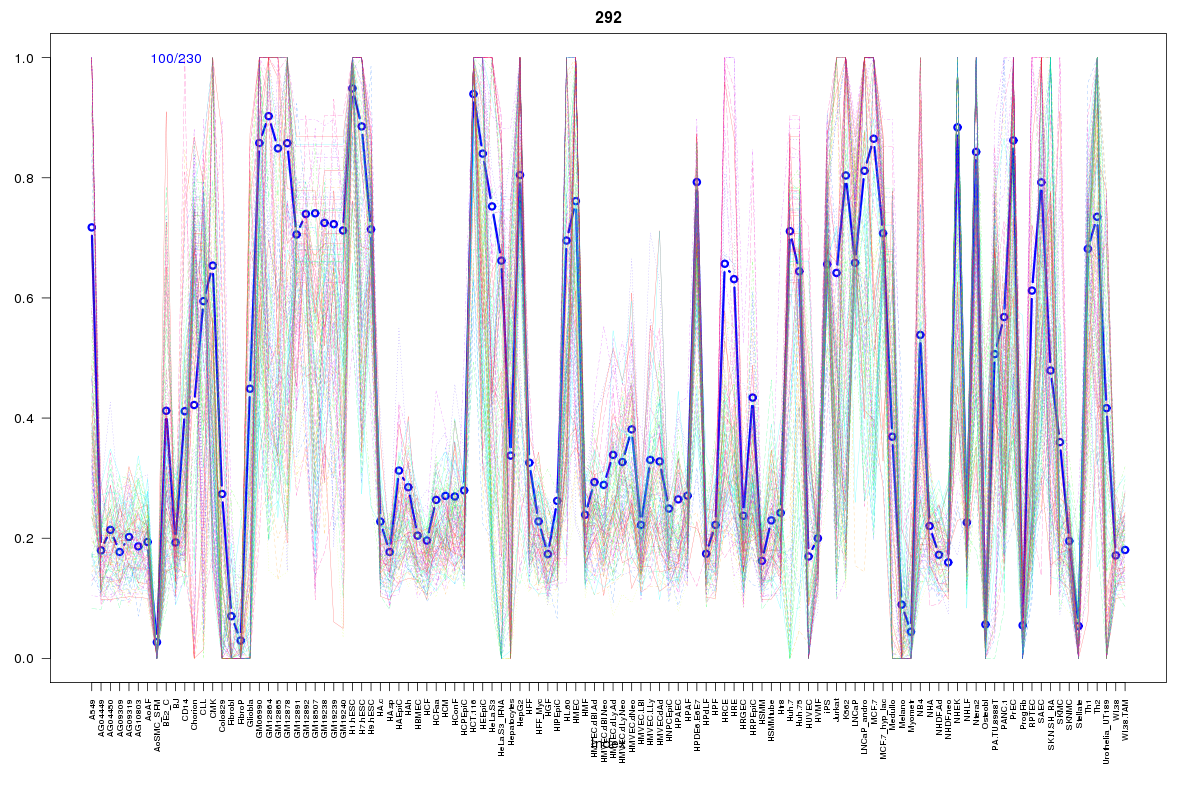 | 292 | 2 |
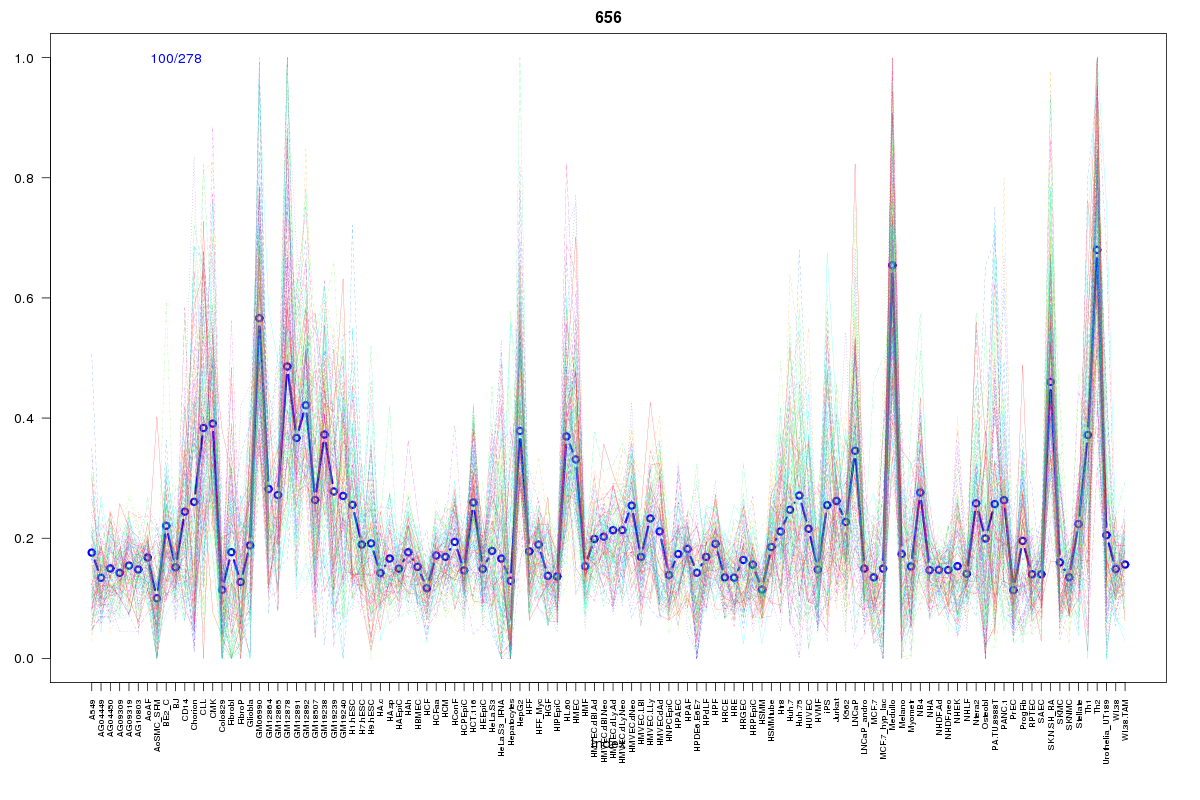 | 656 | 2 |
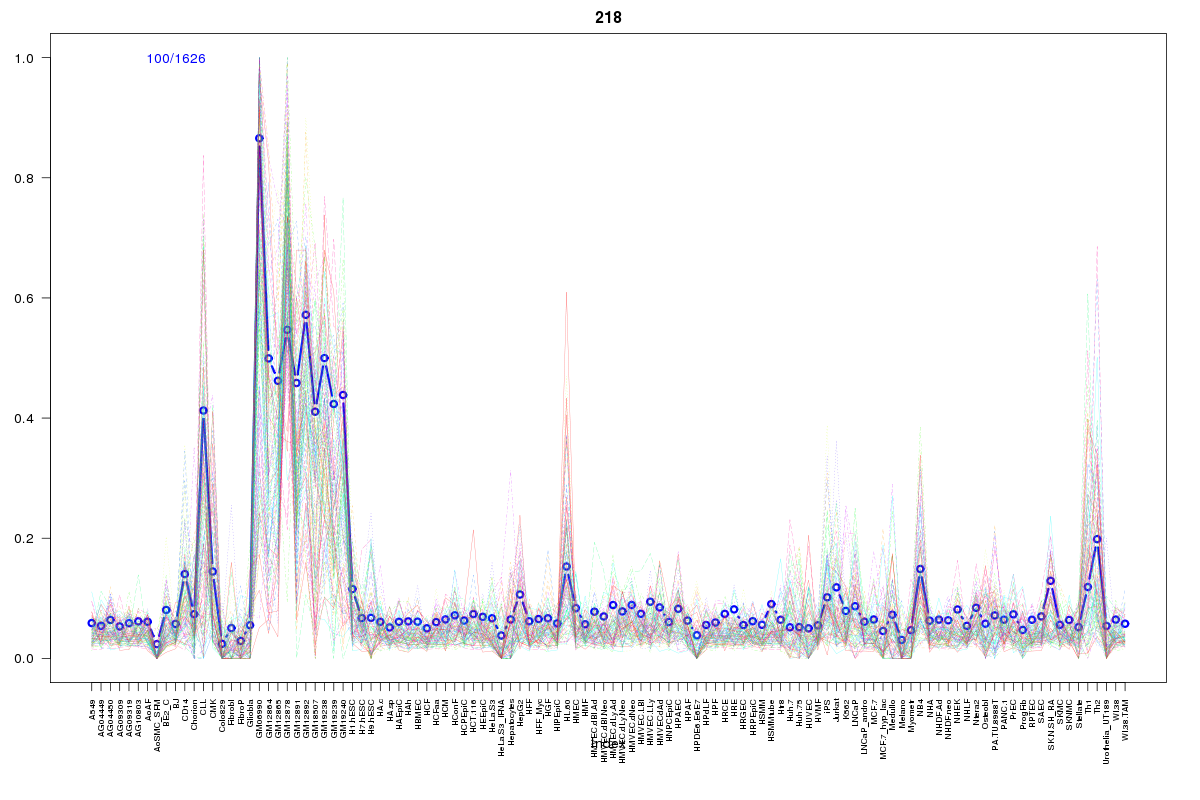 | 218 | 2 |
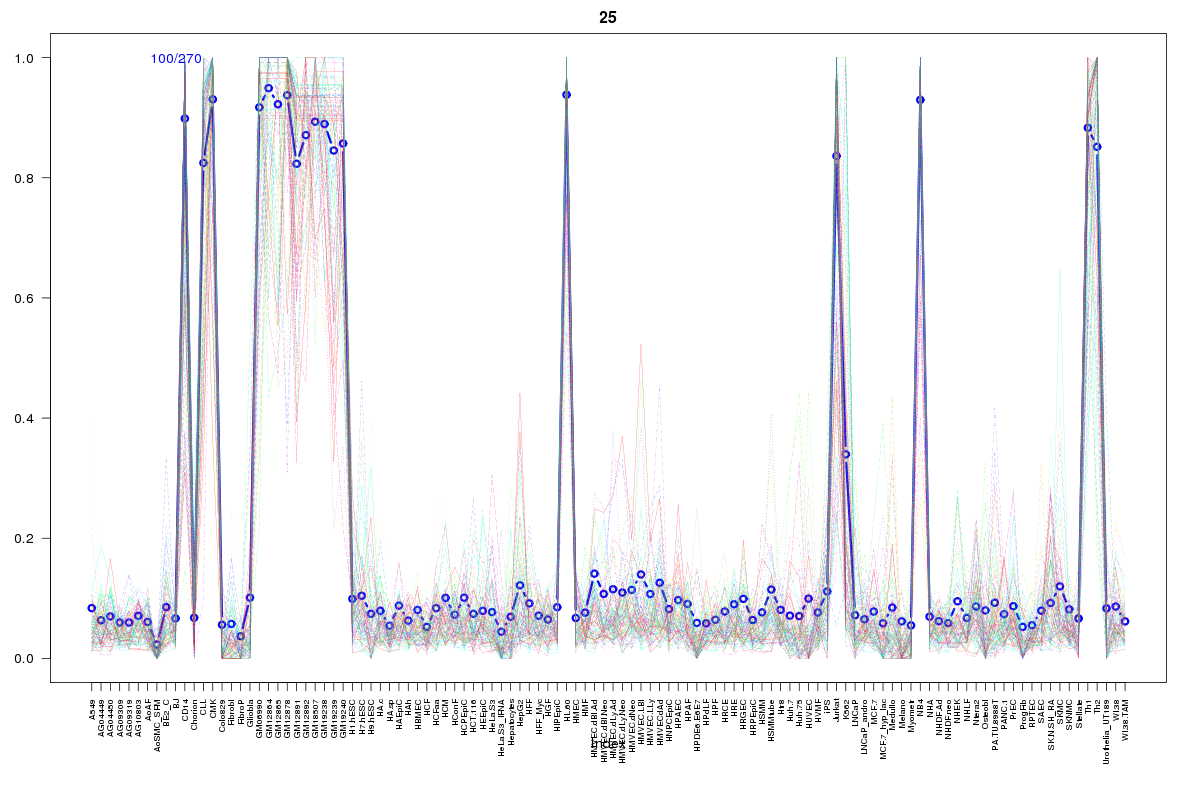 | 25 | 2 |
 | 2062 | 2 |
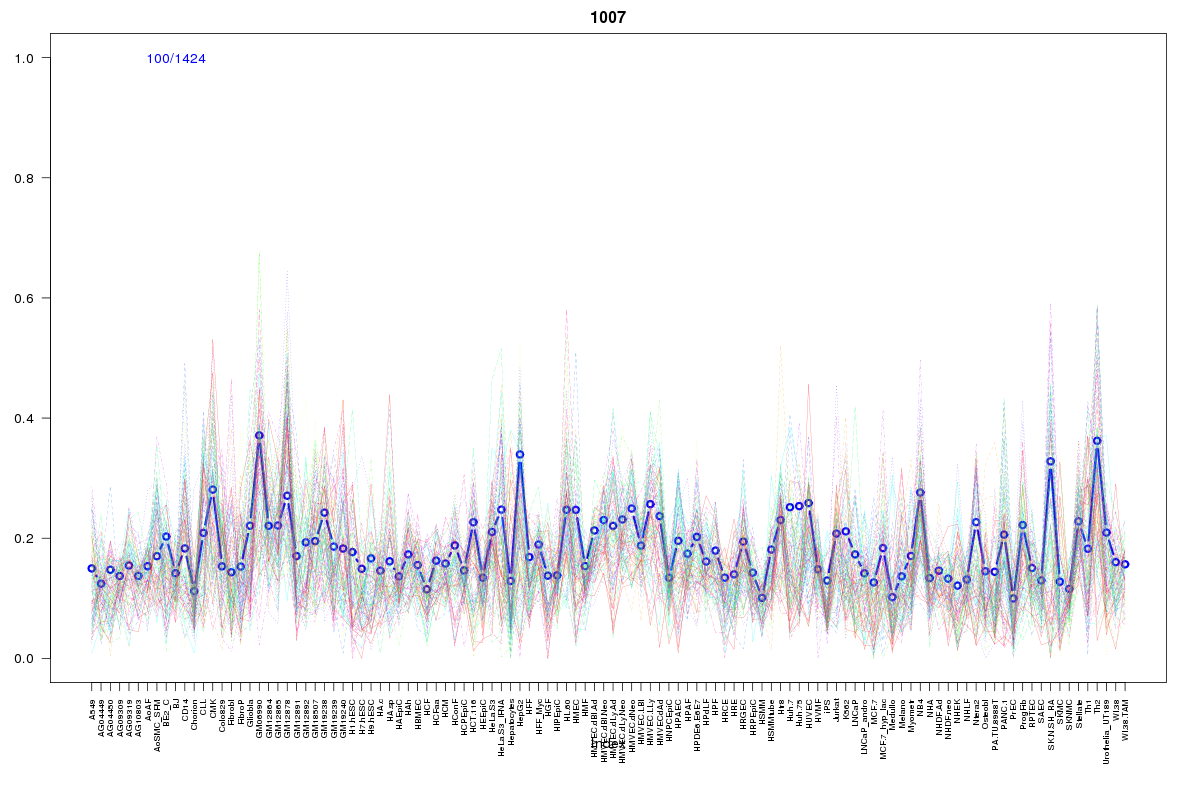 | 1007 | 2 |
 | 2279 | 2 |
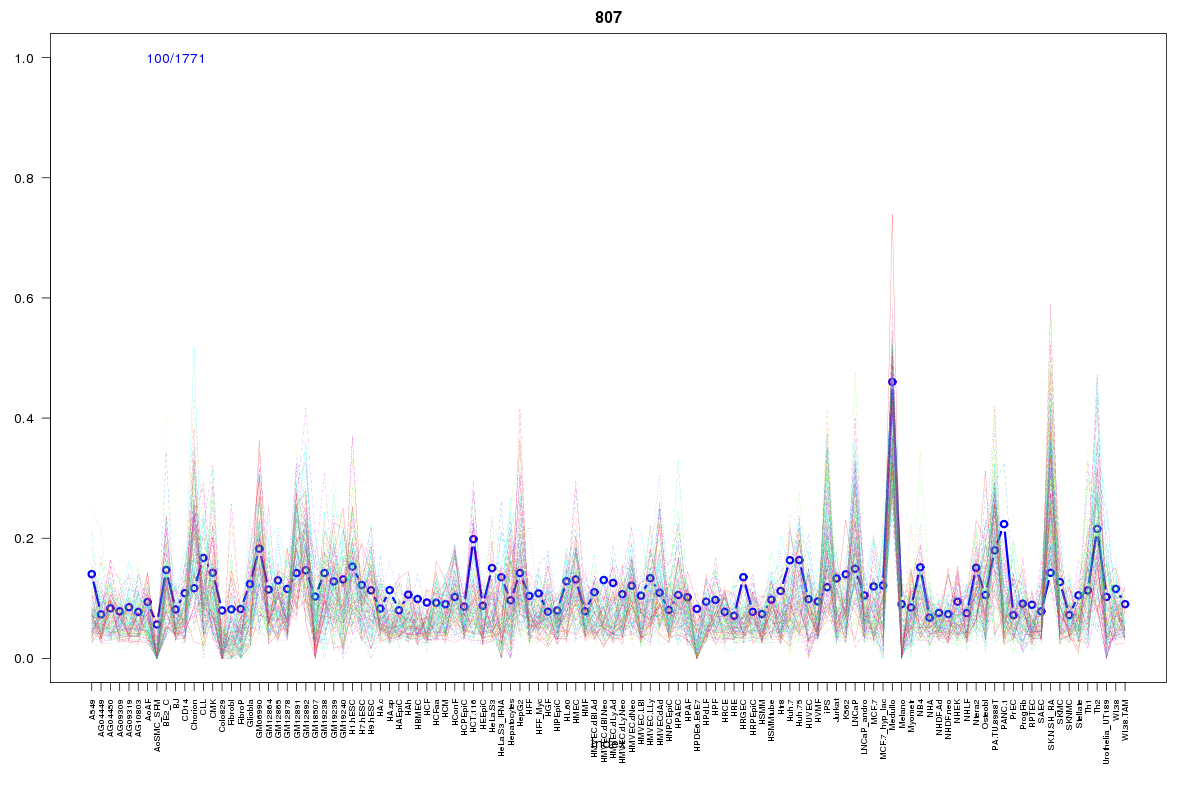 | 807 | 2 |
 | 629 | 2 |
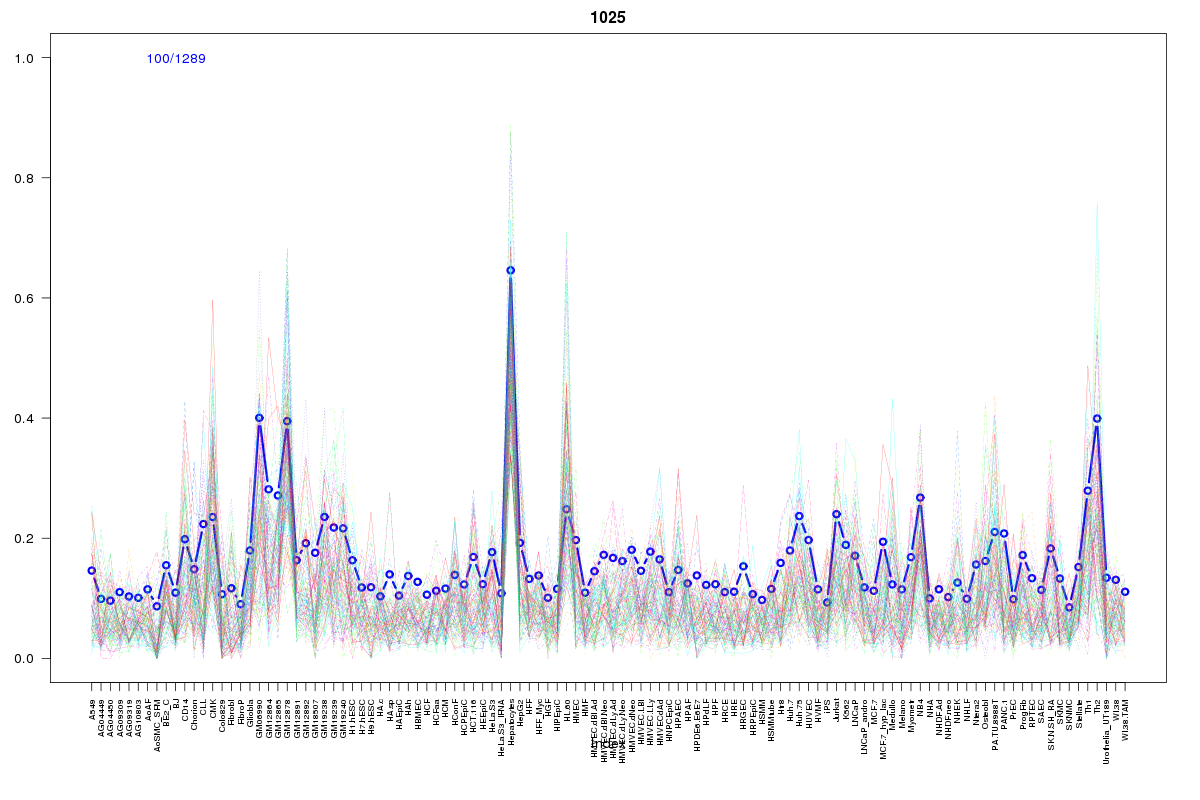 | 1025 | 2 |
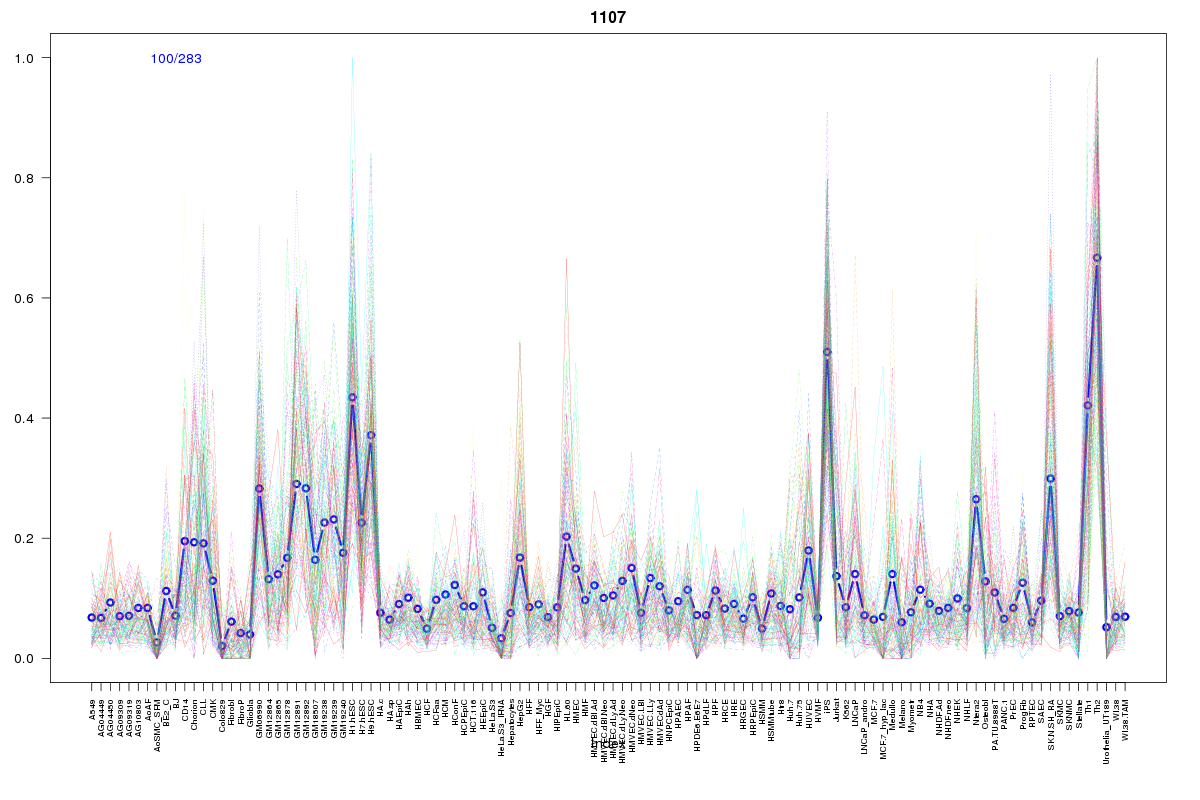 | 1107 | 2 |
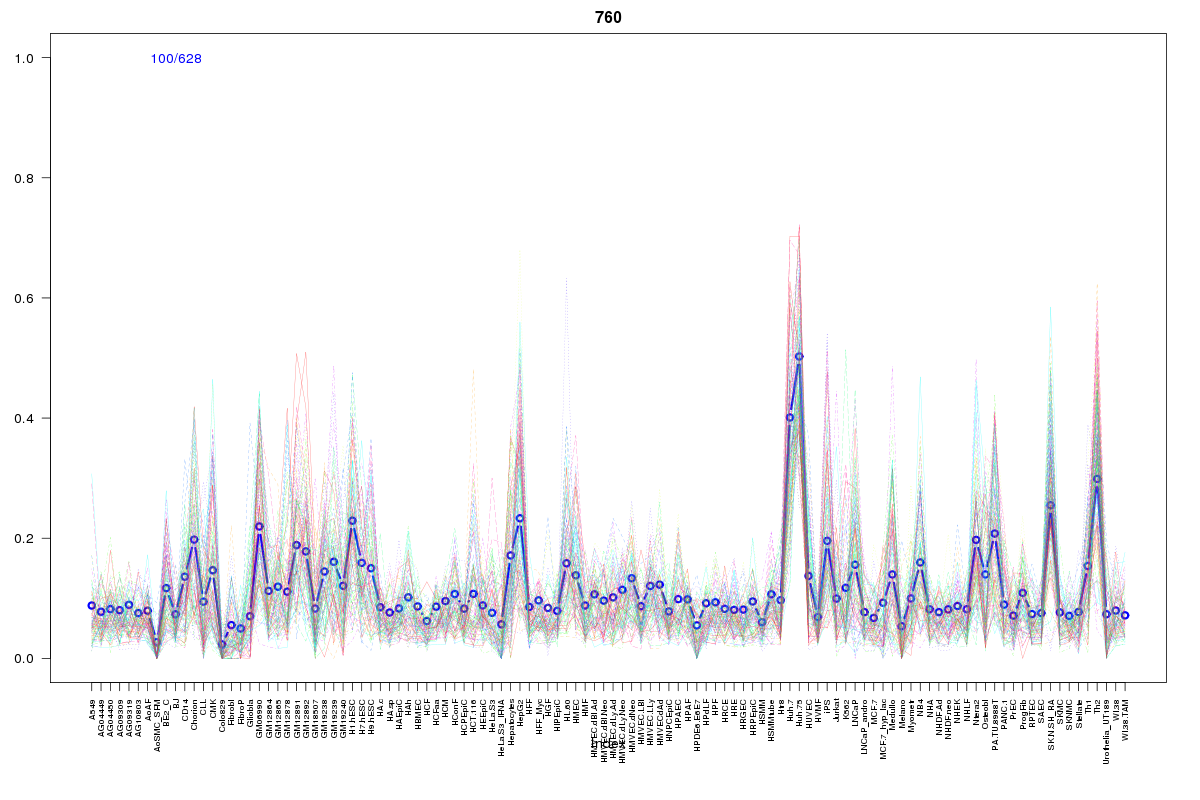 | 760 | 2 |
 | 192 | 1 |
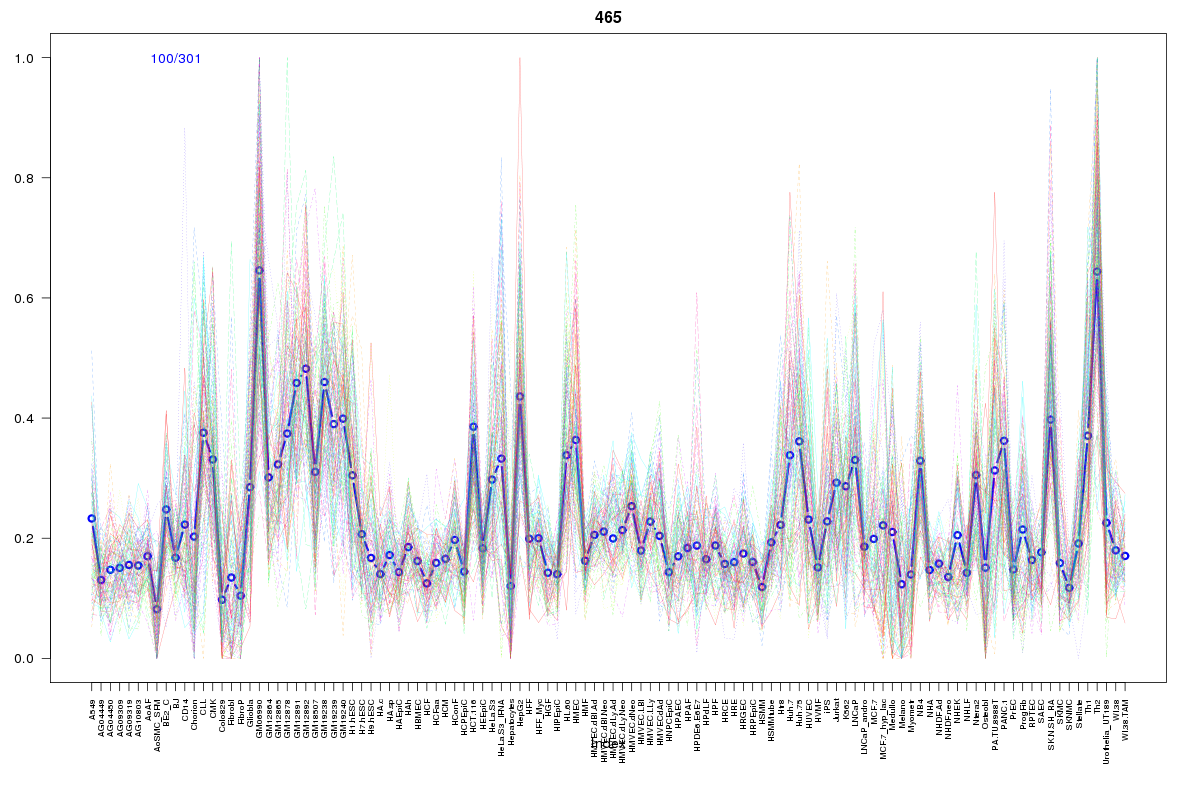 | 465 | 1 |
 | 1970 | 1 |
 | 1143 | 1 |
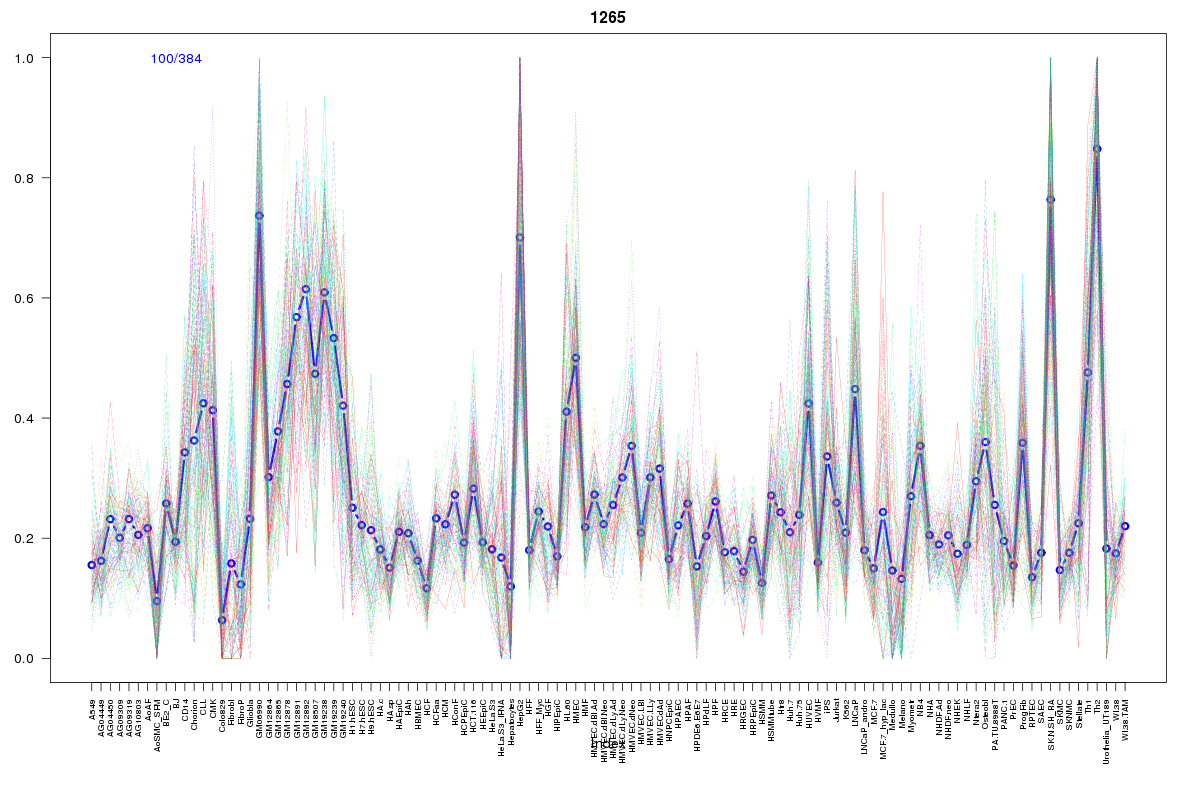 | 1265 | 1 |
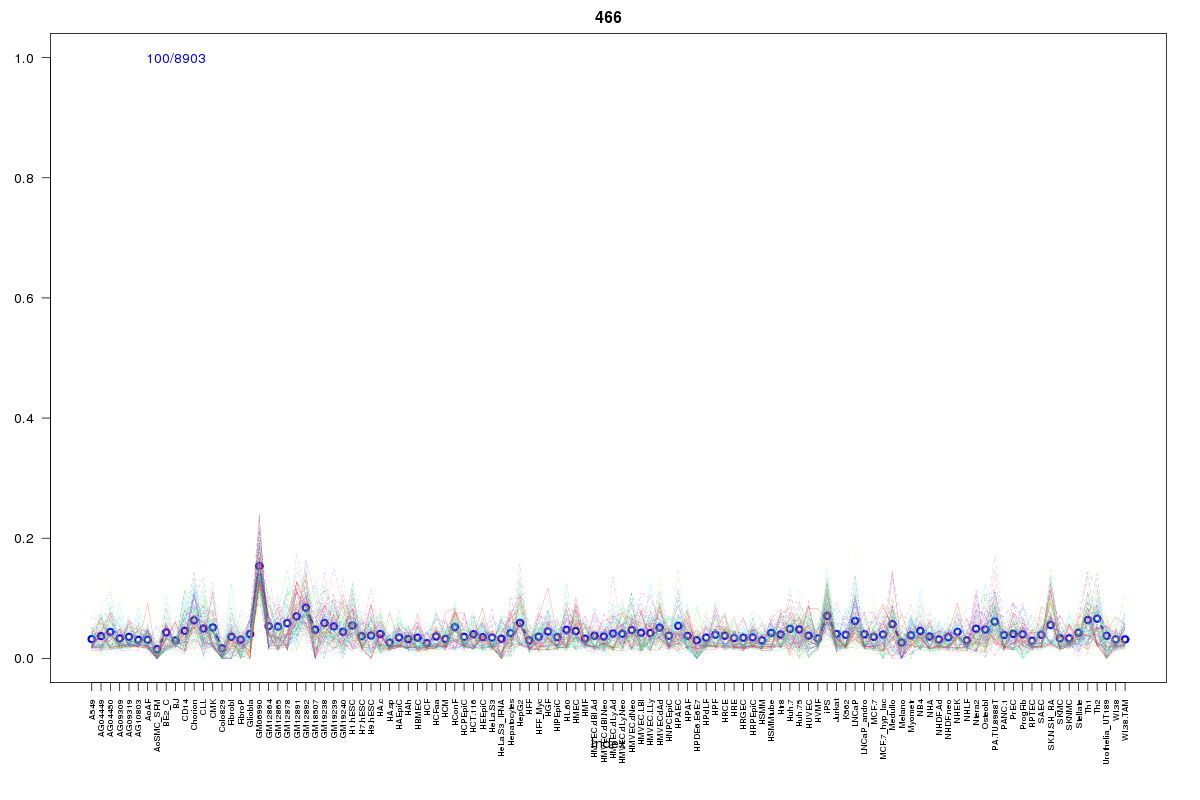 | 466 | 1 |
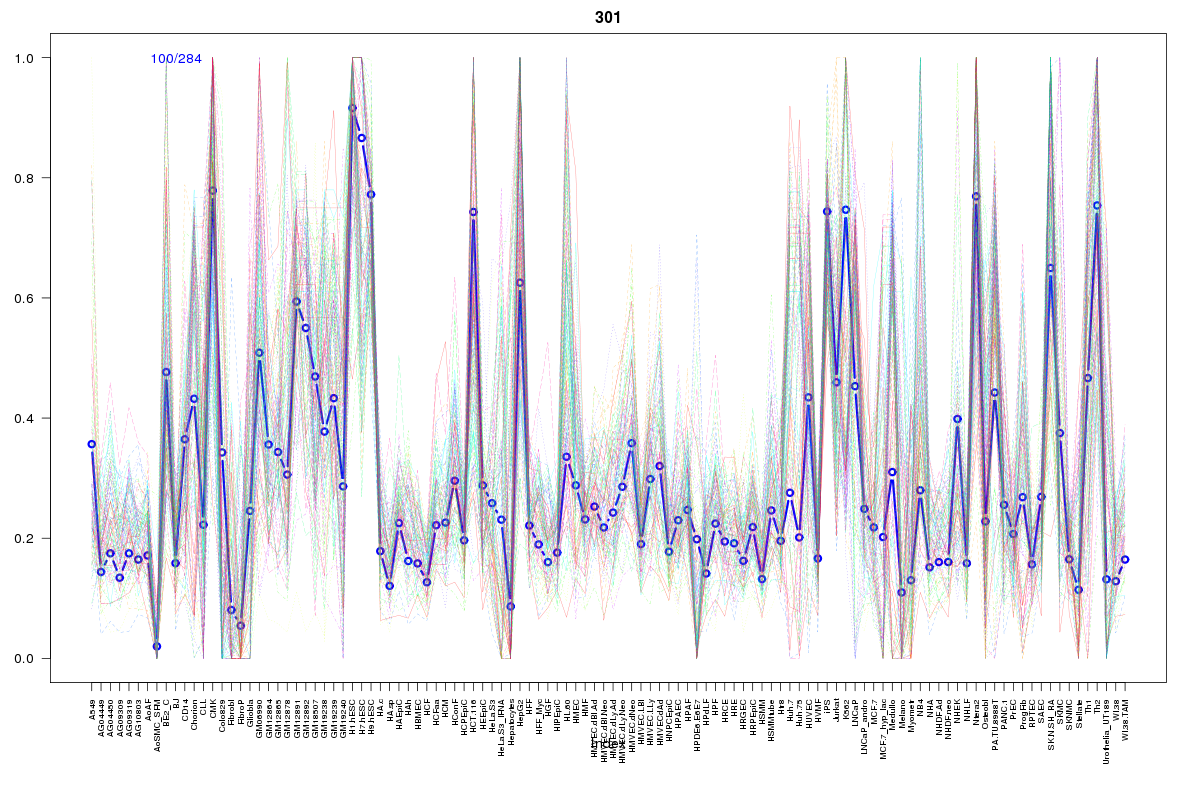 | 301 | 1 |
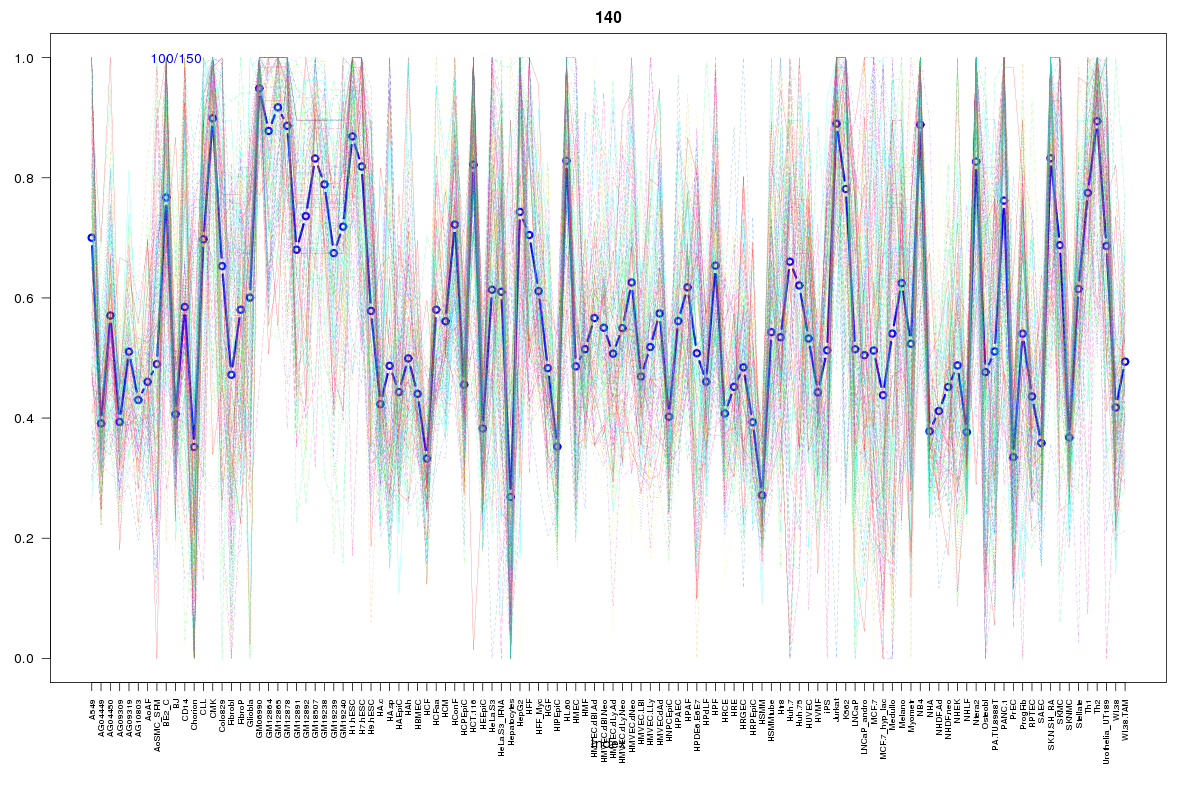 | 140 | 1 |
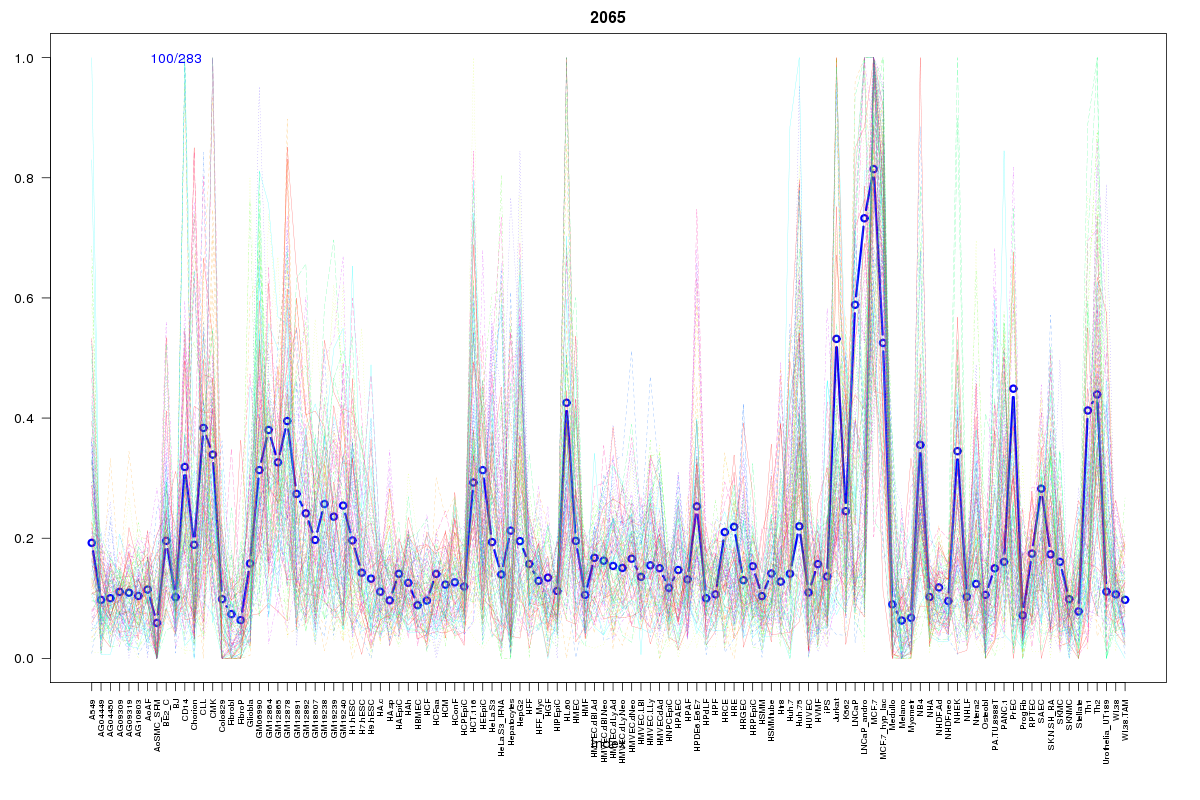 | 2065 | 1 |
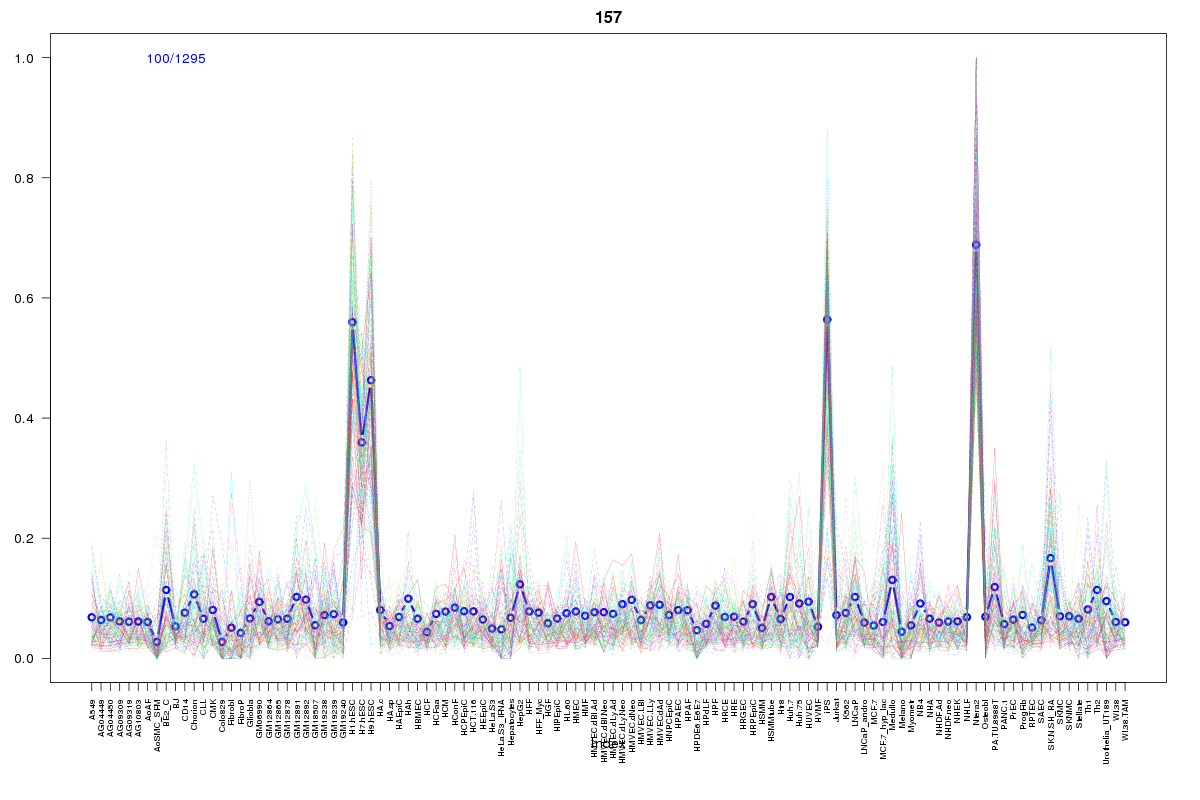 | 157 | 1 |
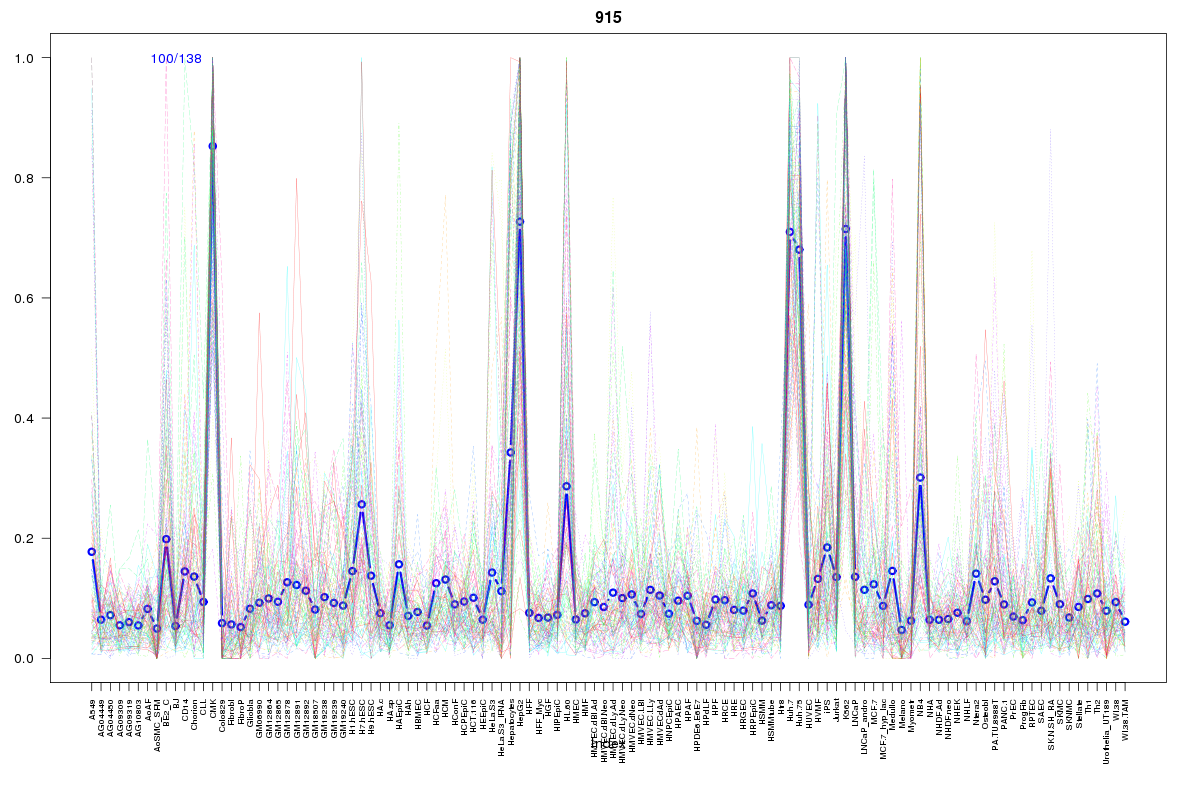 | 915 | 1 |
 | 2012 | 1 |
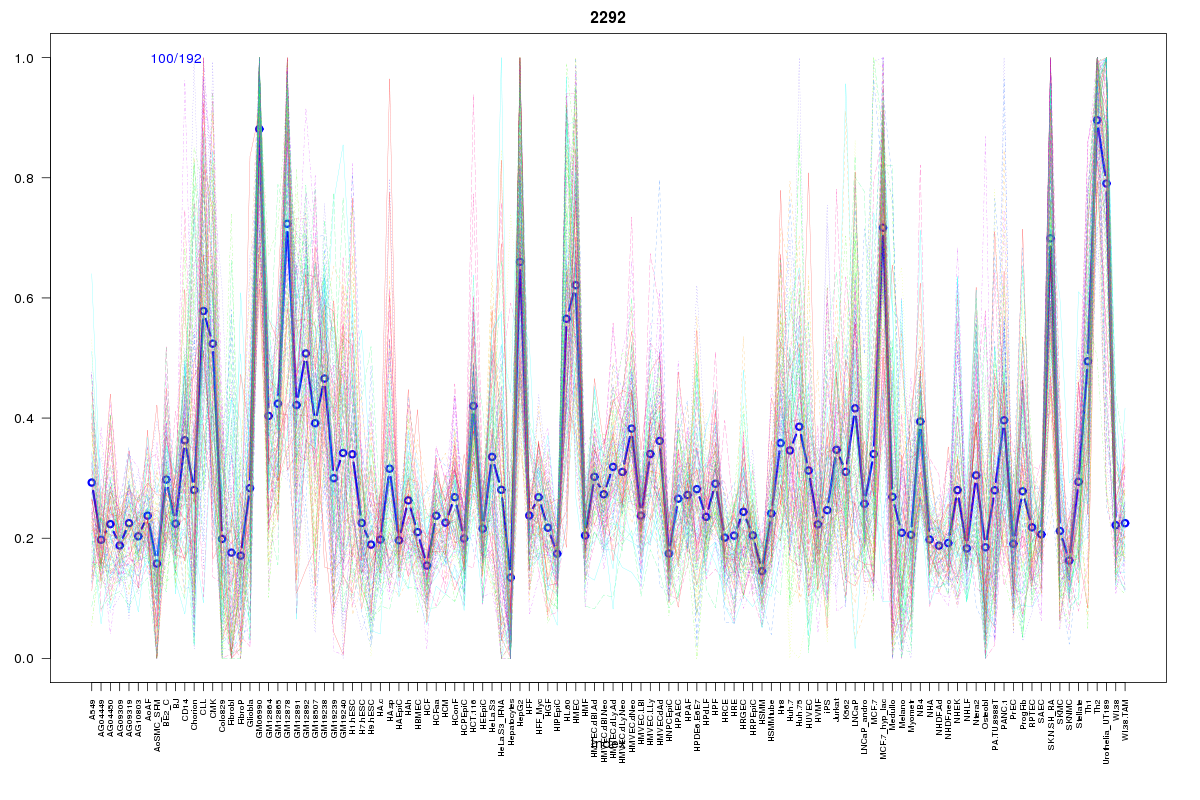 | 2292 | 1 |
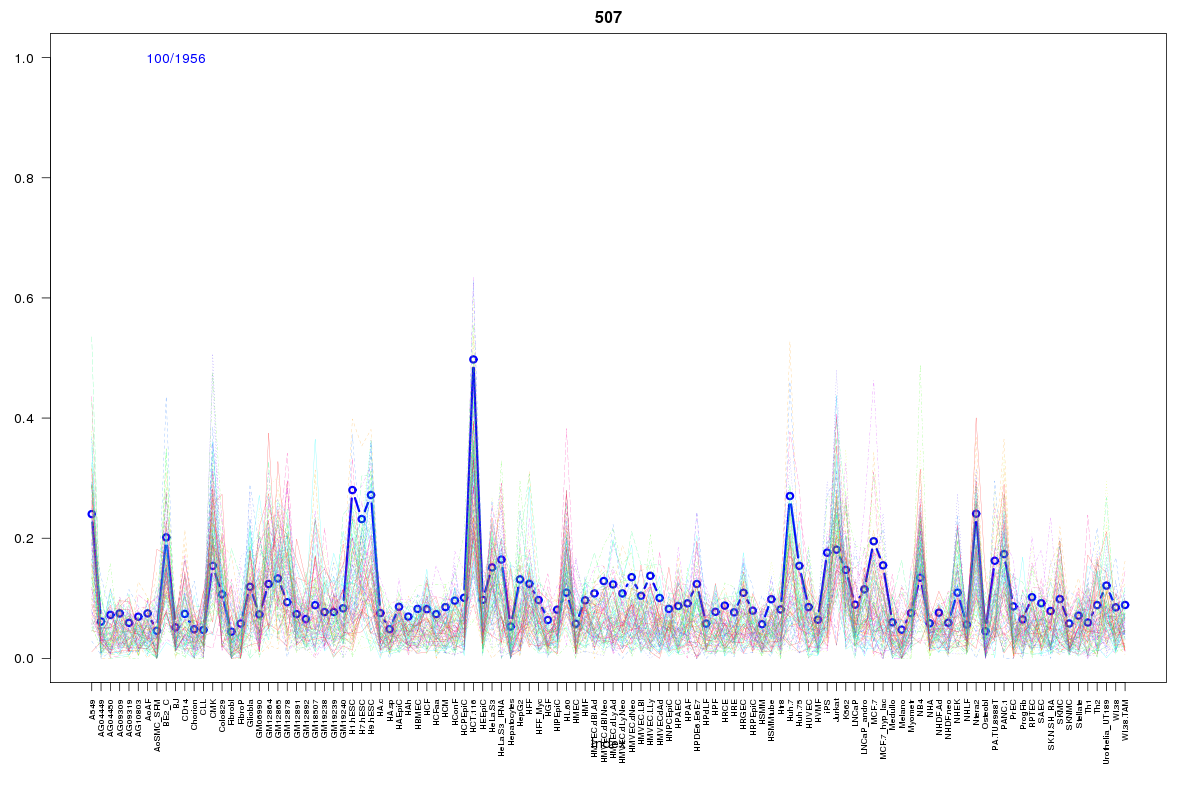 | 507 | 1 |
 | 2072 | 1 |
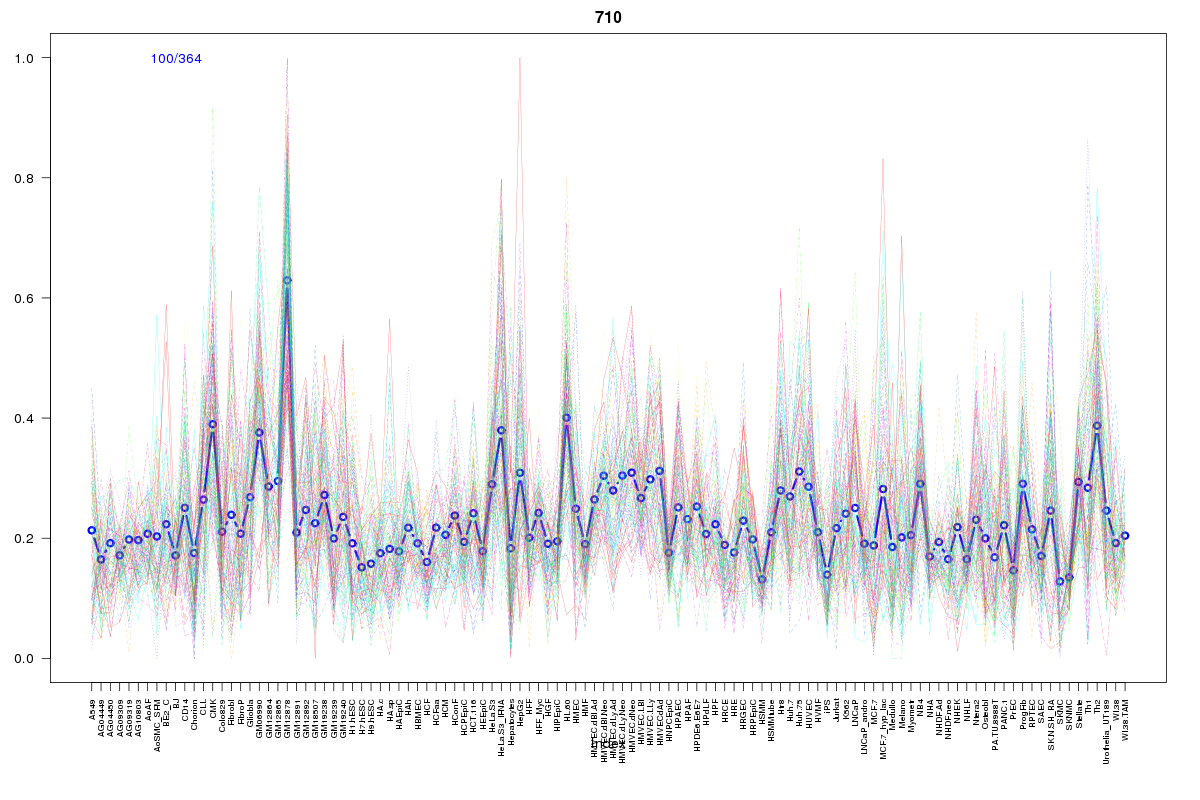 | 710 | 1 |
 | 1056 | 1 |
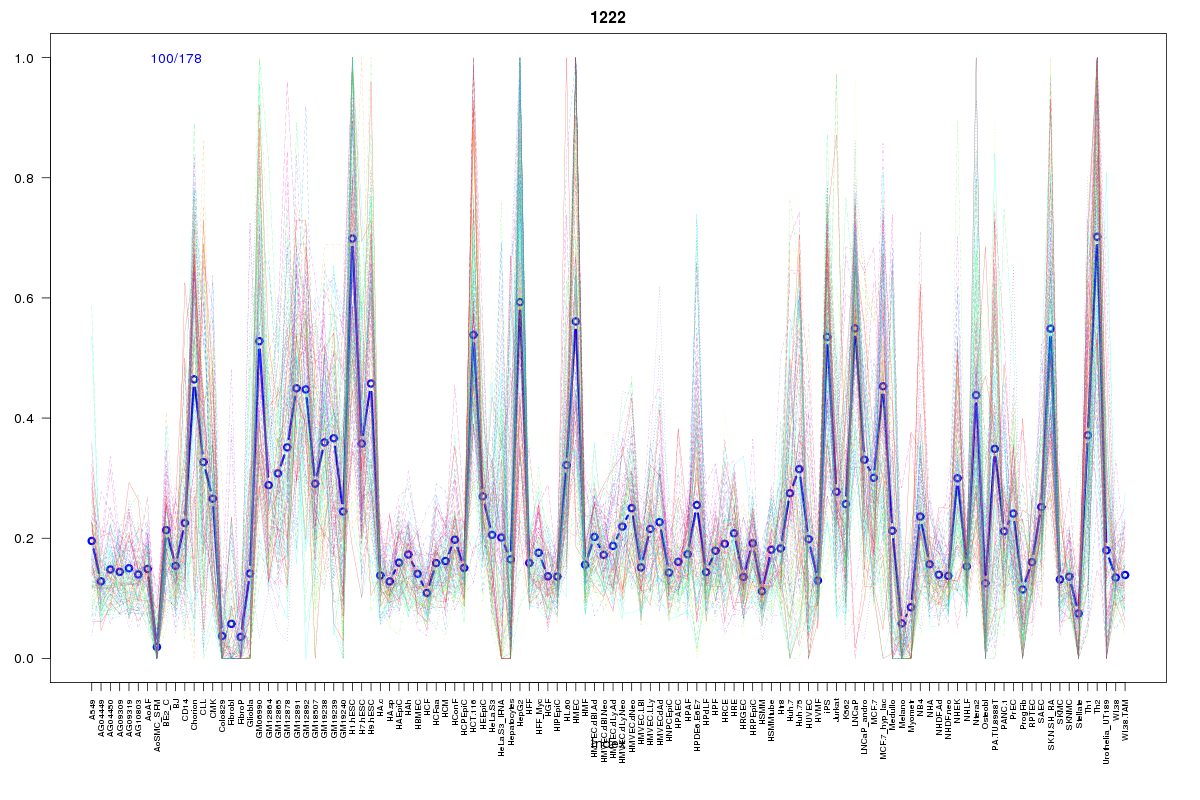 | 1222 | 1 |
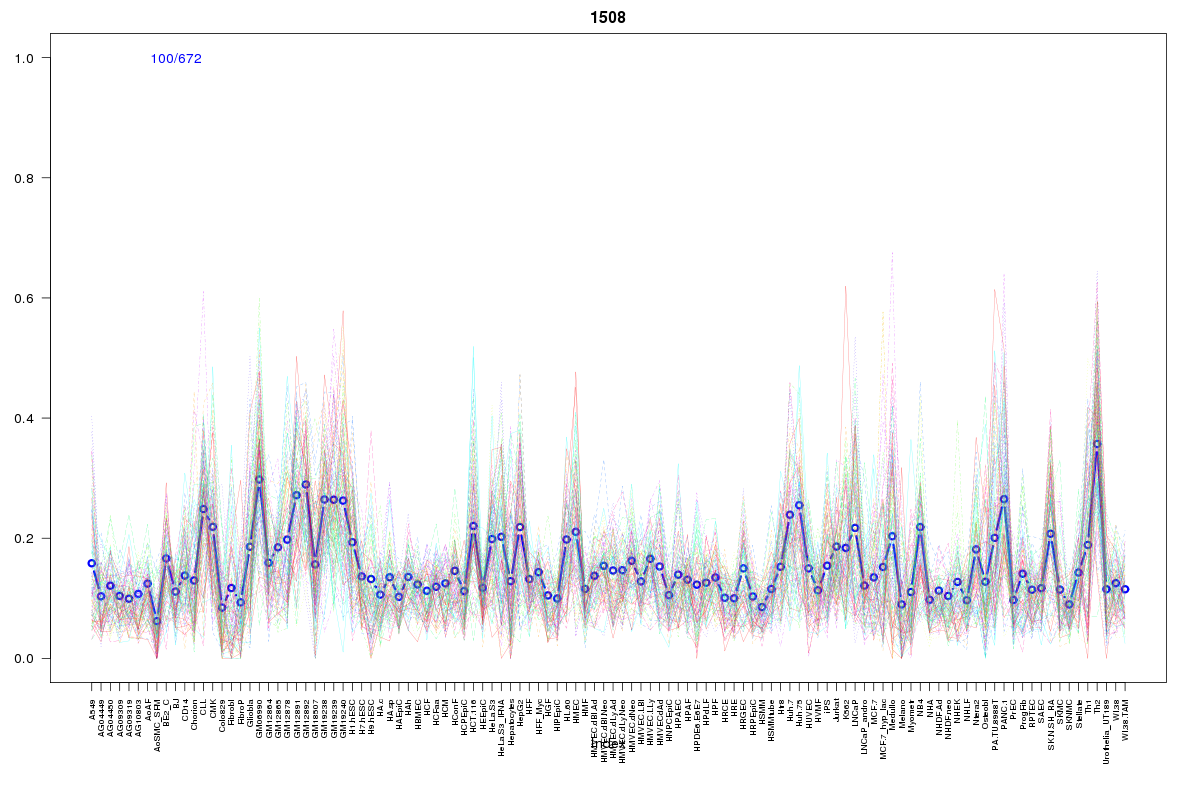 | 1508 | 1 |
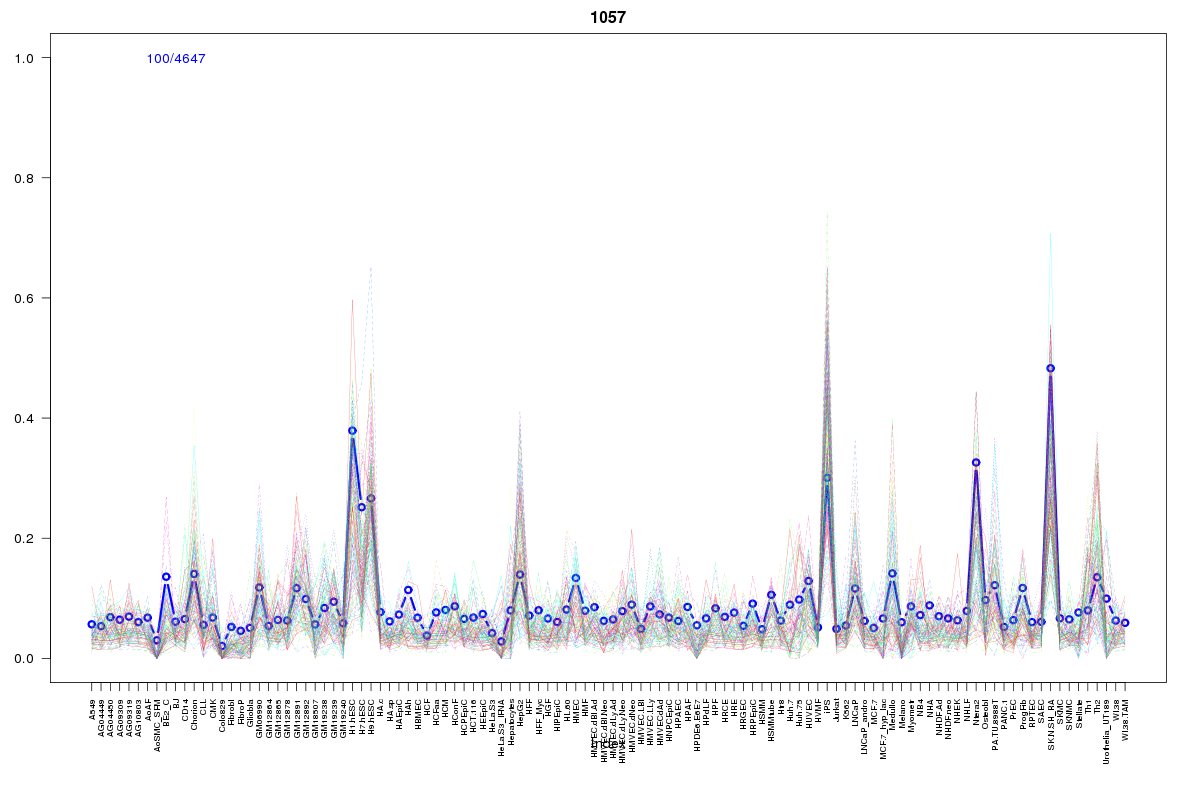 | 1057 | 1 |
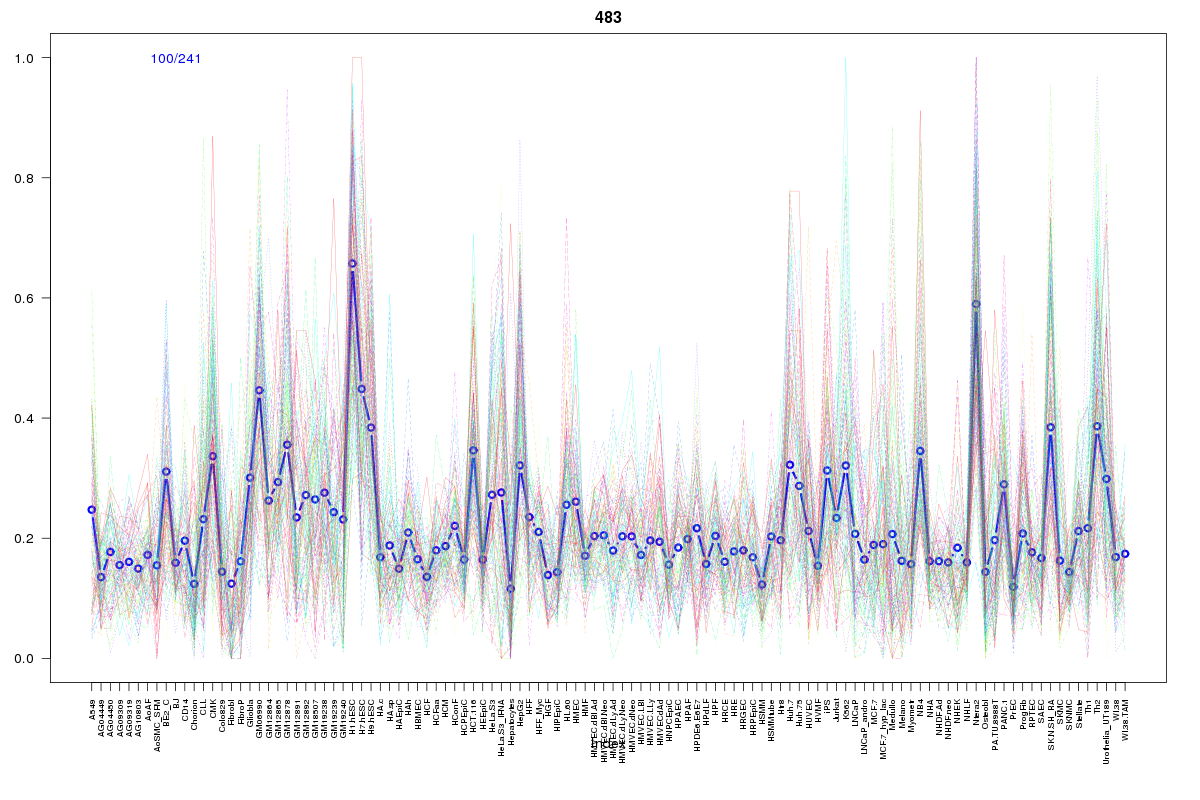 | 483 | 1 |
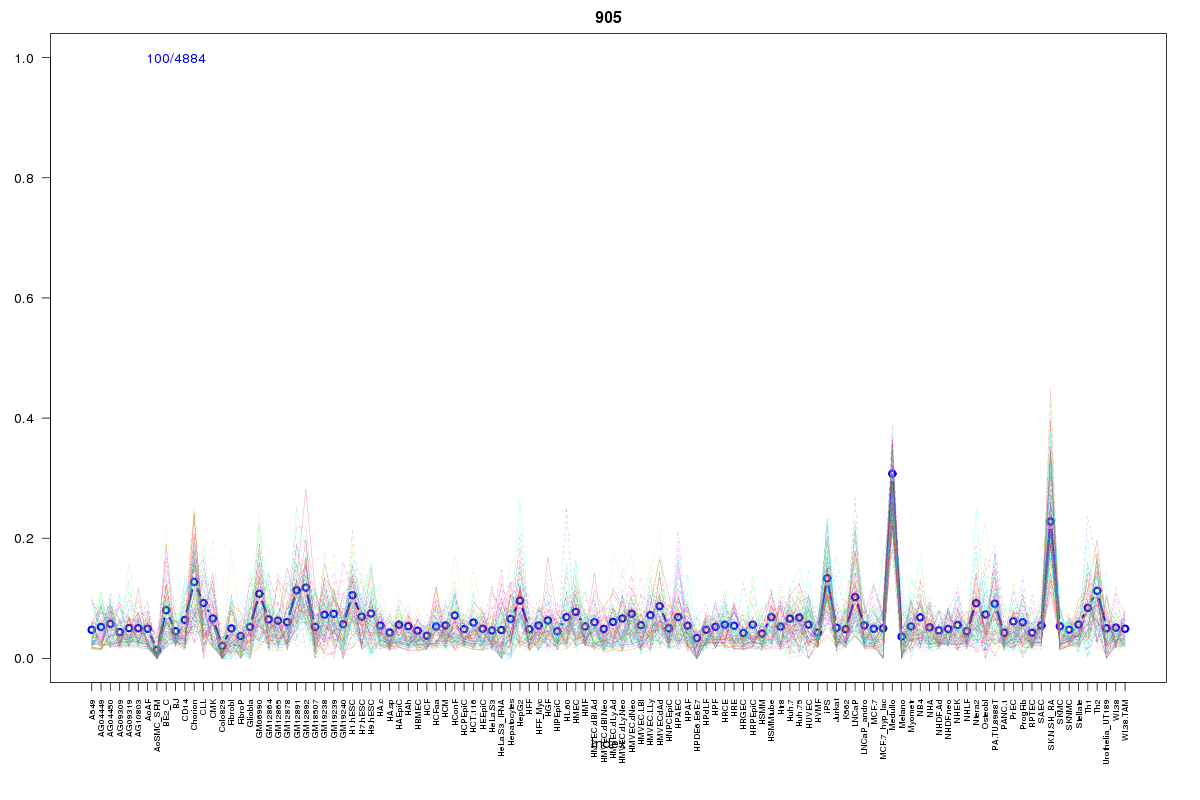 | 905 | 1 |
 | 2114 | 1 |
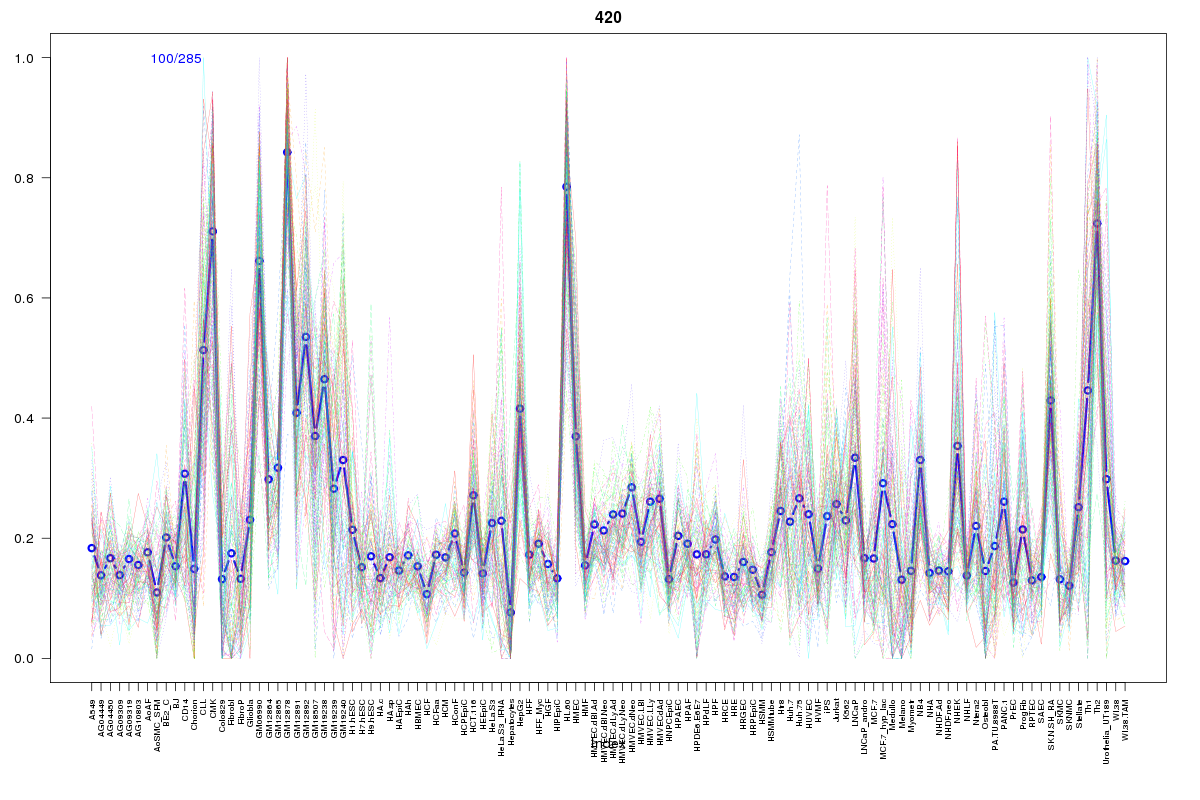 | 420 | 1 |
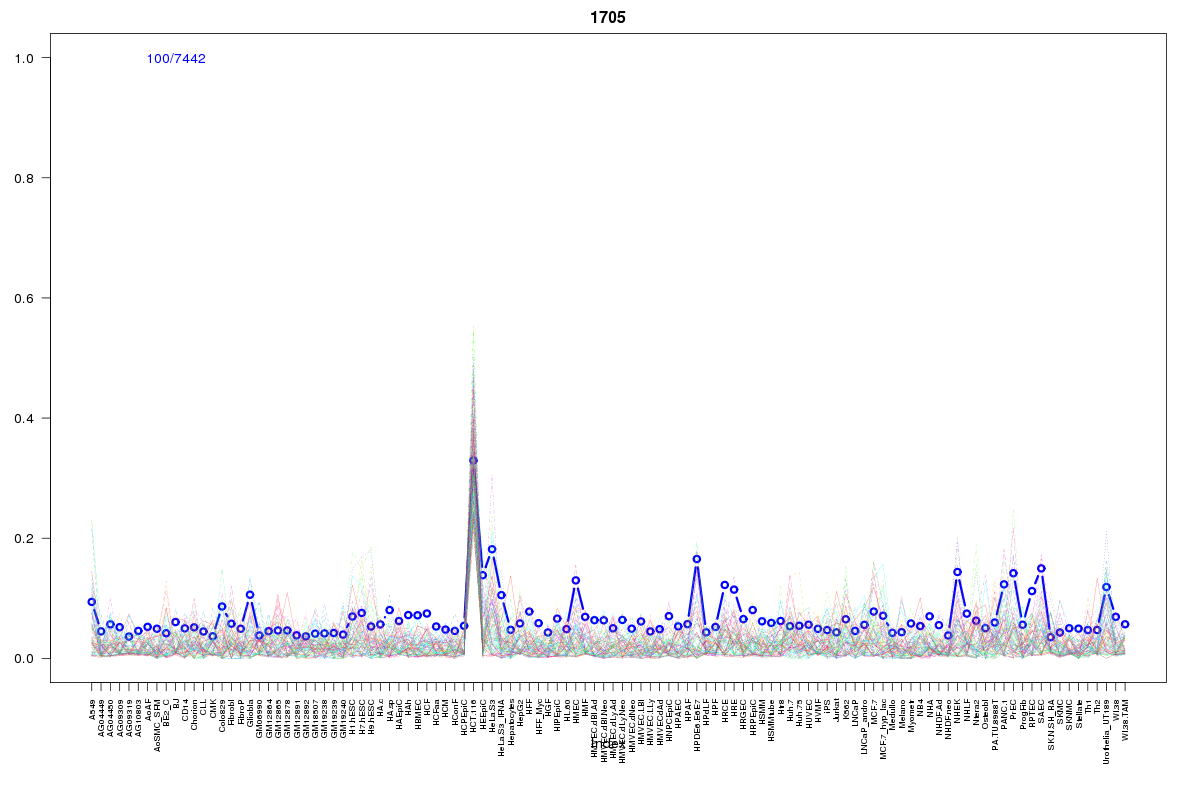 | 1705 | 1 |
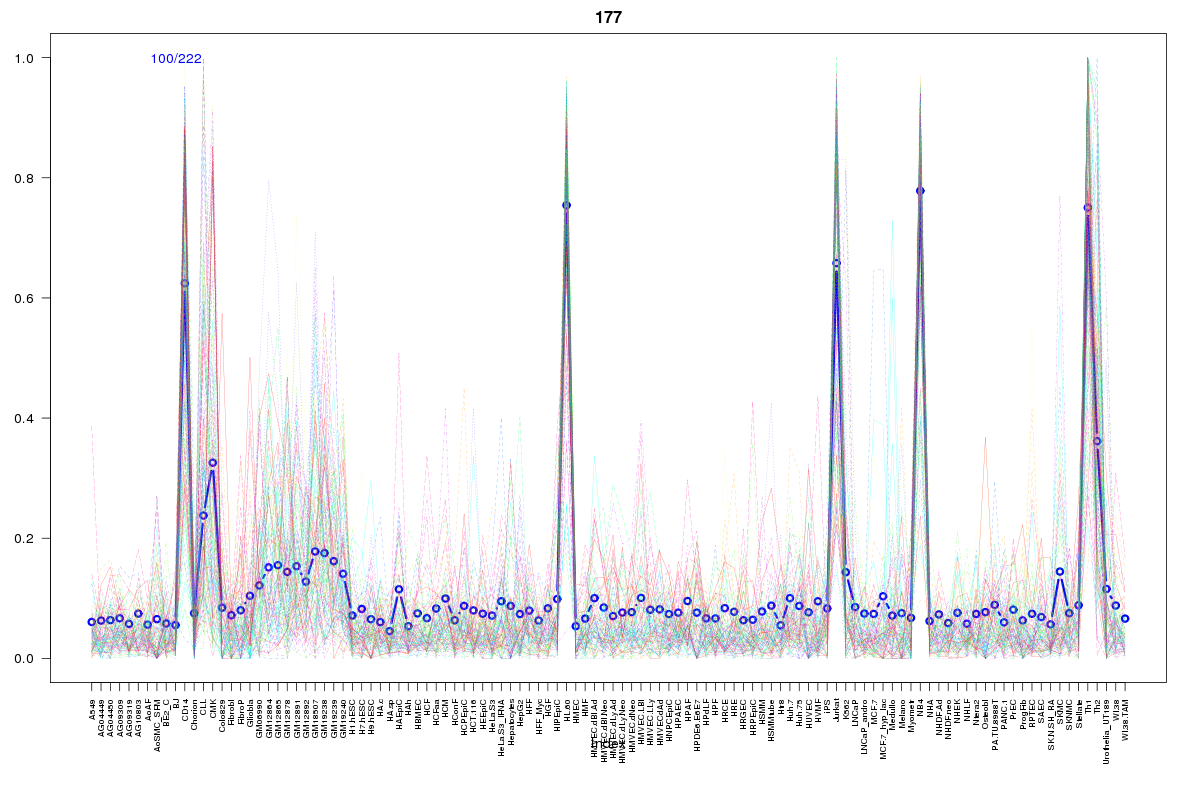 | 177 | 1 |
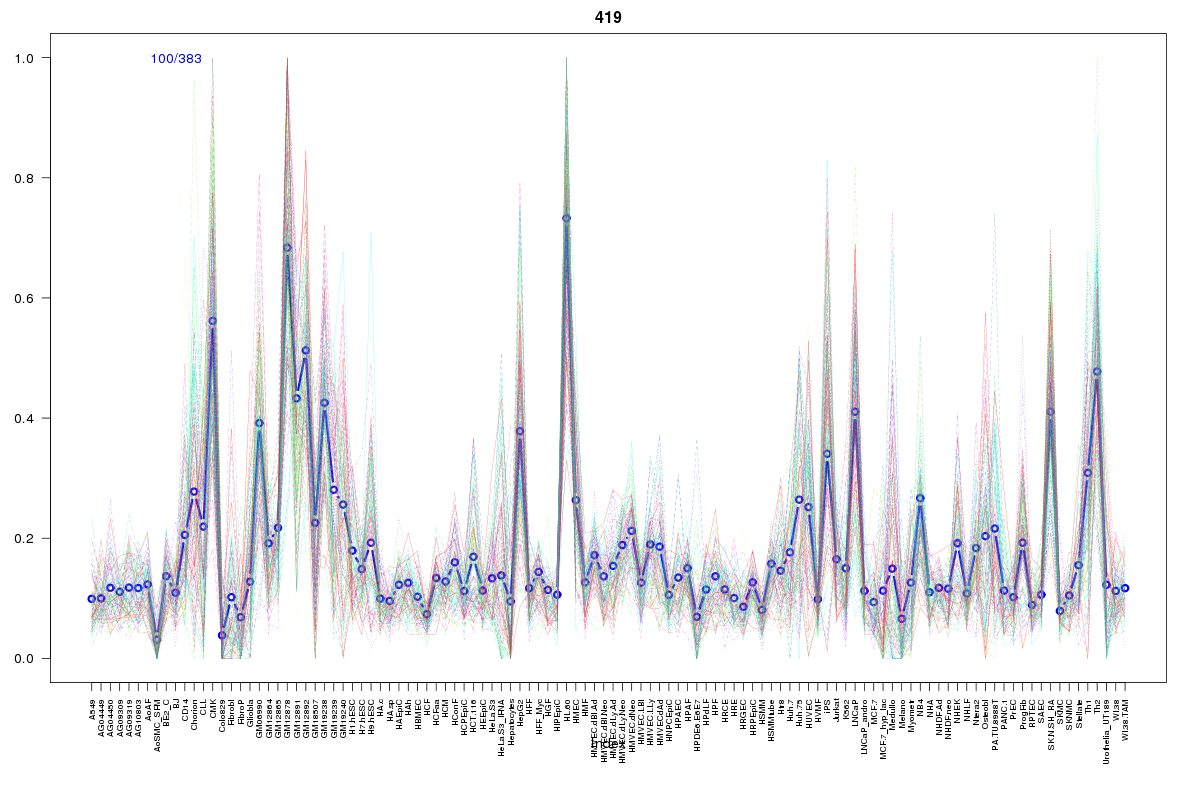 | 419 | 1 |
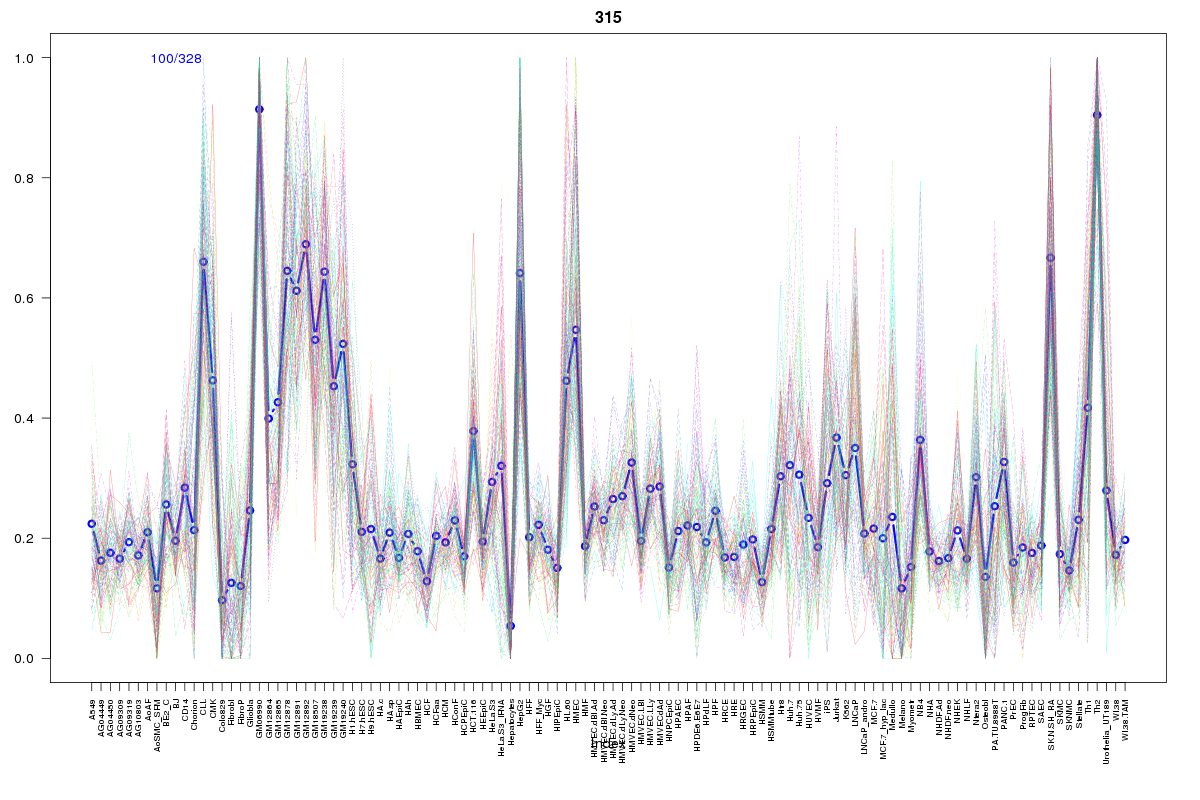 | 315 | 1 |
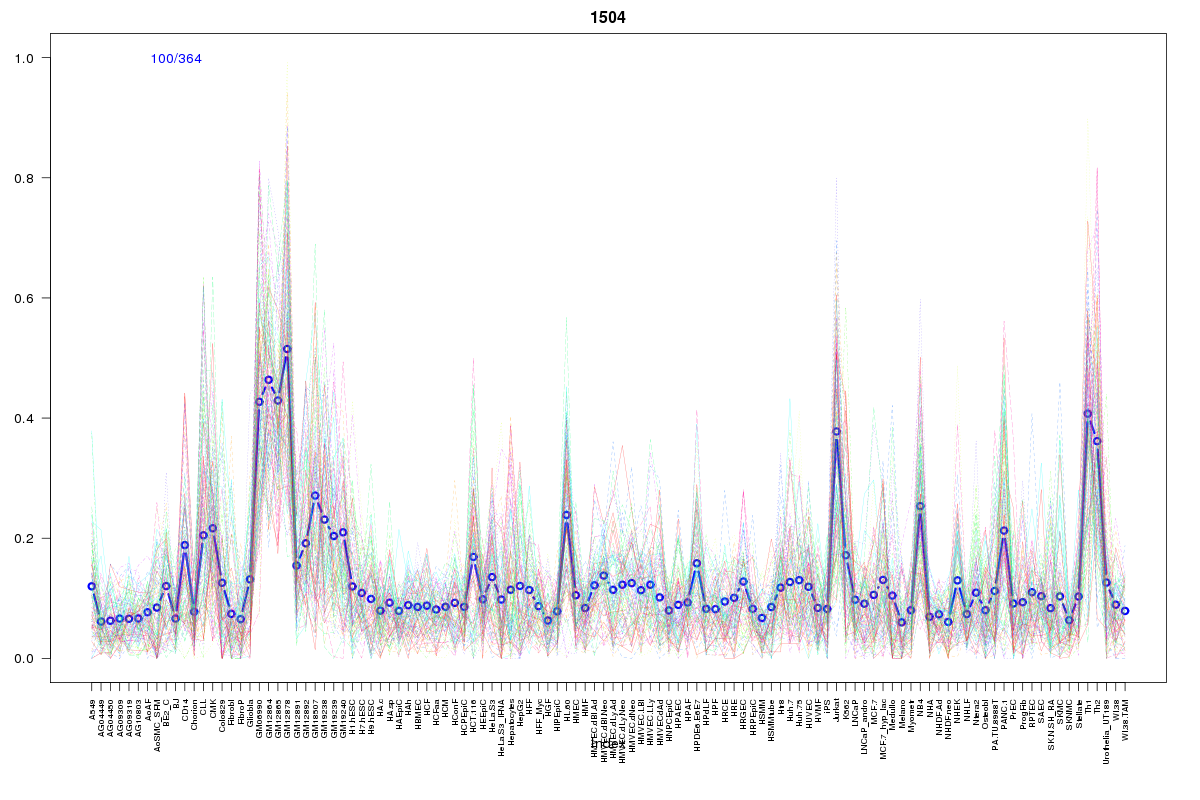 | 1504 | 1 |
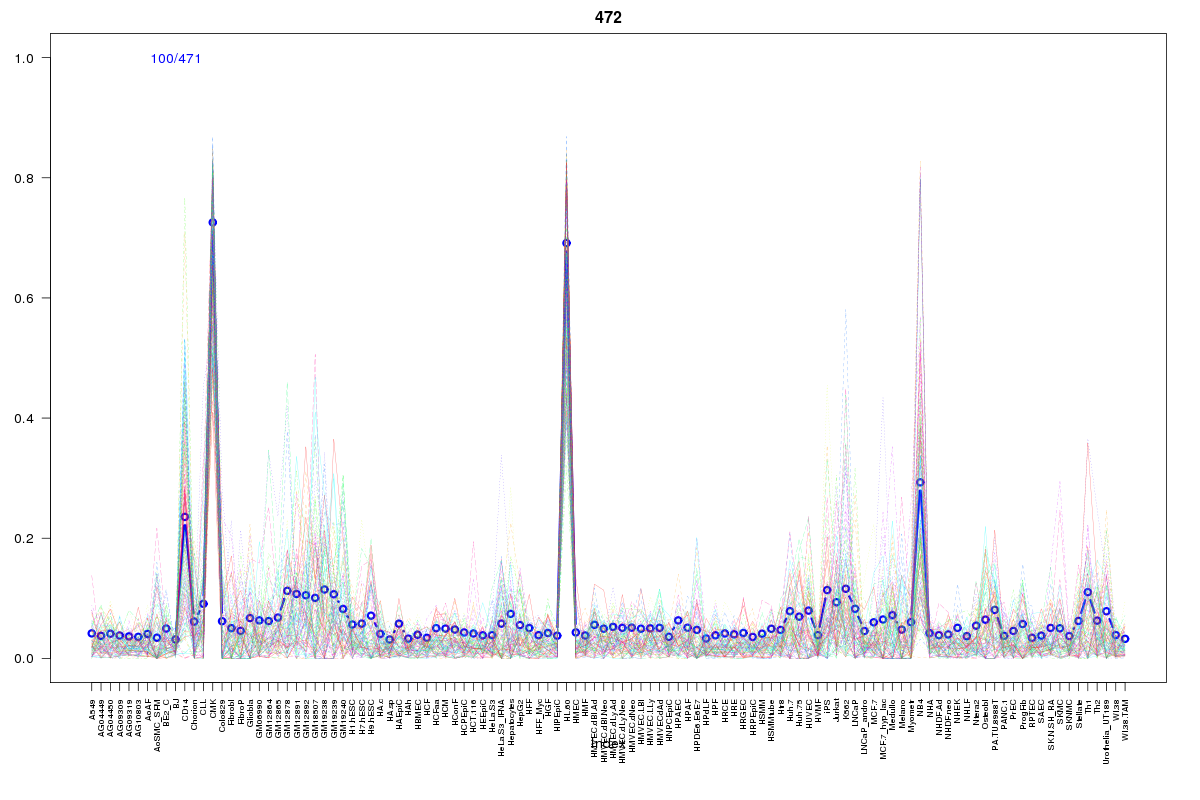 | 472 | 1 |
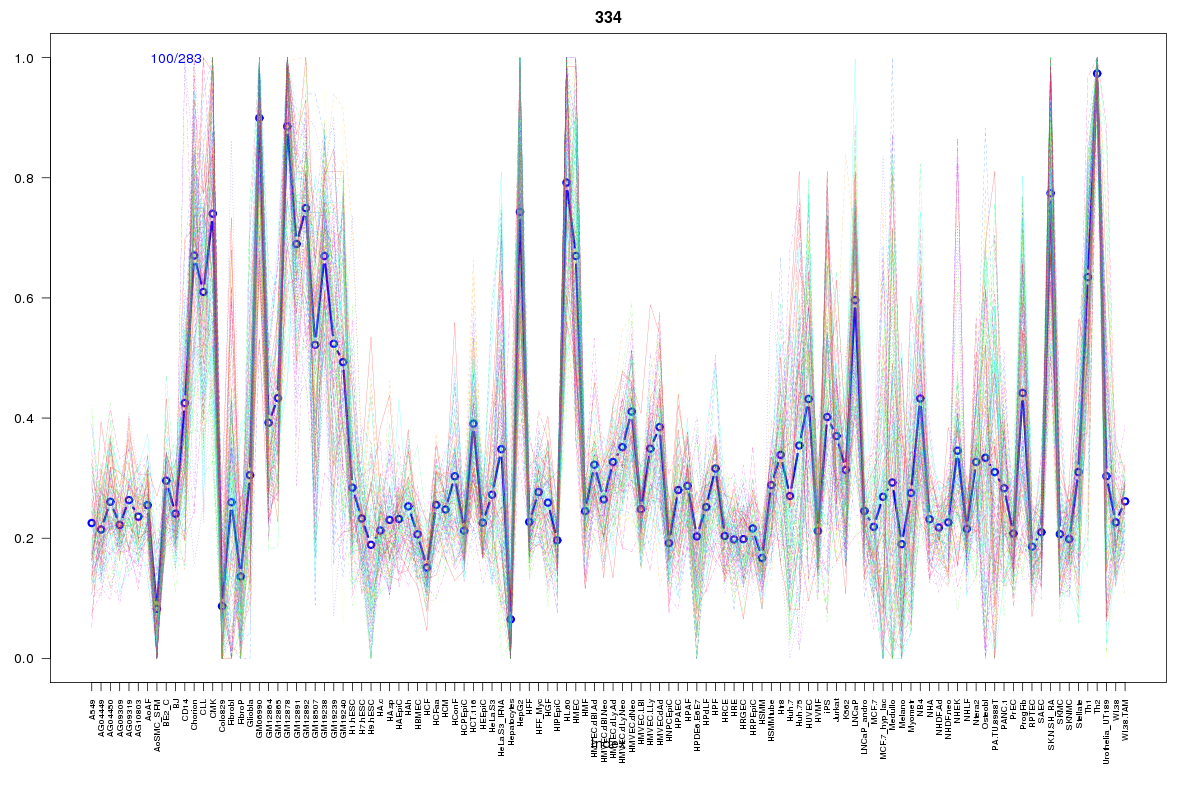 | 334 | 1 |
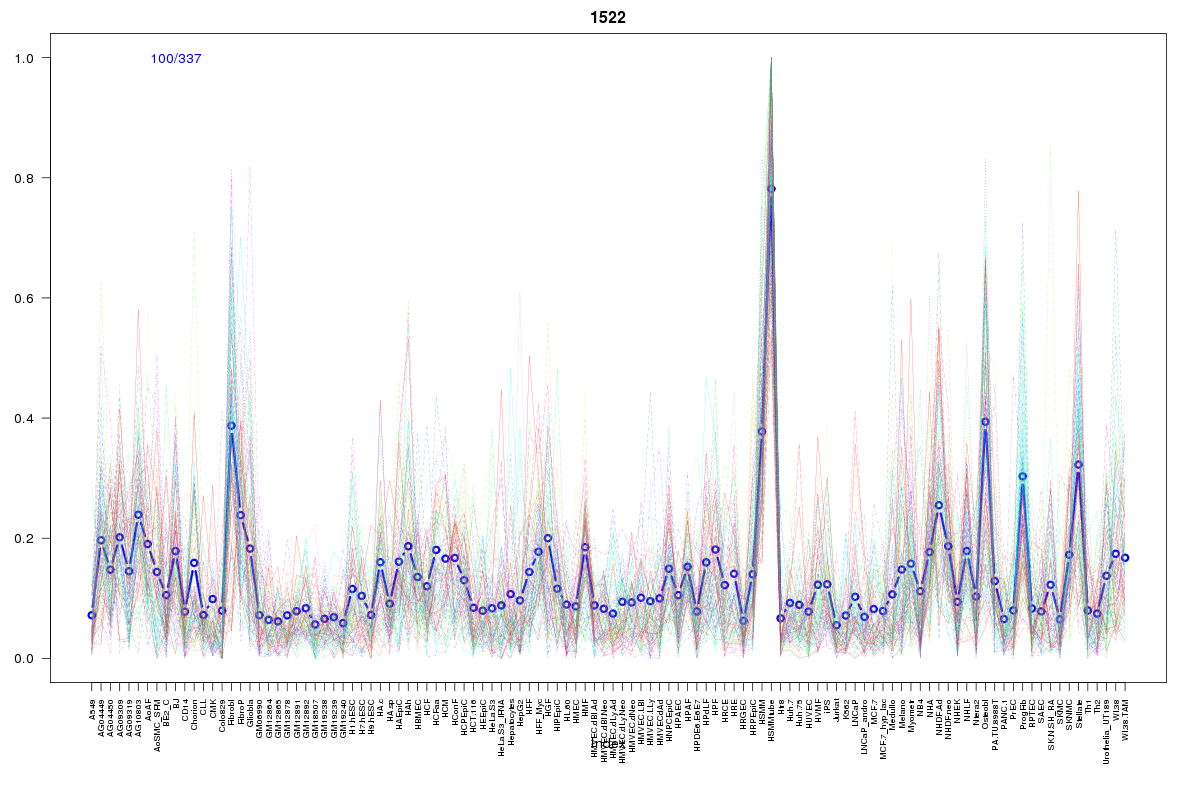 | 1522 | 1 |
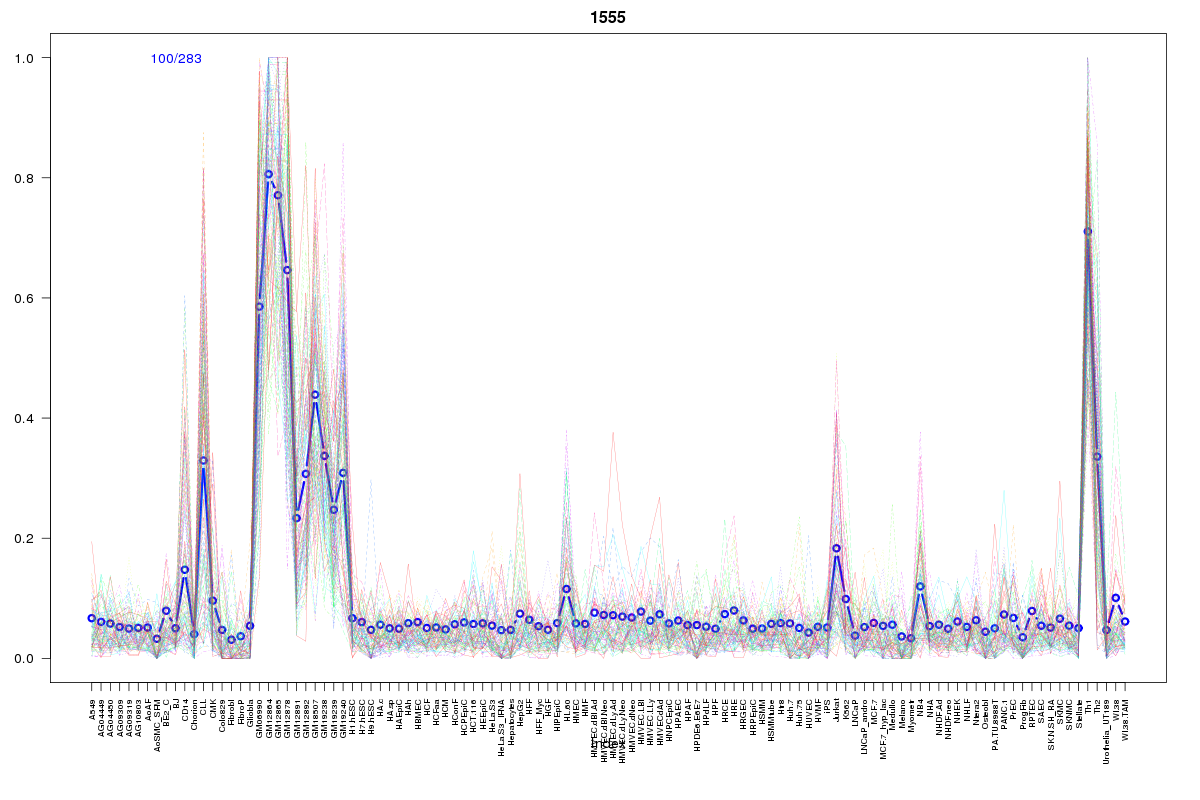 | 1555 | 1 |
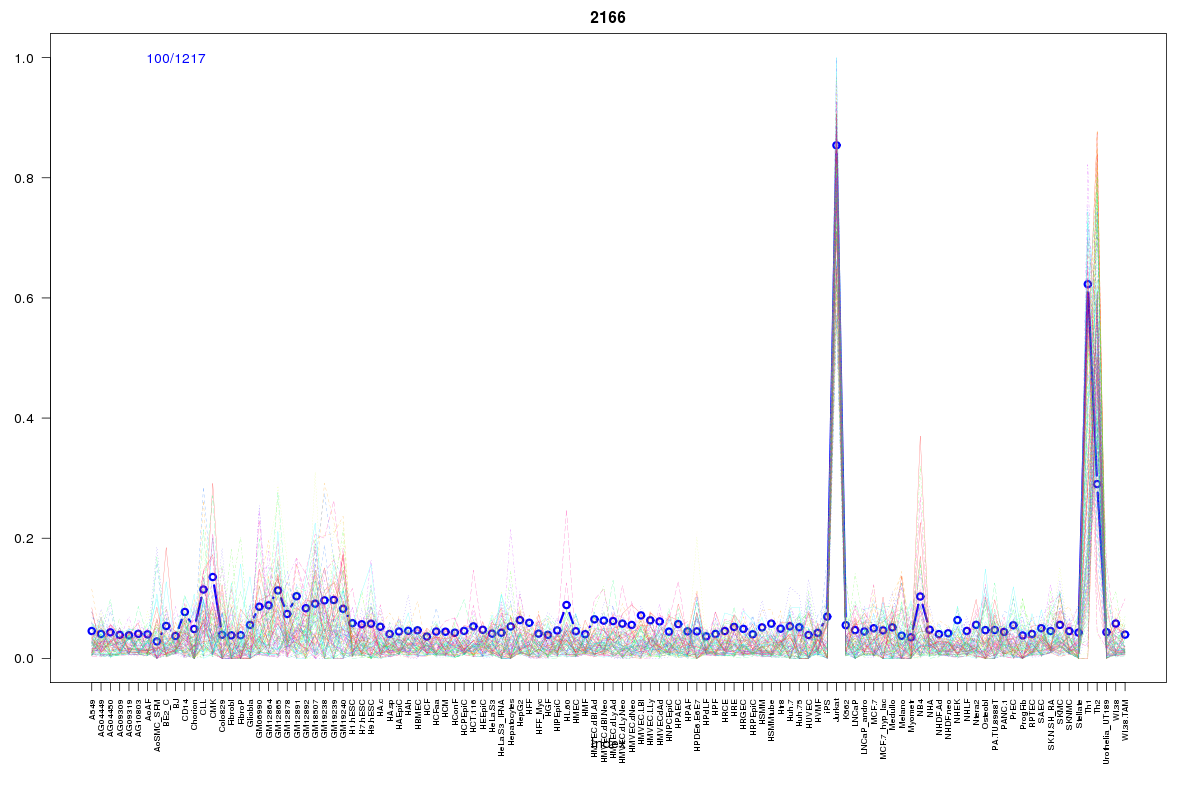 | 2166 | 1 |
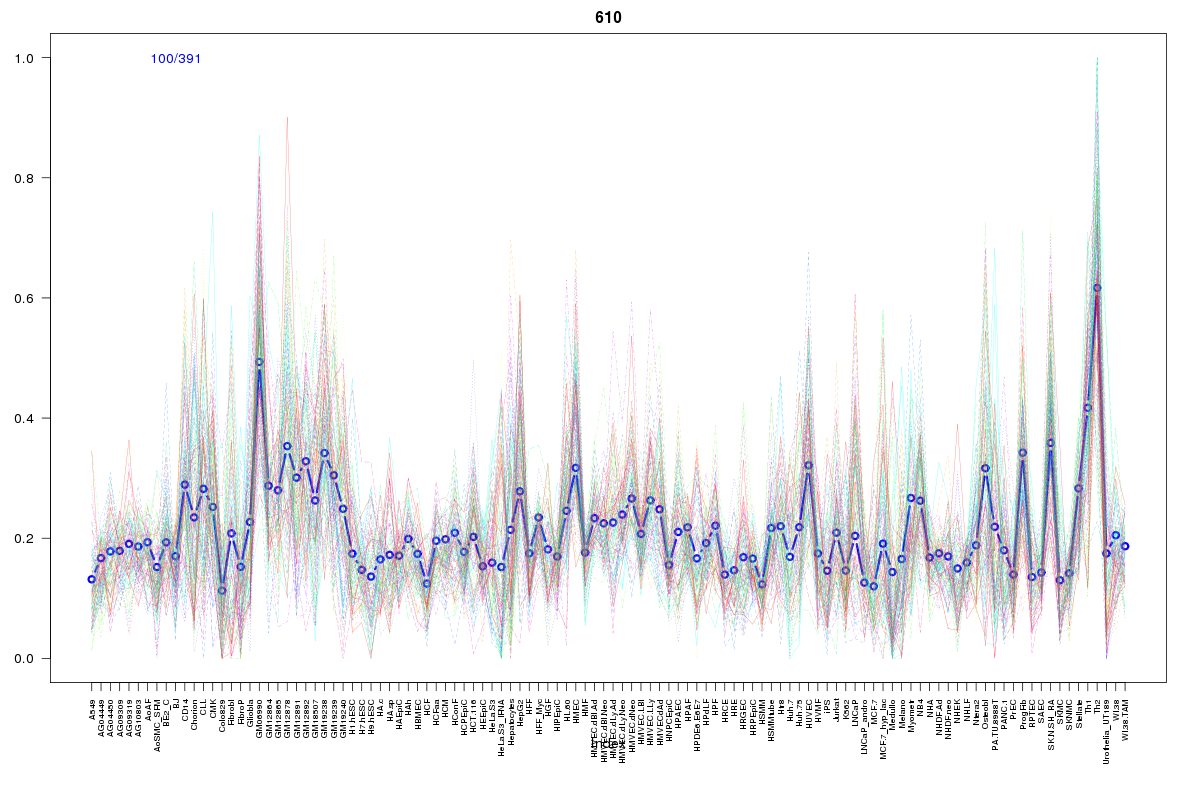 | 610 | 1 |
 | 600 | 1 |
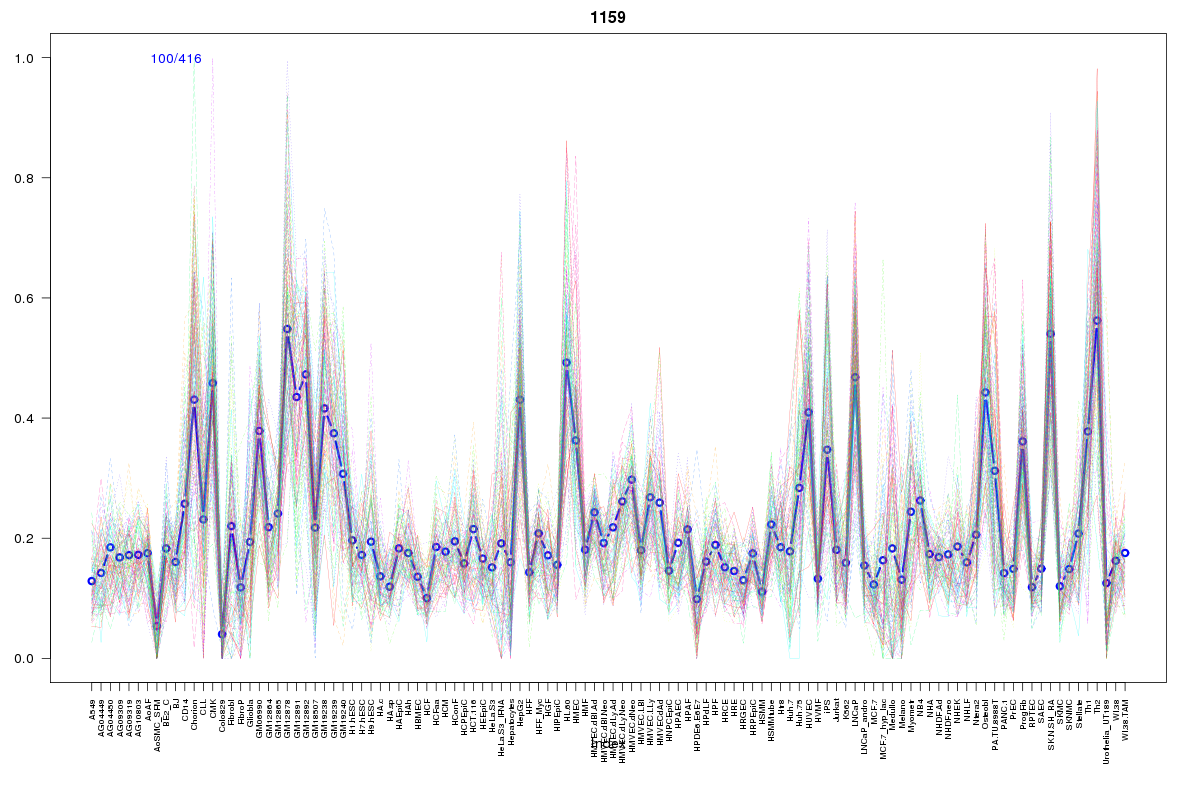 | 1159 | 1 |
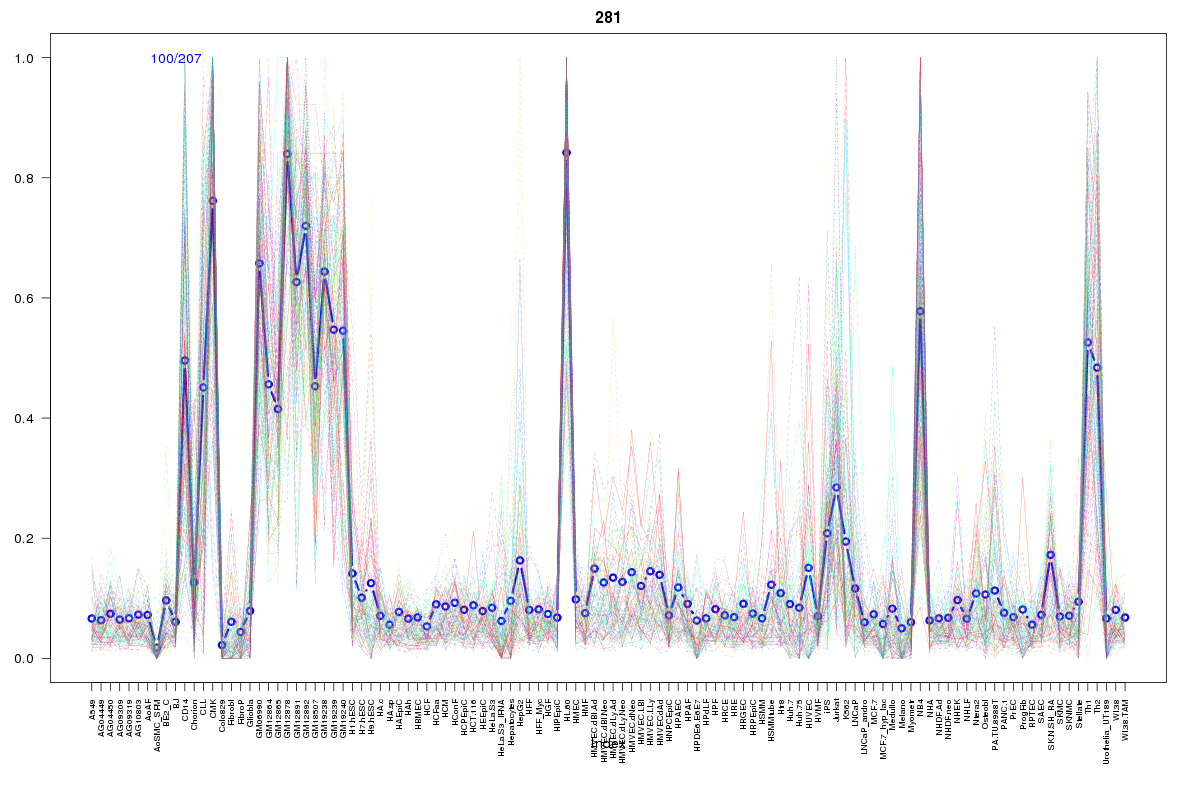 | 281 | 1 |
 | 2063 | 1 |
 | 1424 | 1 |
 | 130 | 1 |
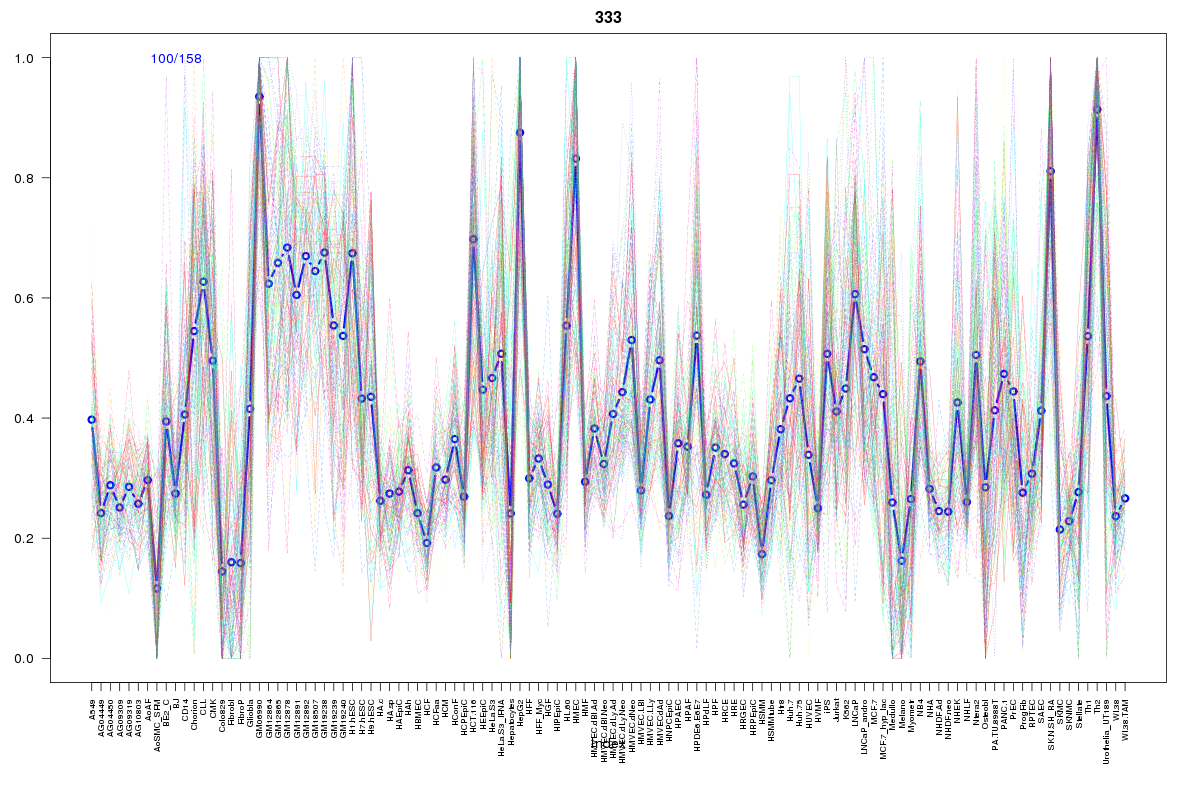 | 333 | 1 |
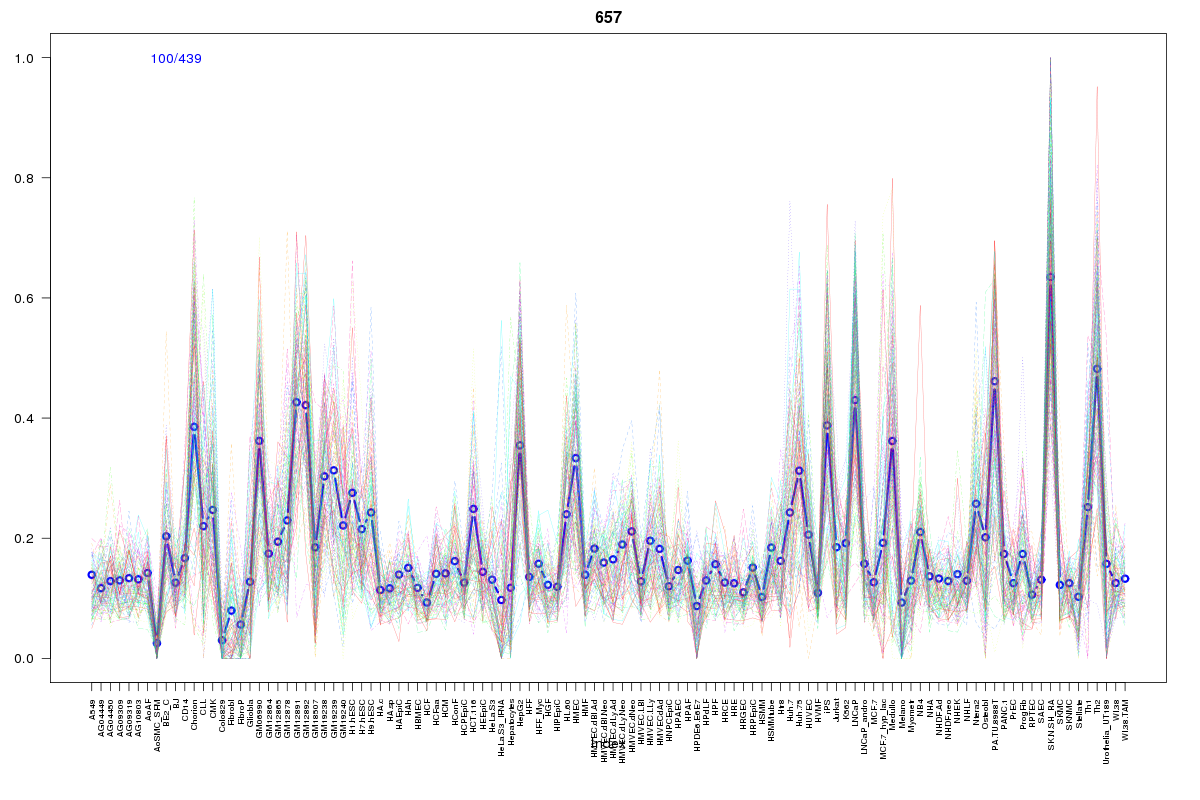 | 657 | 1 |
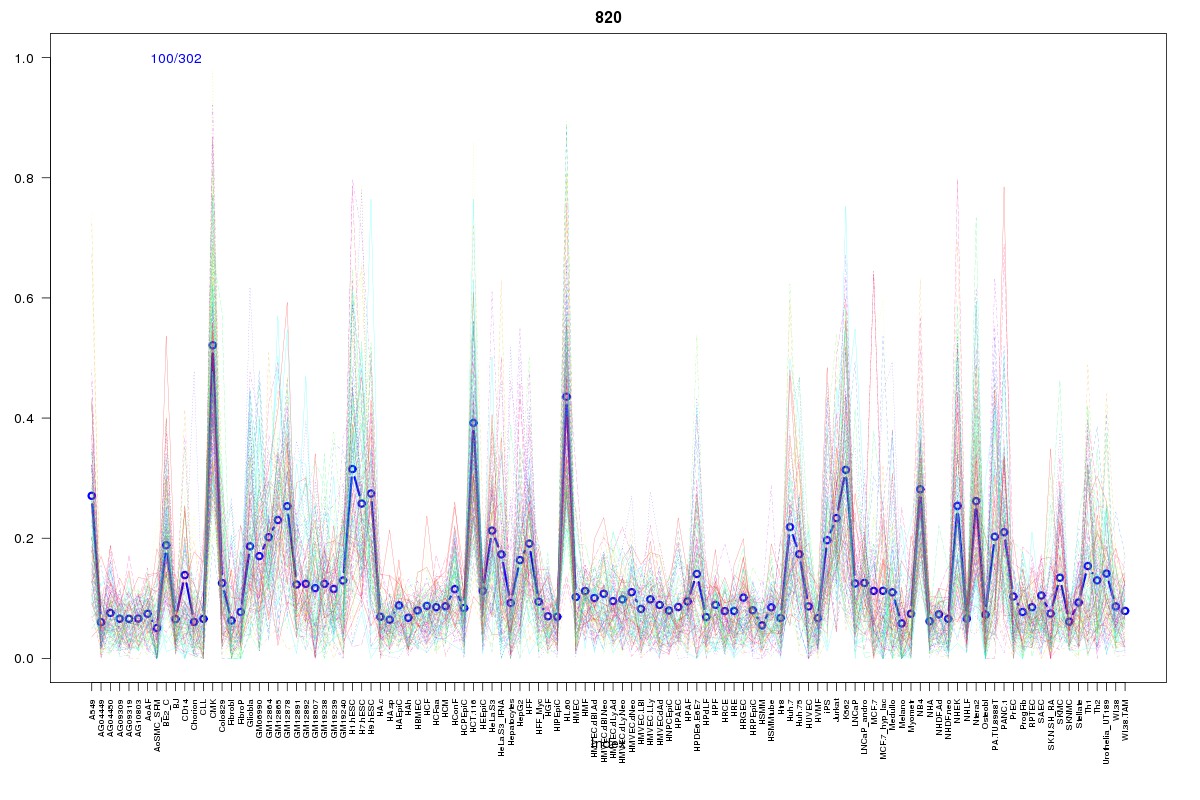 | 820 | 1 |
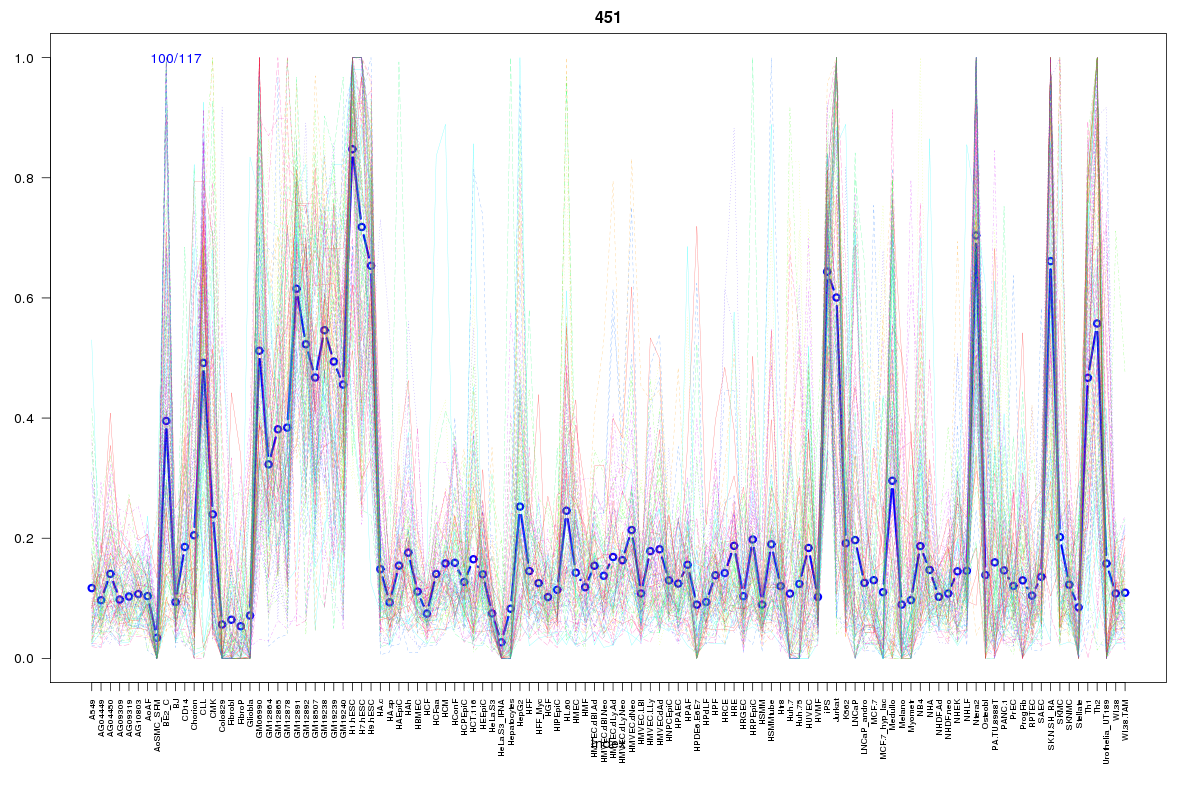 | 451 | 1 |
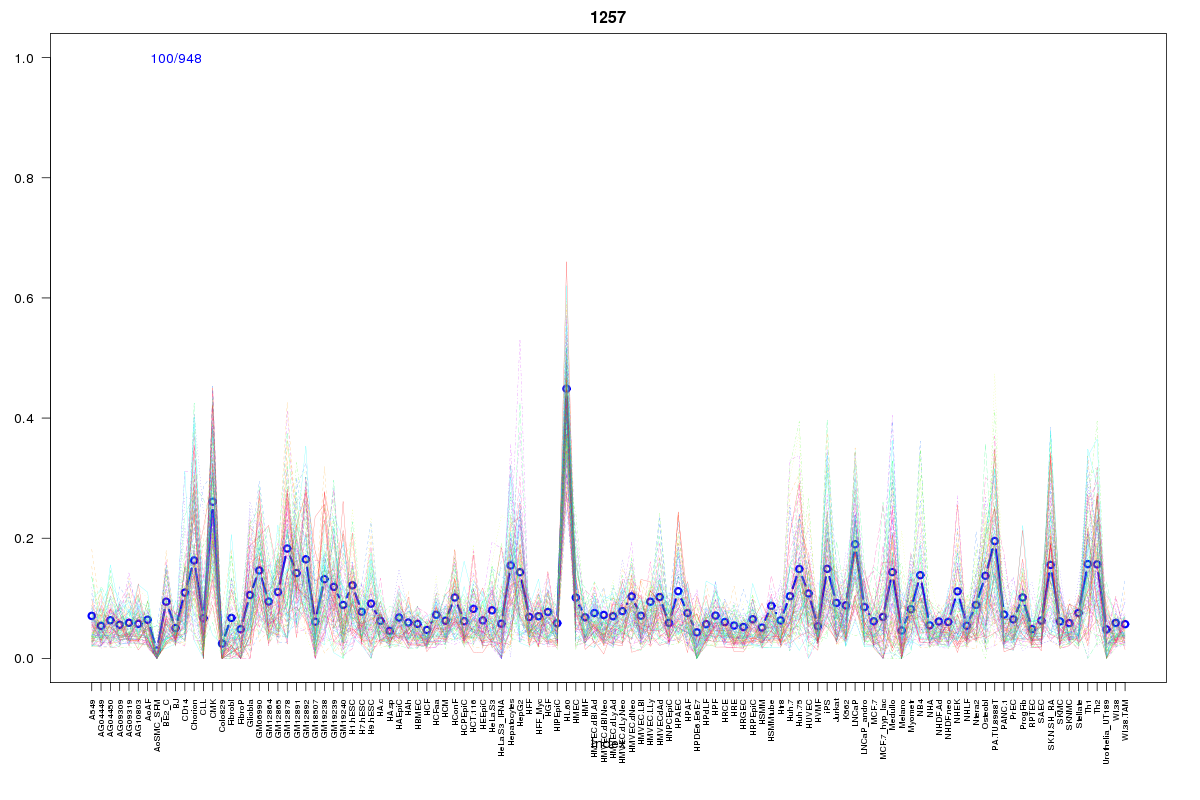 | 1257 | 1 |
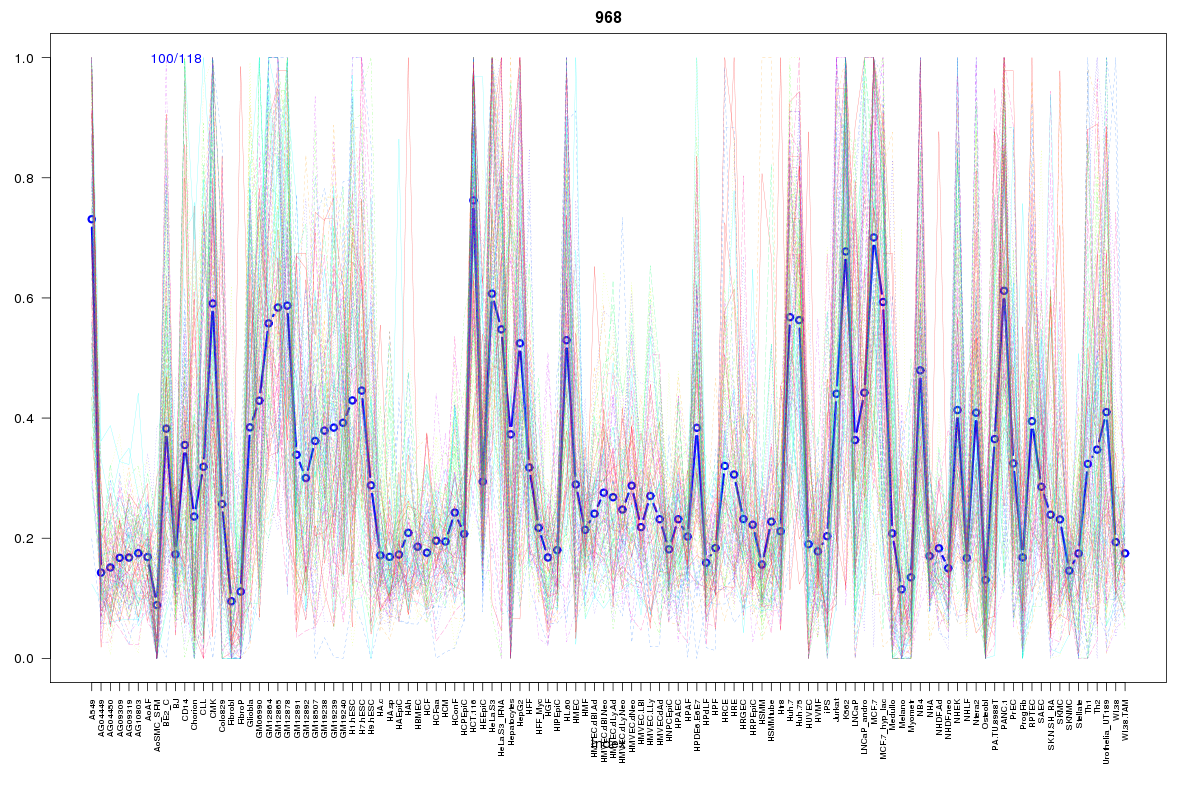 | 968 | 1 |
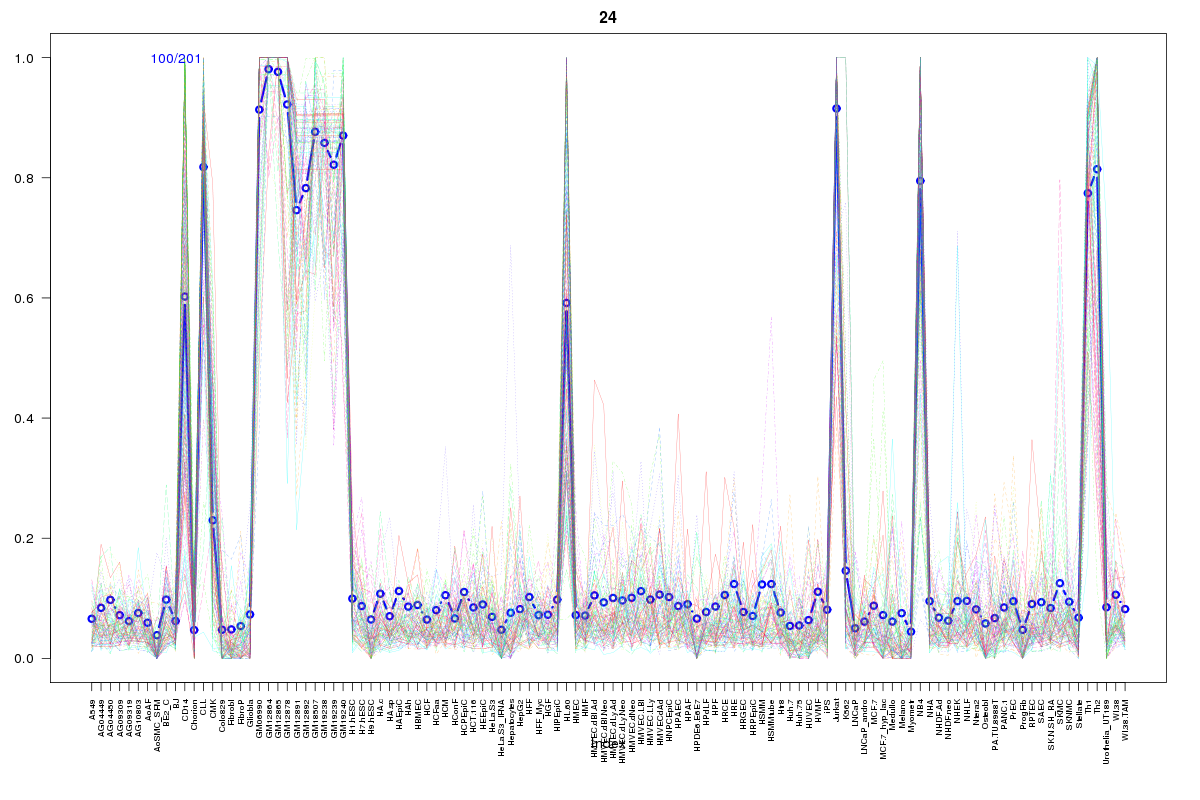 | 24 | 1 |
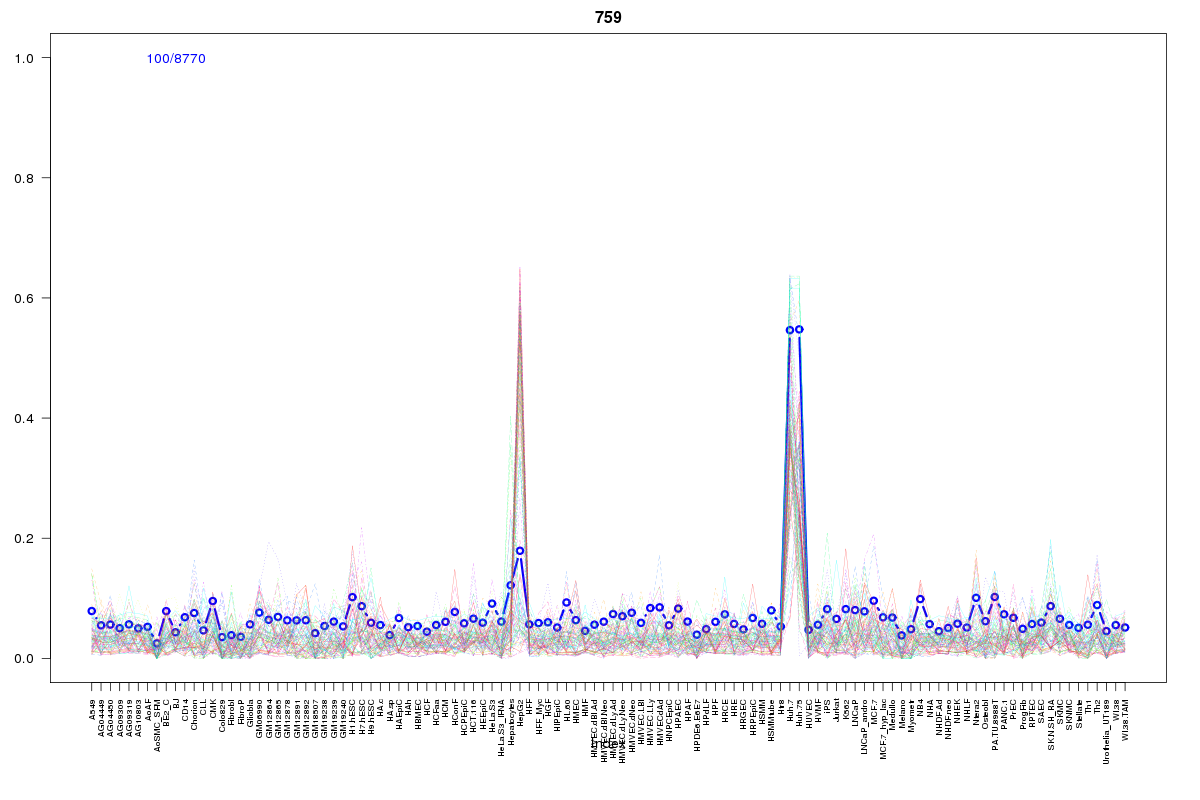 | 759 | 1 |
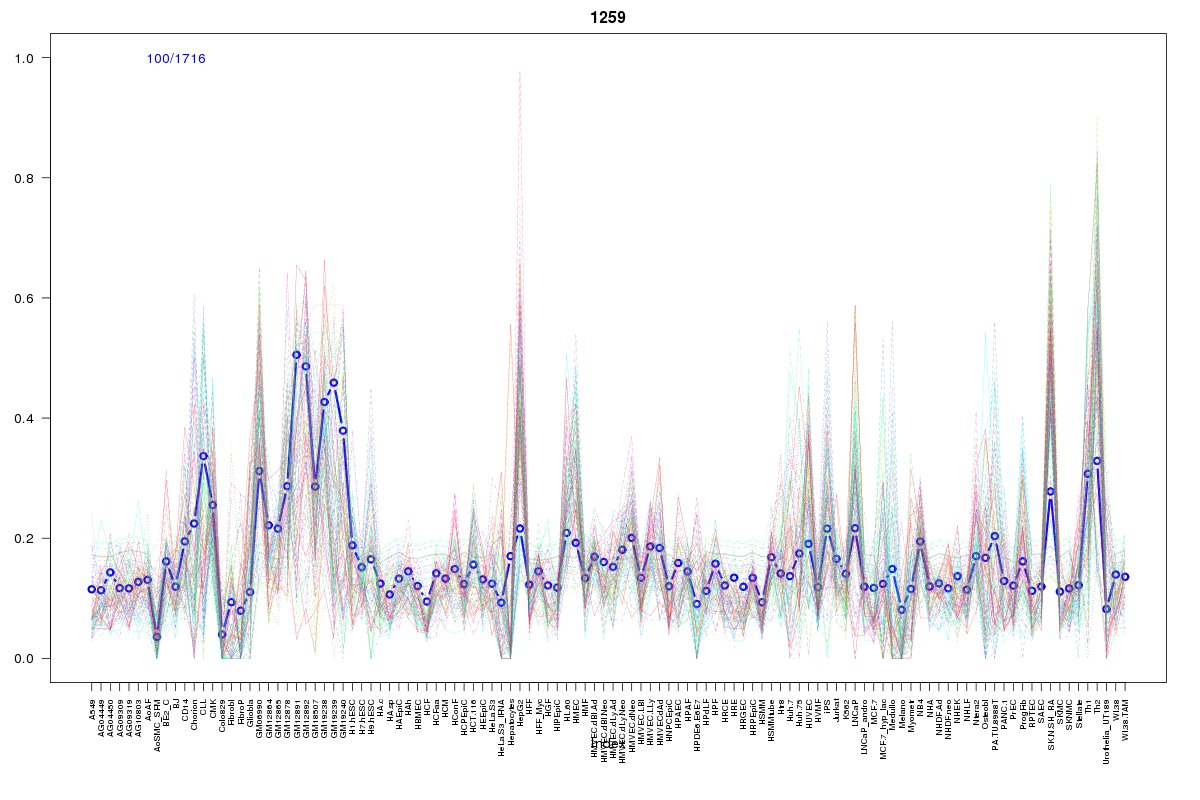 | 1259 | 1 |
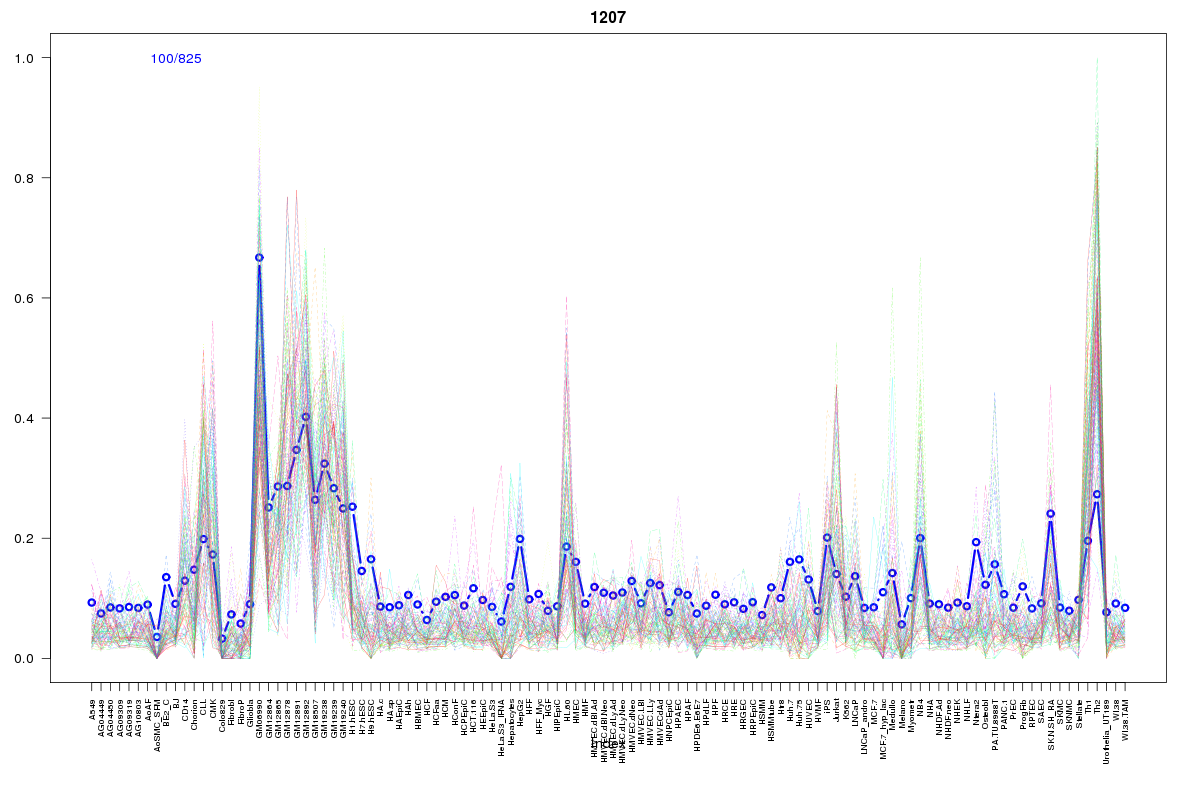 | 1207 | 1 |
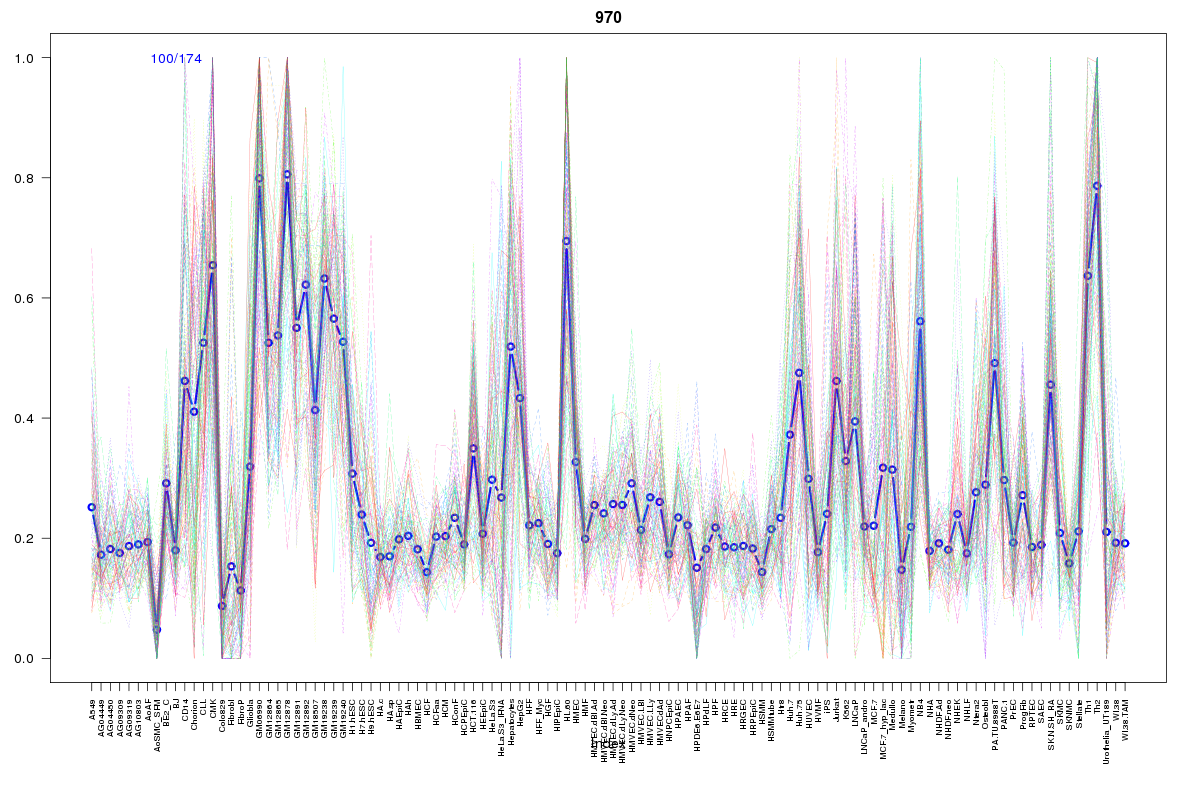 | 970 | 1 |
 | 604 | 1 |
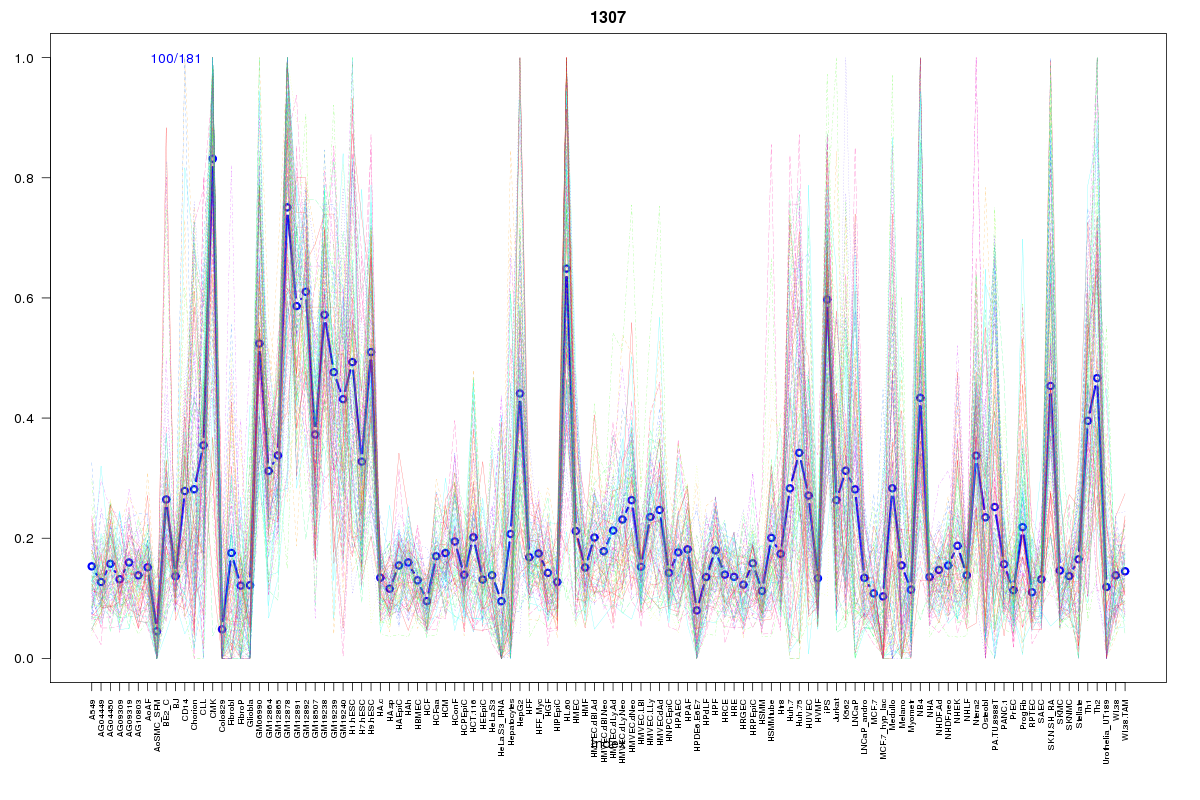 | 1307 | 1 |
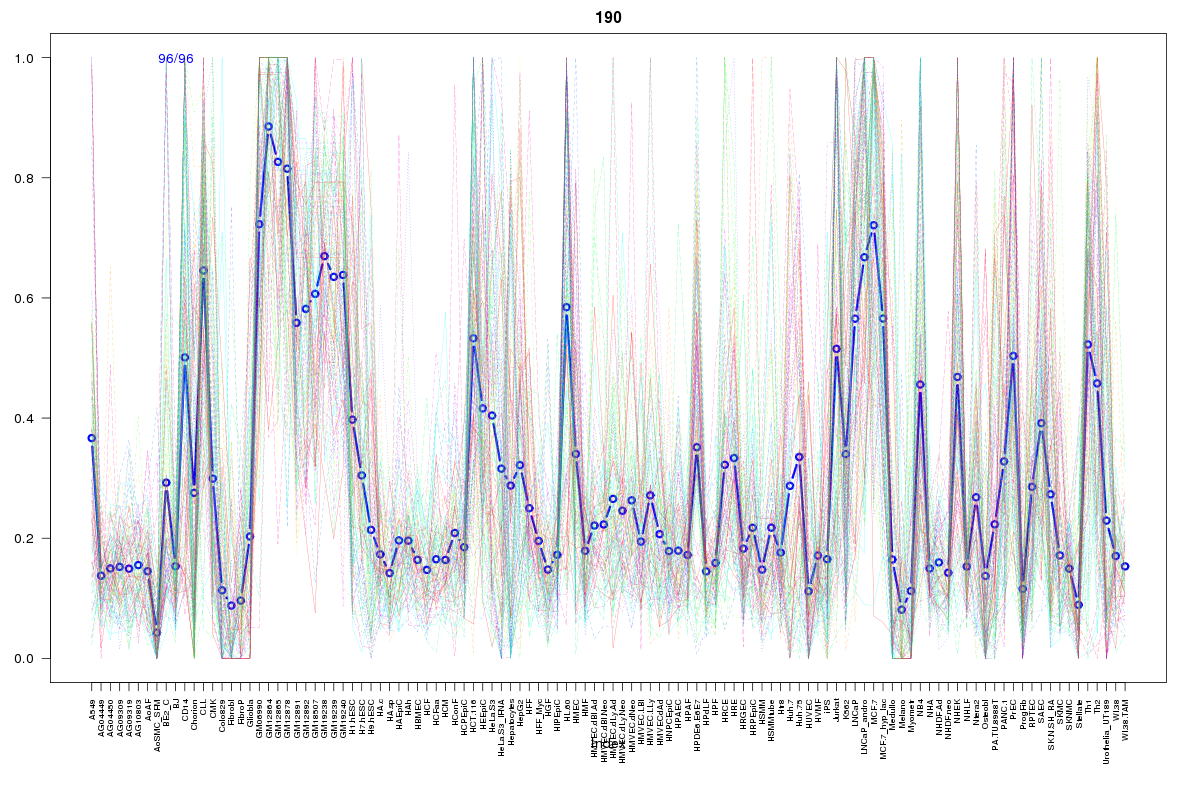 | 190 | 1 |
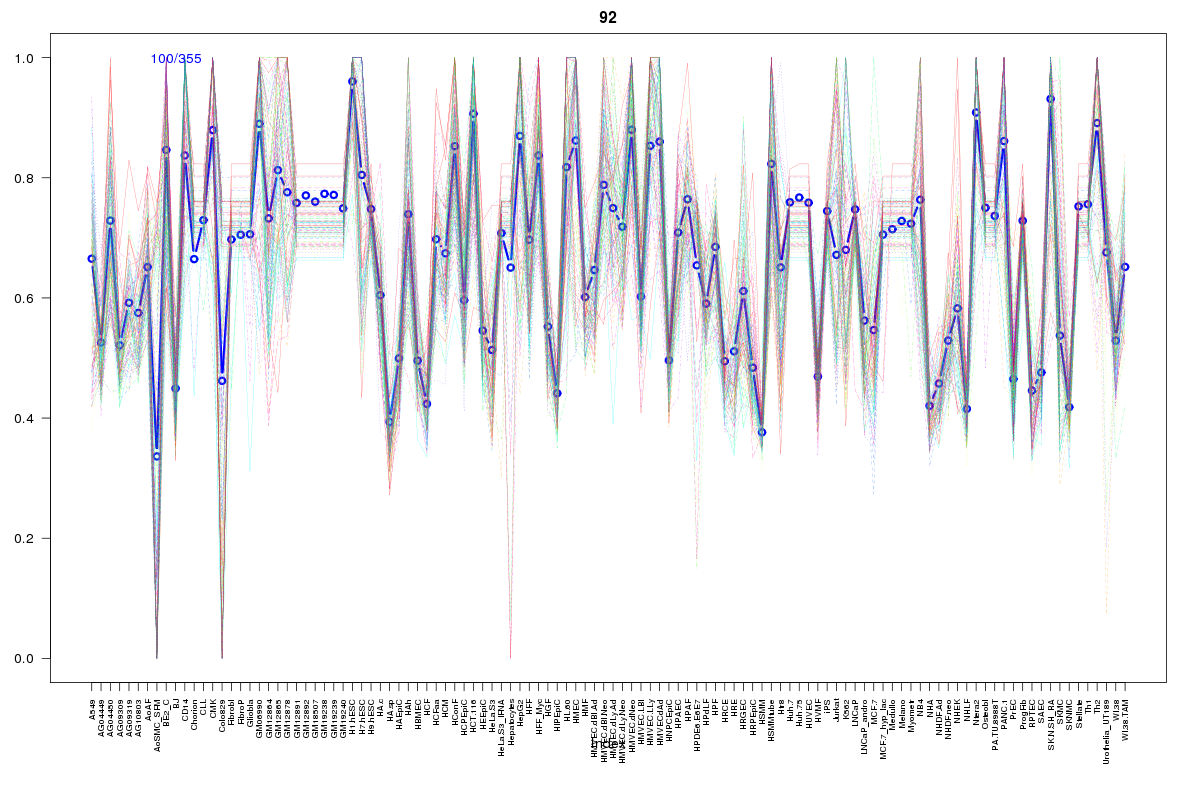 | 92 | 1 |
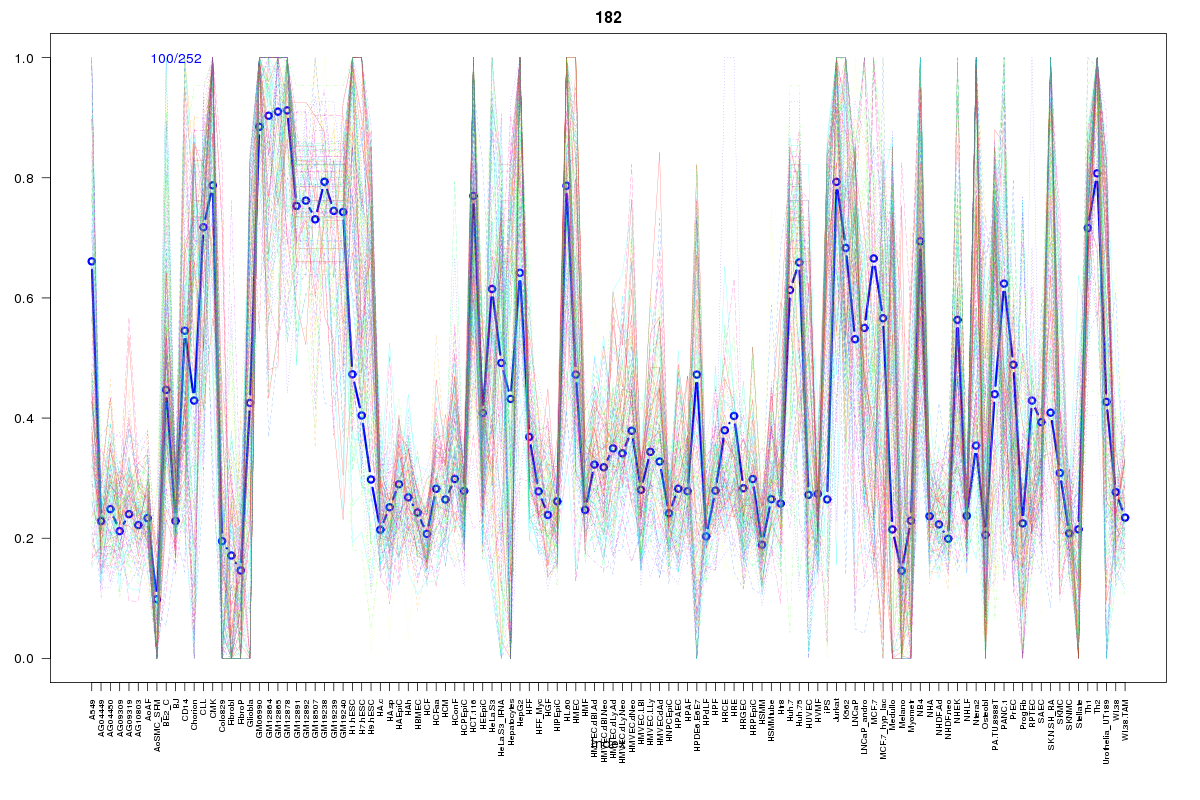 | 182 | 1 |
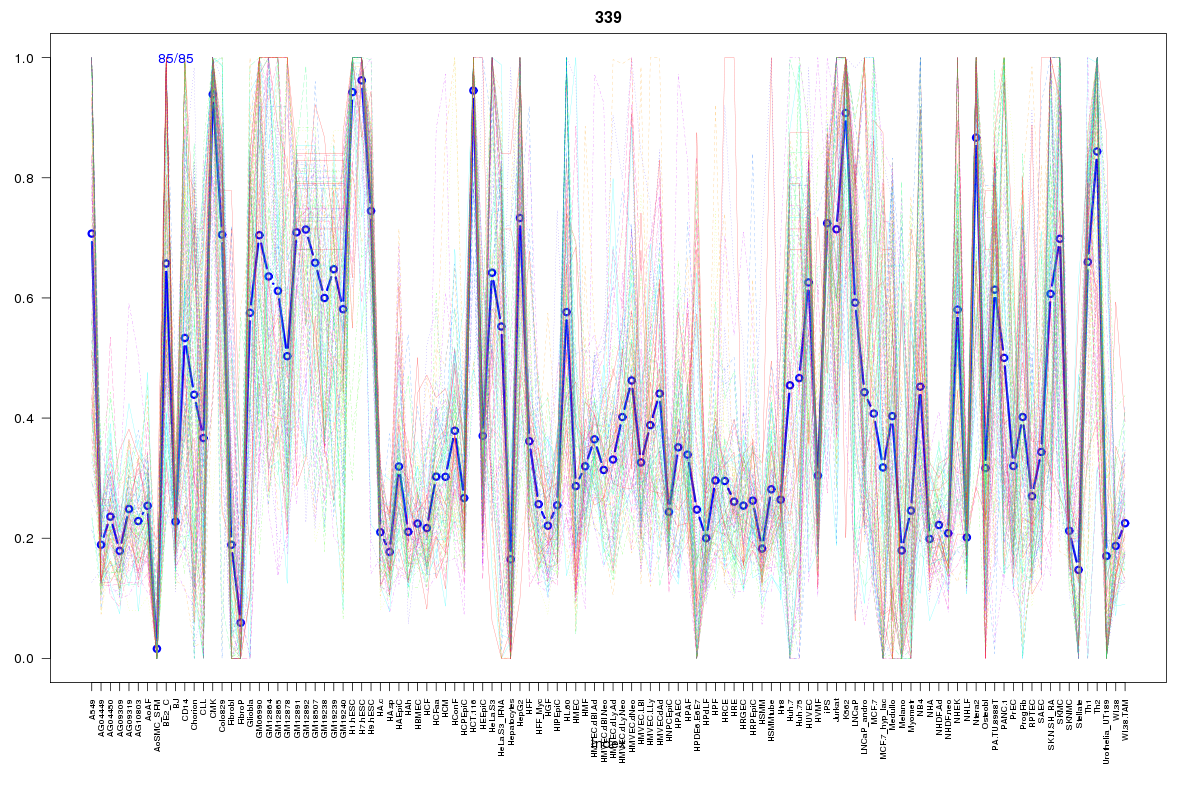 | 339 | 1 |
Resources
BED file downloads
Connects to 97 DHS sitesTop 10 Correlated DHS Sites
p-values indiciate significant higher or lower correlationExternal Databases
UCSCEnsembl (ENSG00000111669)