Gene: APOC3
chr11: 116700421-116701598Expression Profile
(log scale)
Graphical Connections
Distribution of linked clusters:
You may find it interesting if many of the connected DHS sites belong to the same cluster.| Cluster Profile | Cluster ID | Number of DHS sites in this cluster |
|---|---|---|
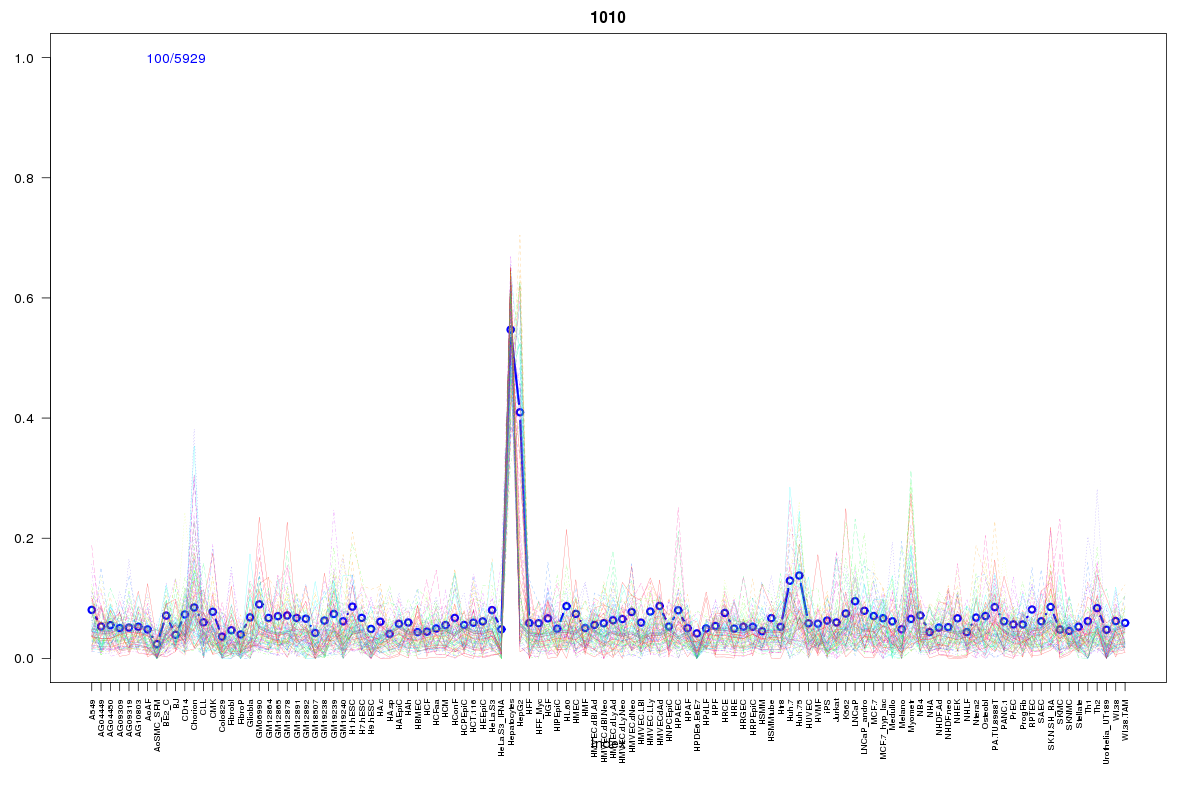 | 1010 | 8 |
 | 1355 | 8 |
 | 927 | 6 |
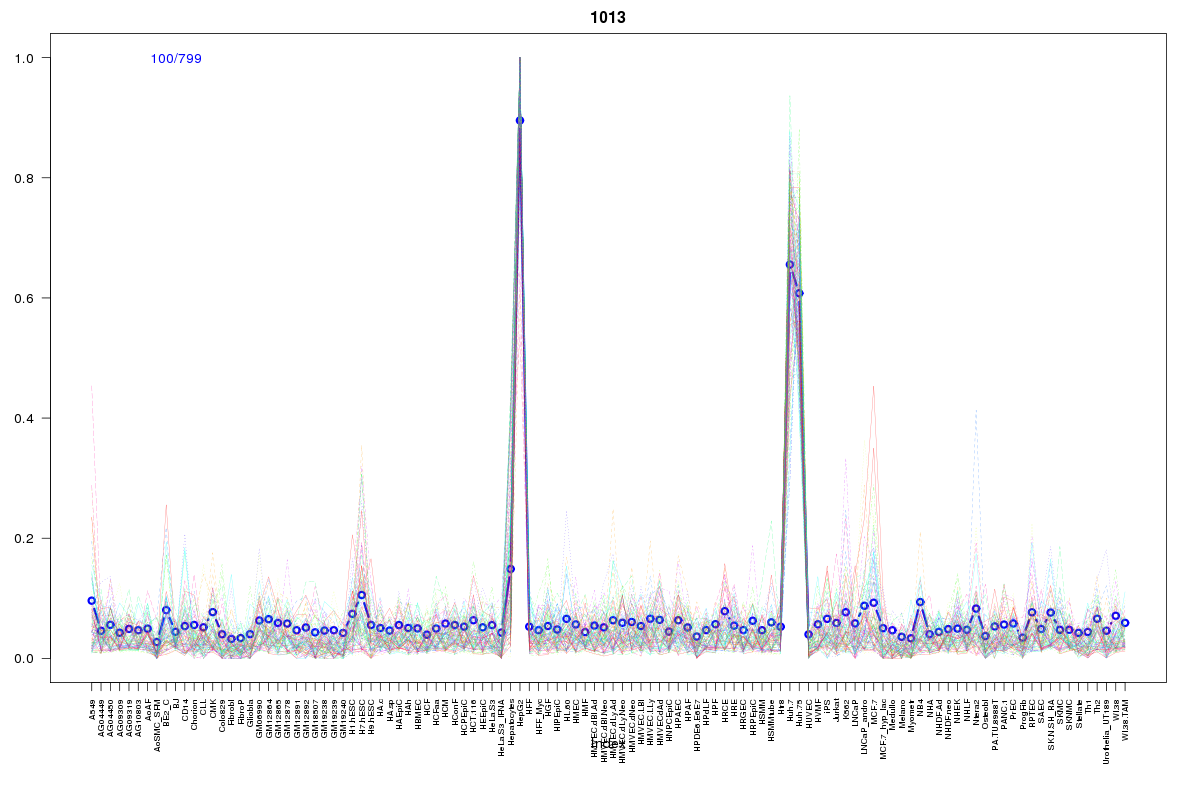 | 1013 | 3 |
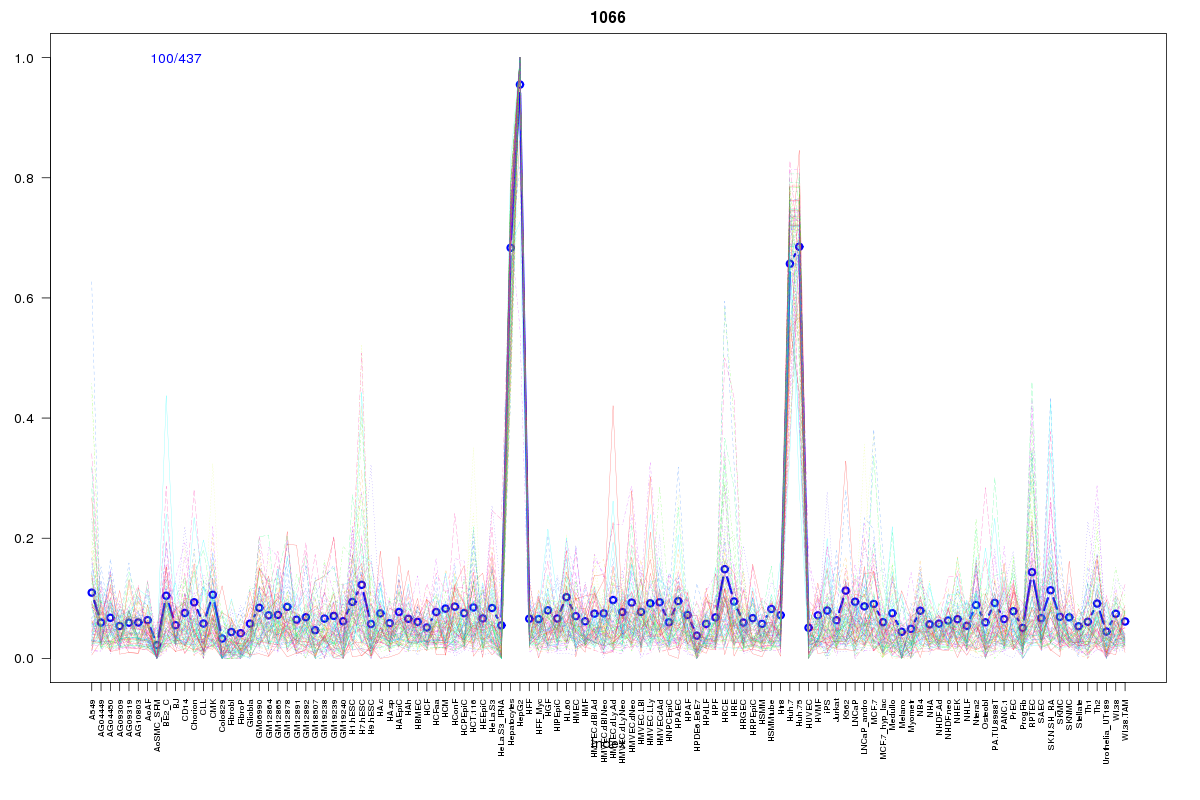 | 1066 | 3 |
 | 1008 | 3 |
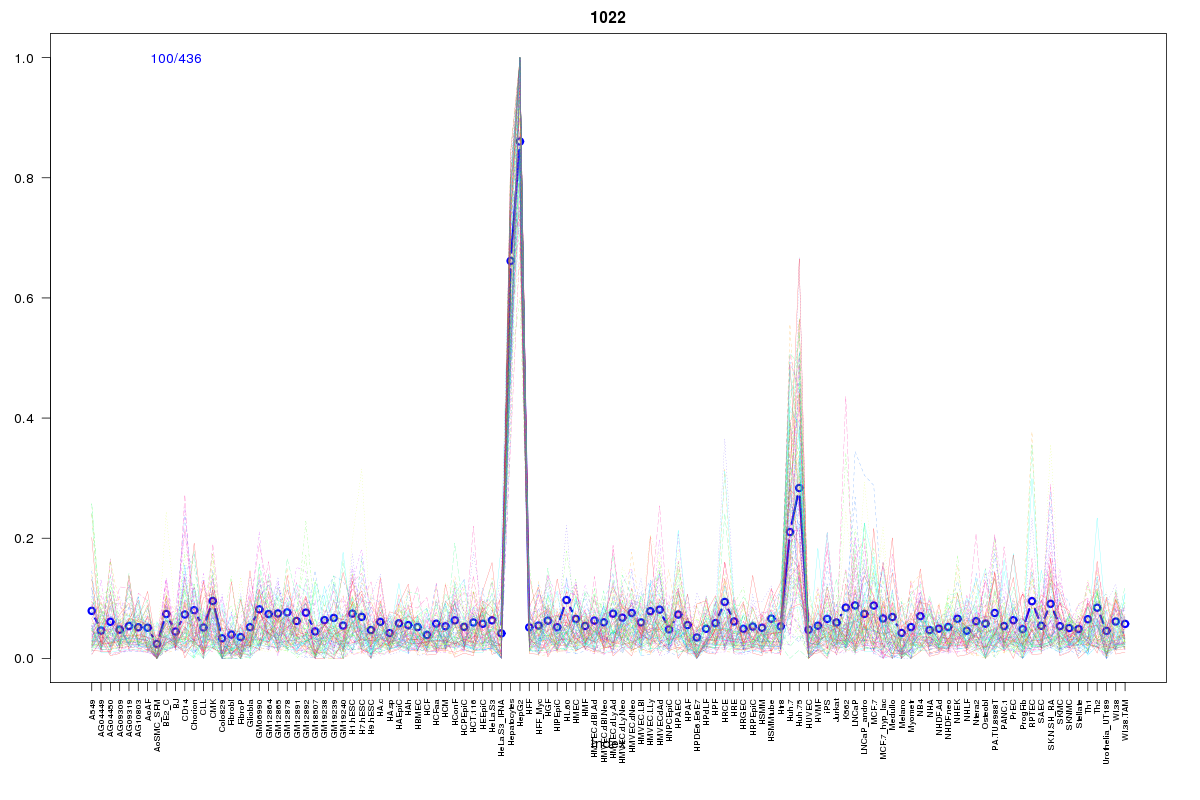 | 1022 | 3 |
 | 2072 | 2 |
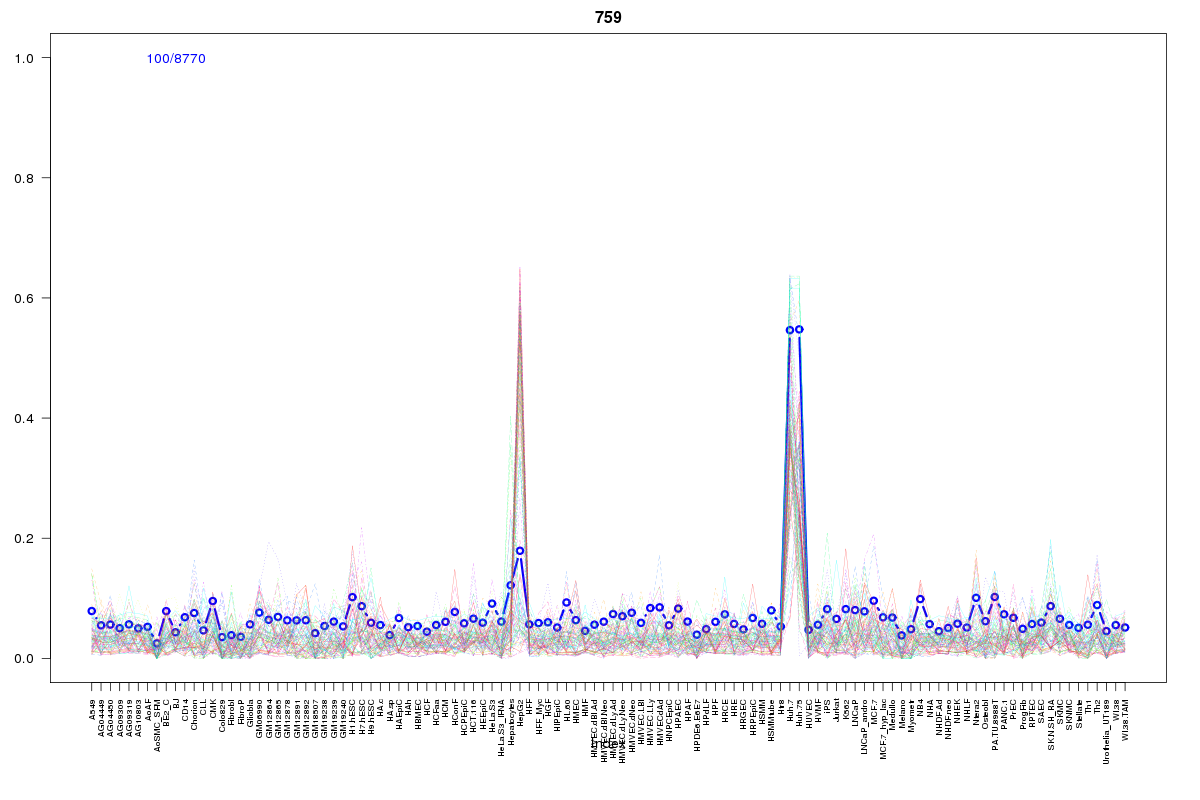 | 759 | 2 |
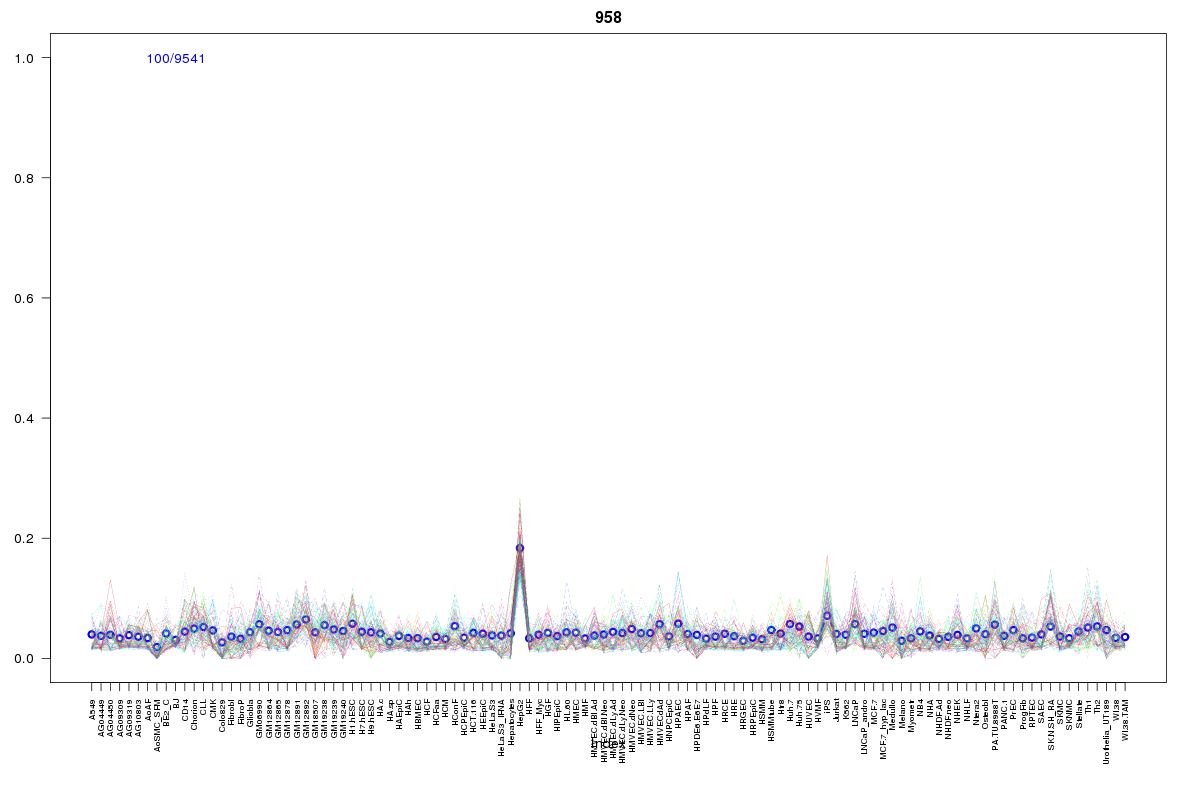 | 958 | 2 |
 | 430 | 2 |
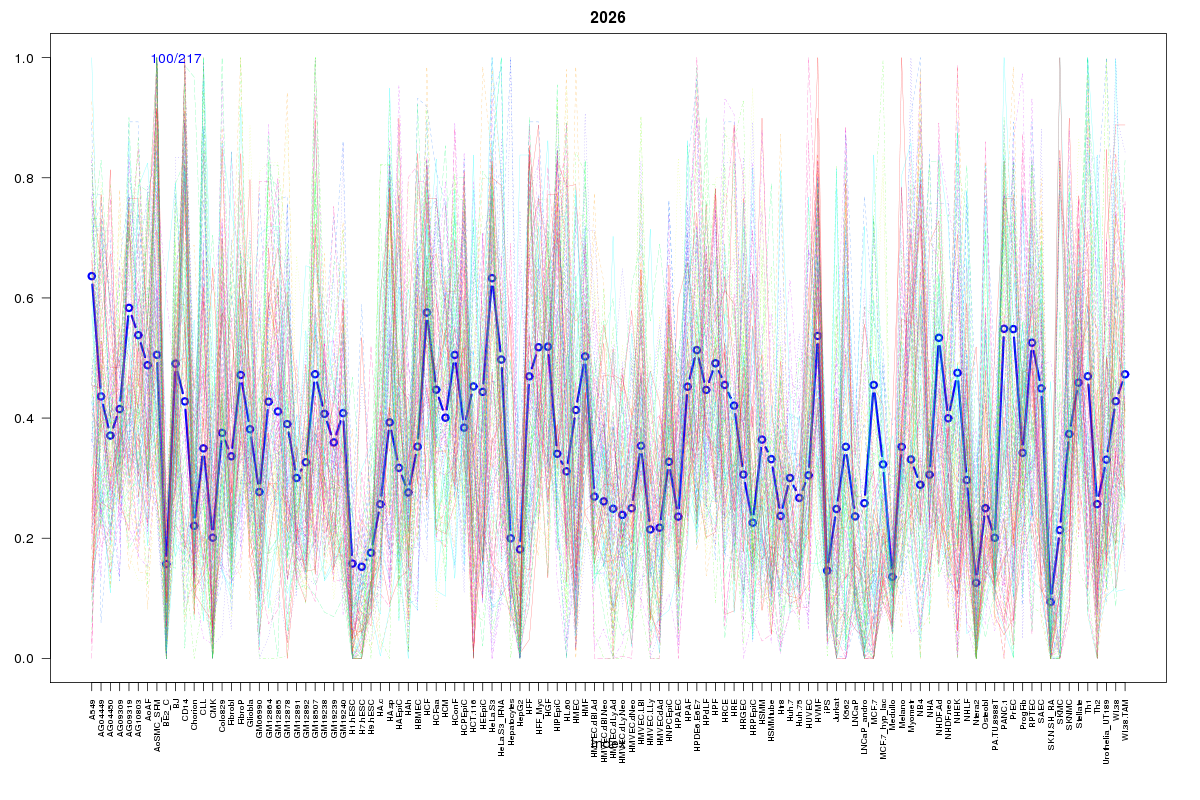 | 2026 | 1 |
 | 910 | 1 |
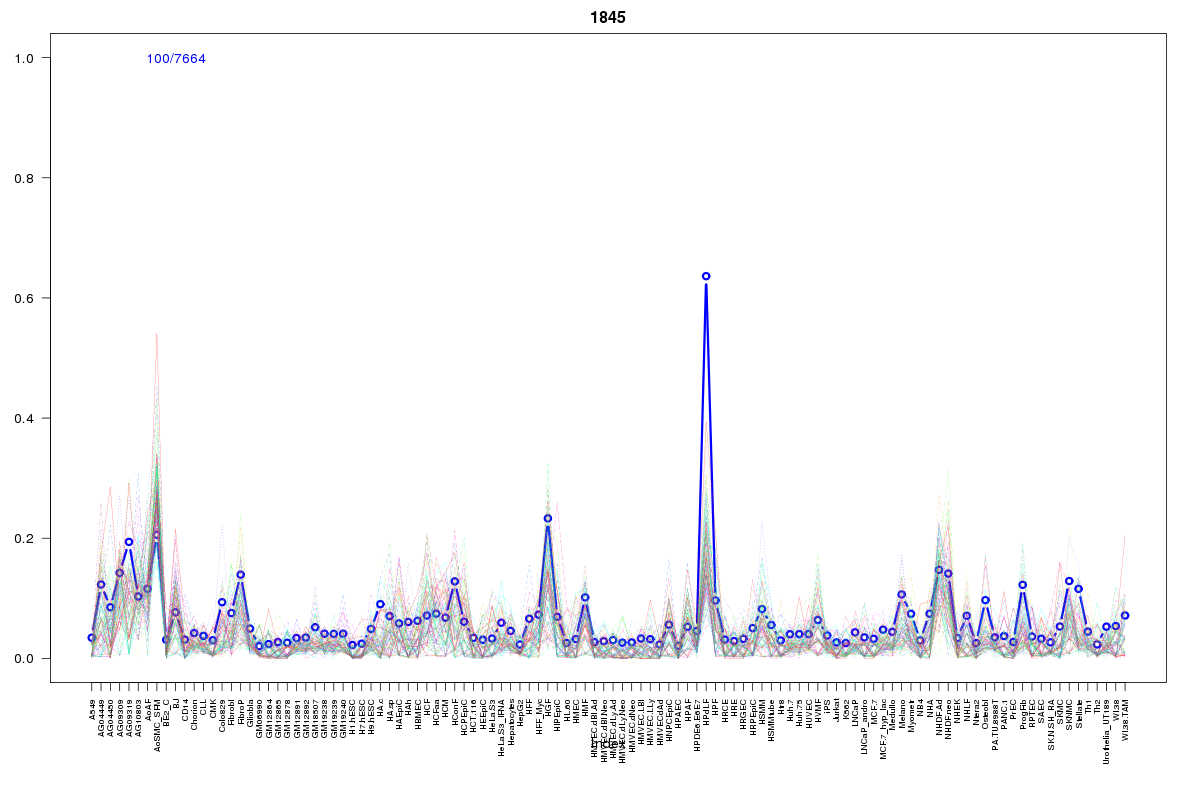 | 1845 | 1 |
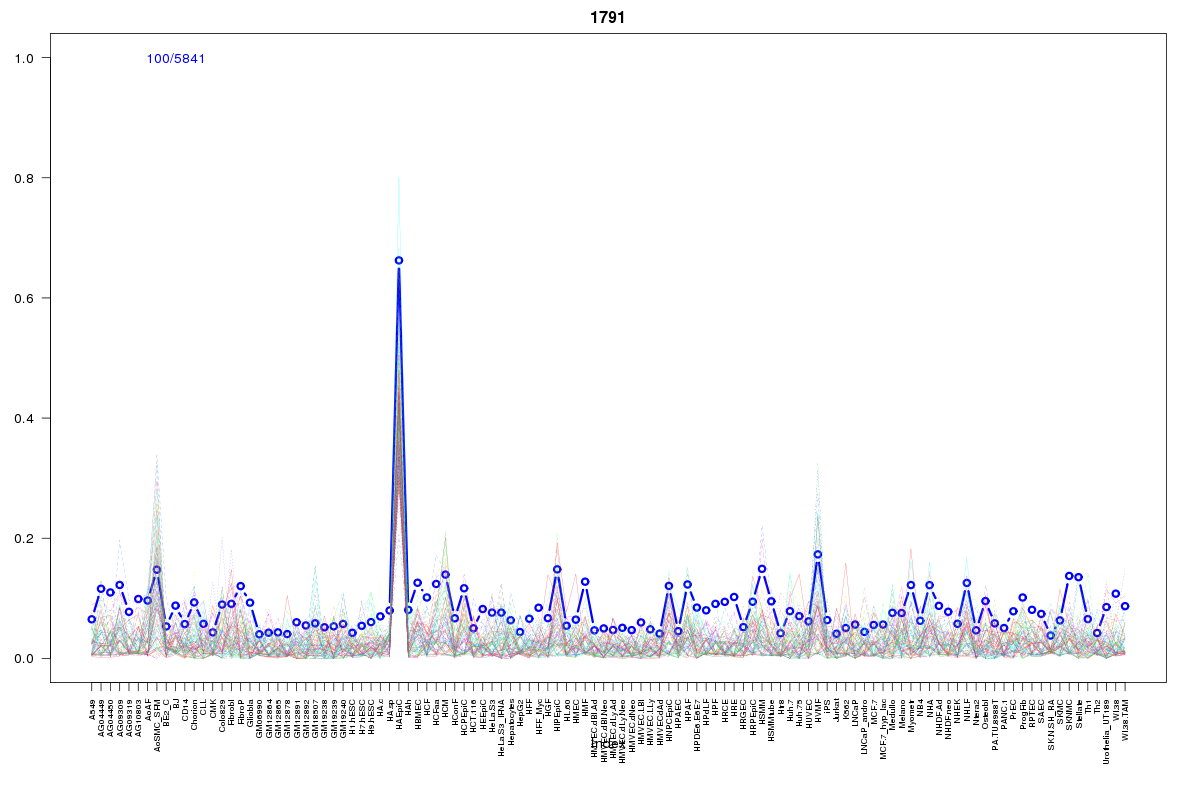 | 1791 | 1 |
 | 15 | 1 |
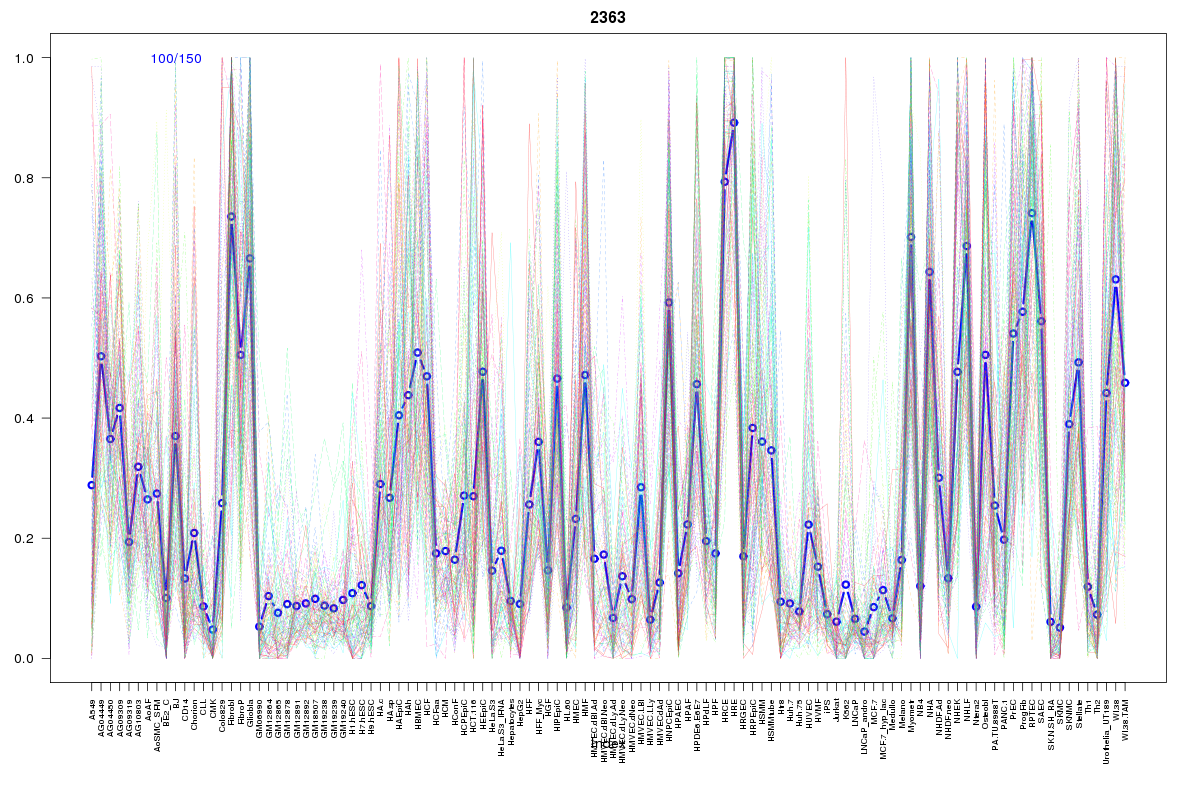 | 2363 | 1 |
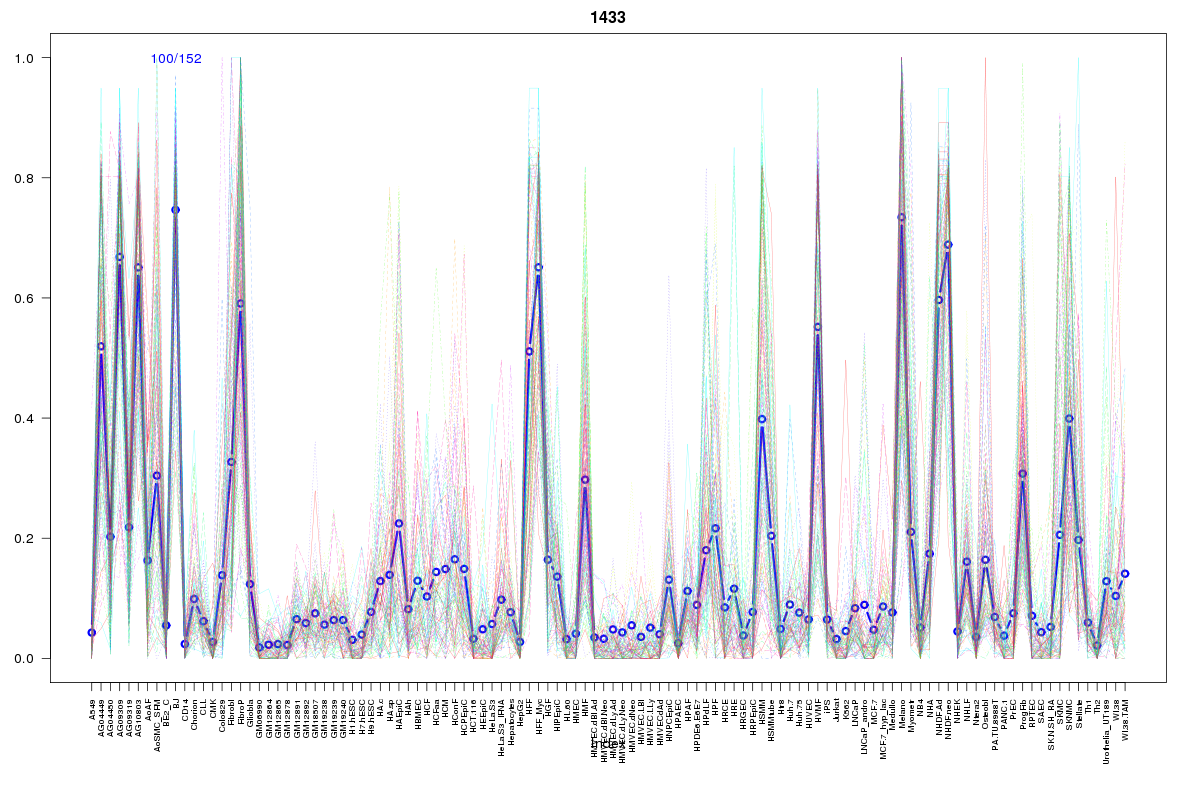 | 1433 | 1 |
 | 1388 | 1 |
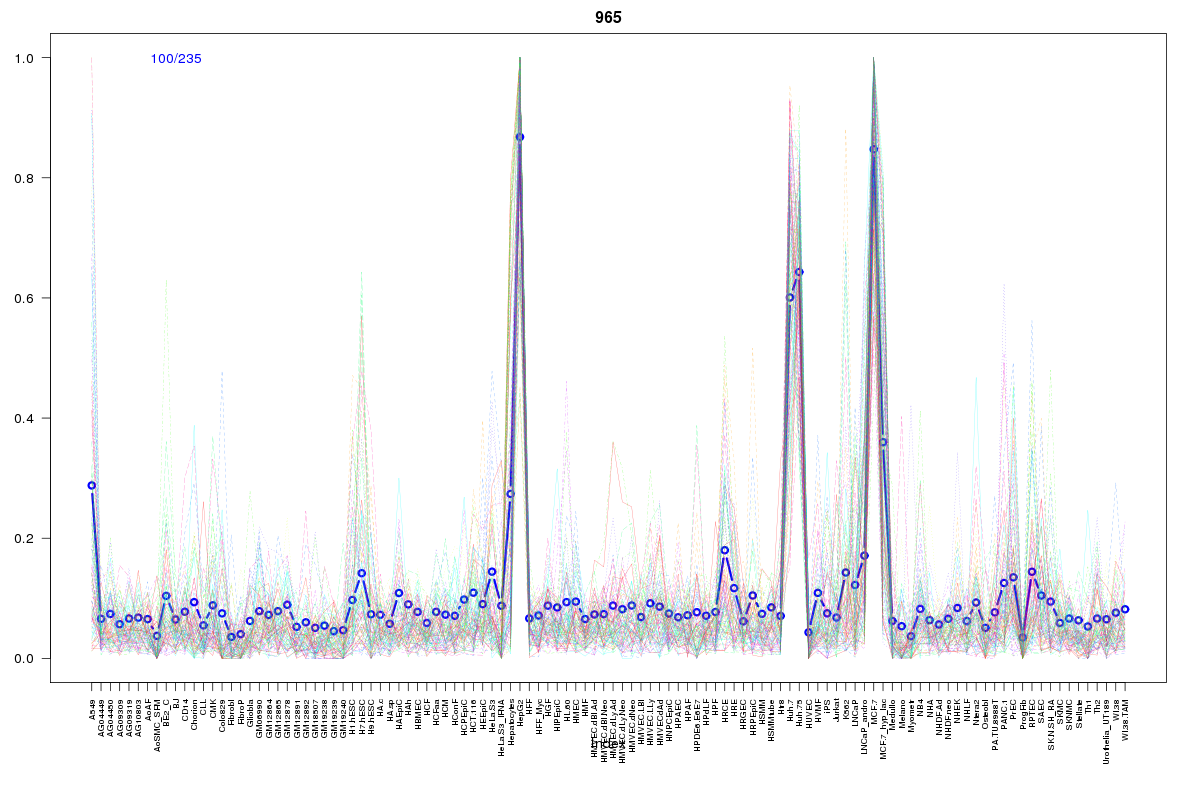 | 965 | 1 |
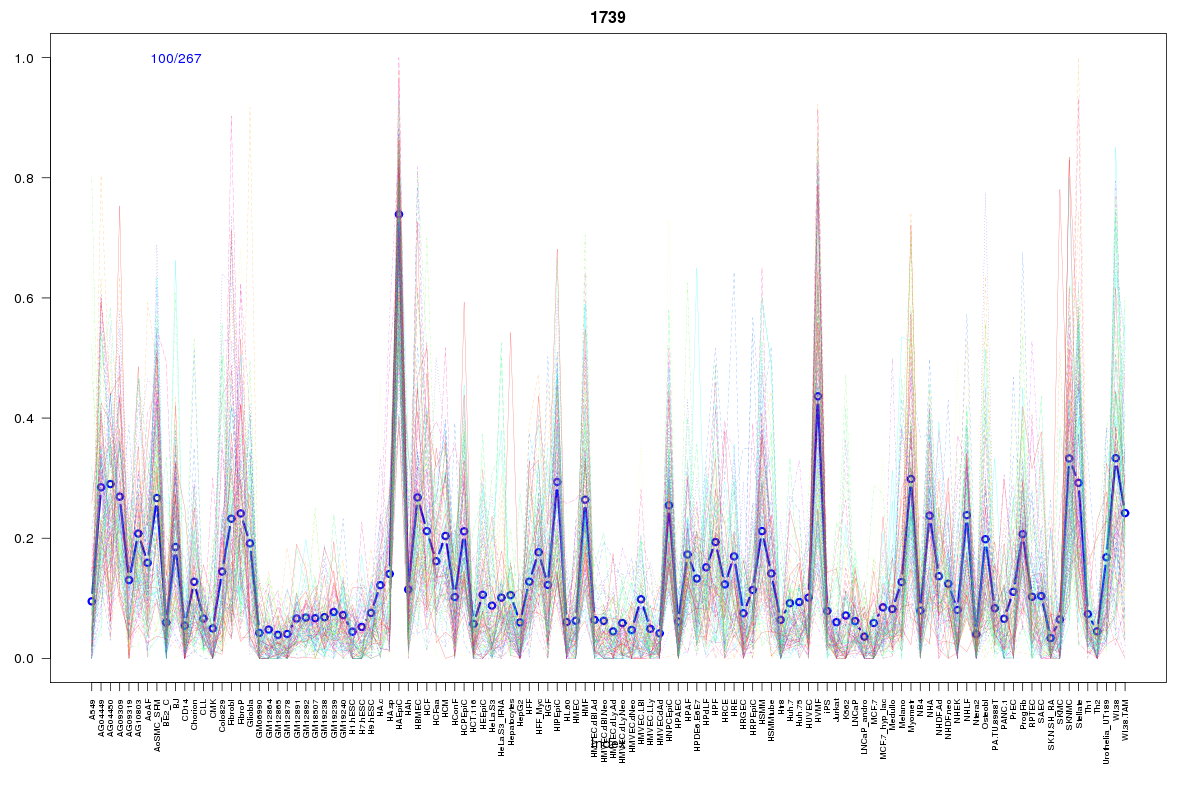 | 1739 | 1 |
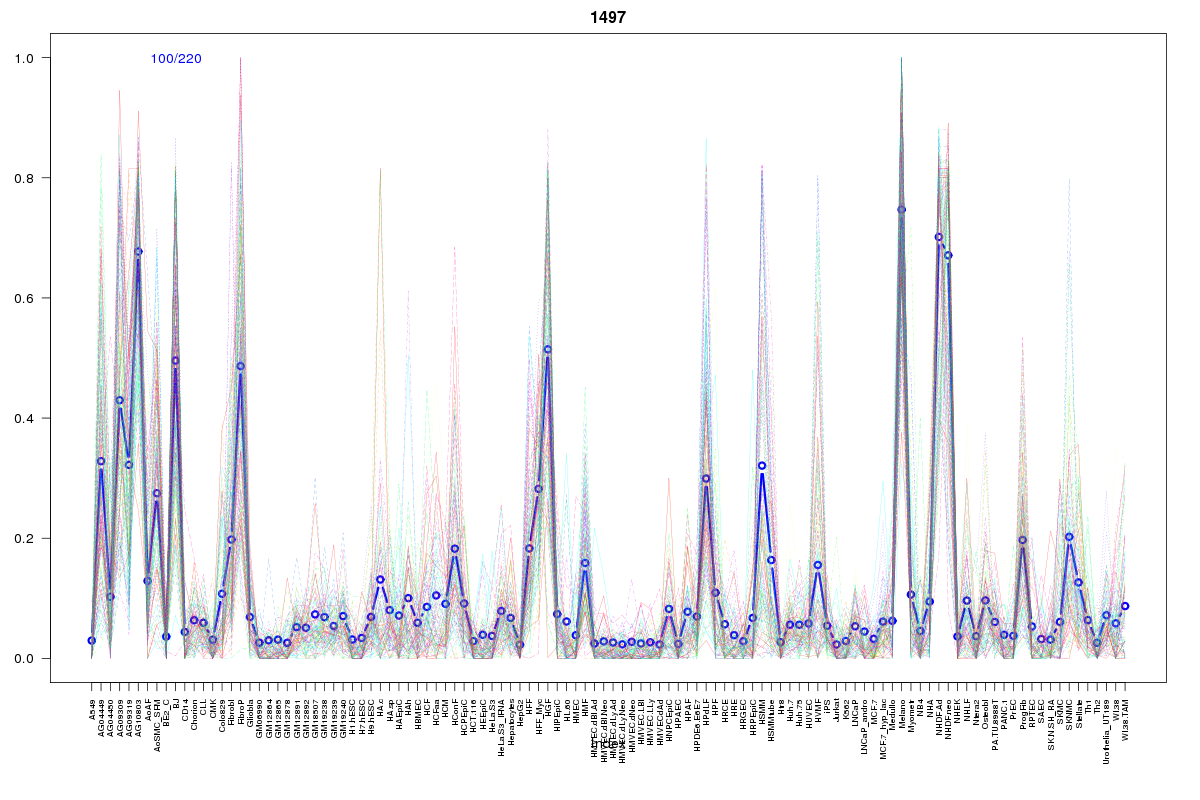 | 1497 | 1 |
 | 1422 | 1 |
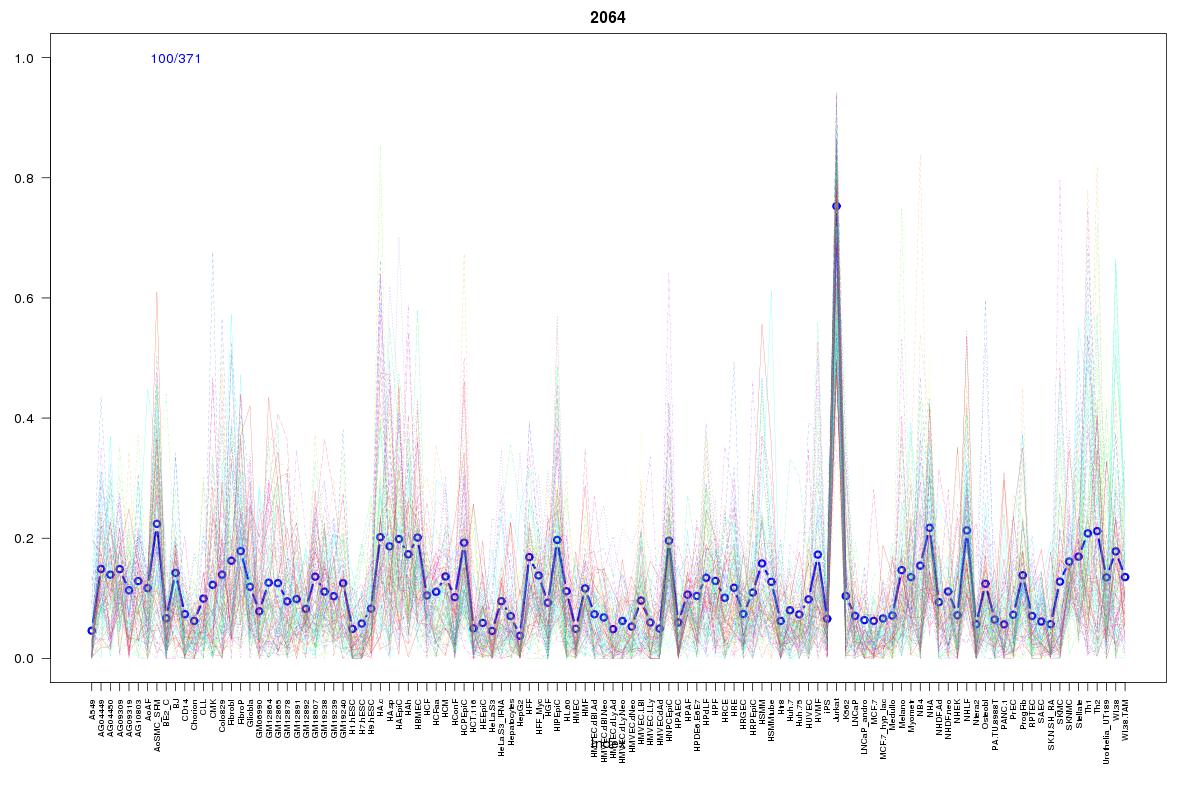 | 2064 | 1 |
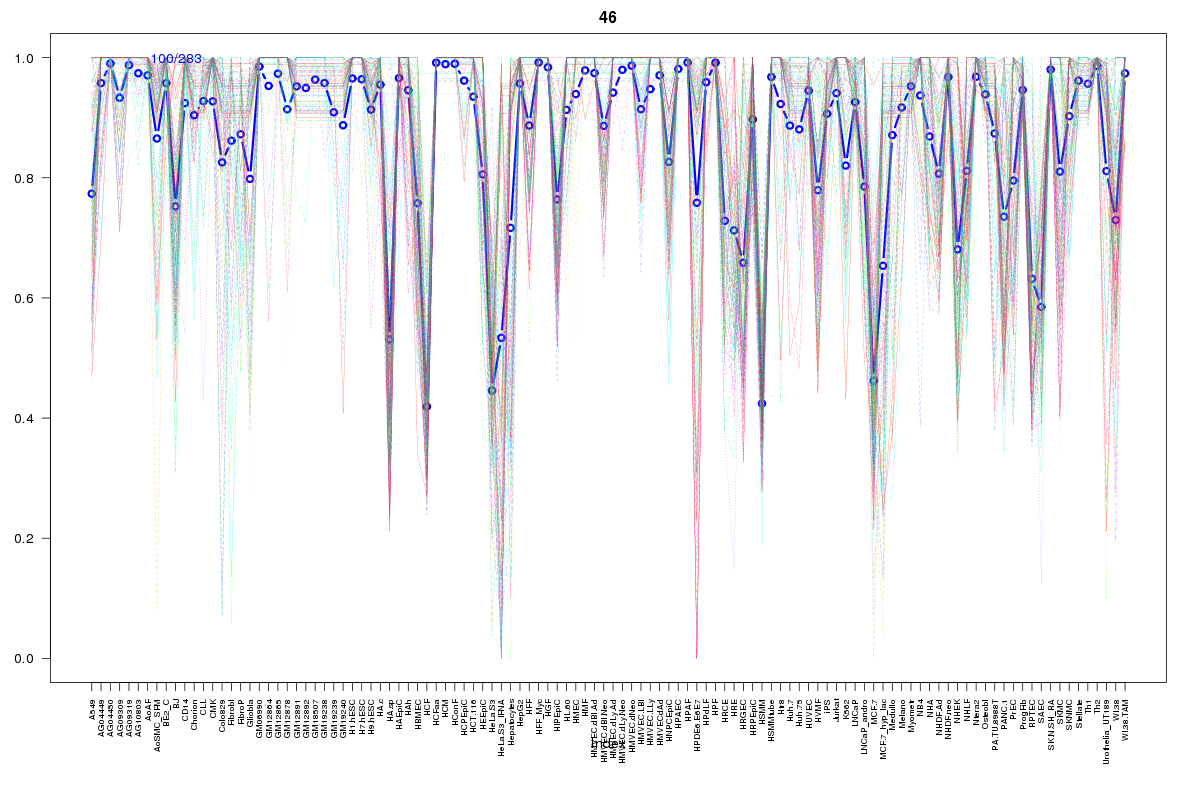 | 46 | 1 |
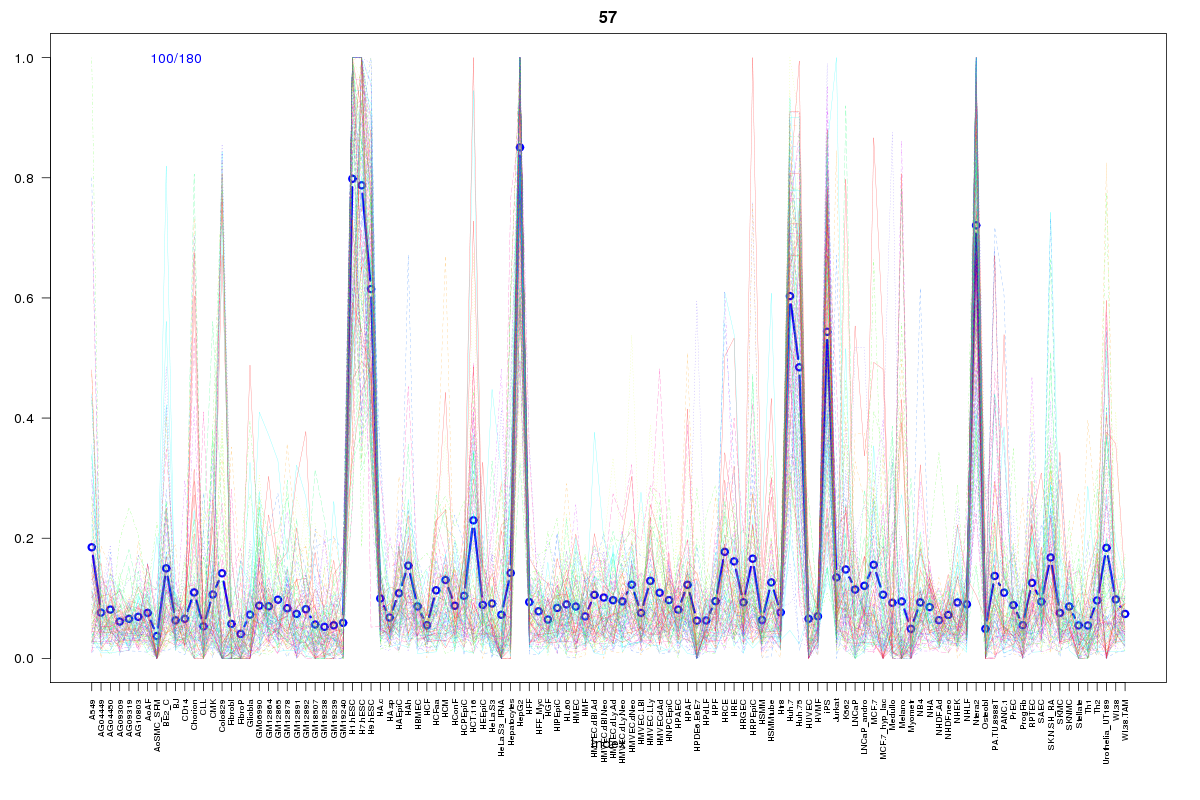 | 57 | 1 |
 | 2113 | 1 |
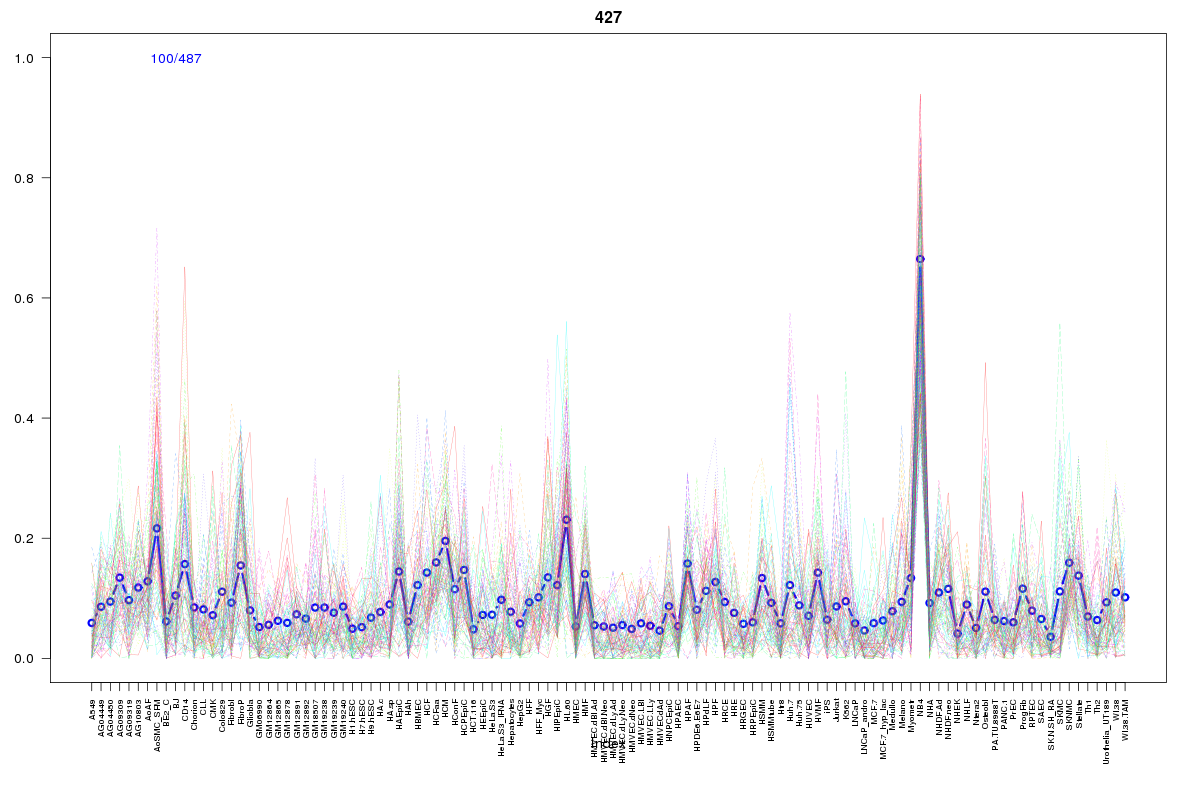 | 427 | 1 |
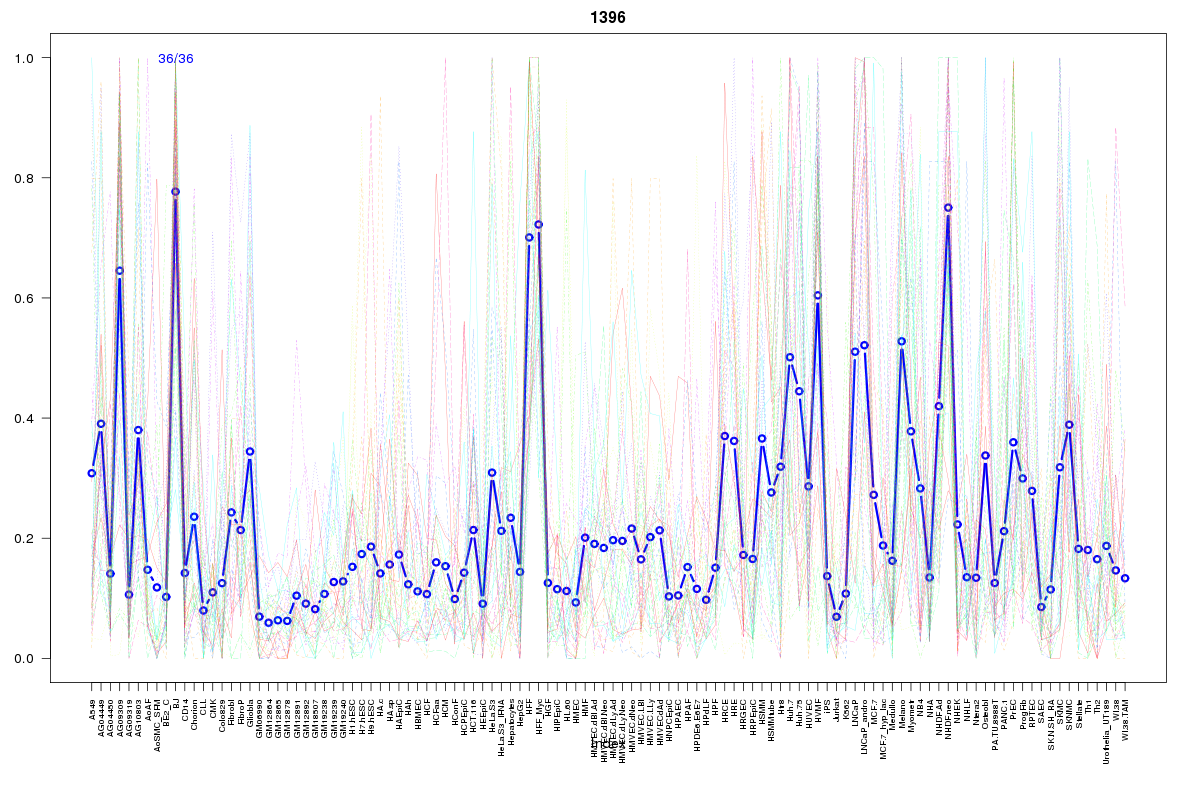 | 1396 | 1 |
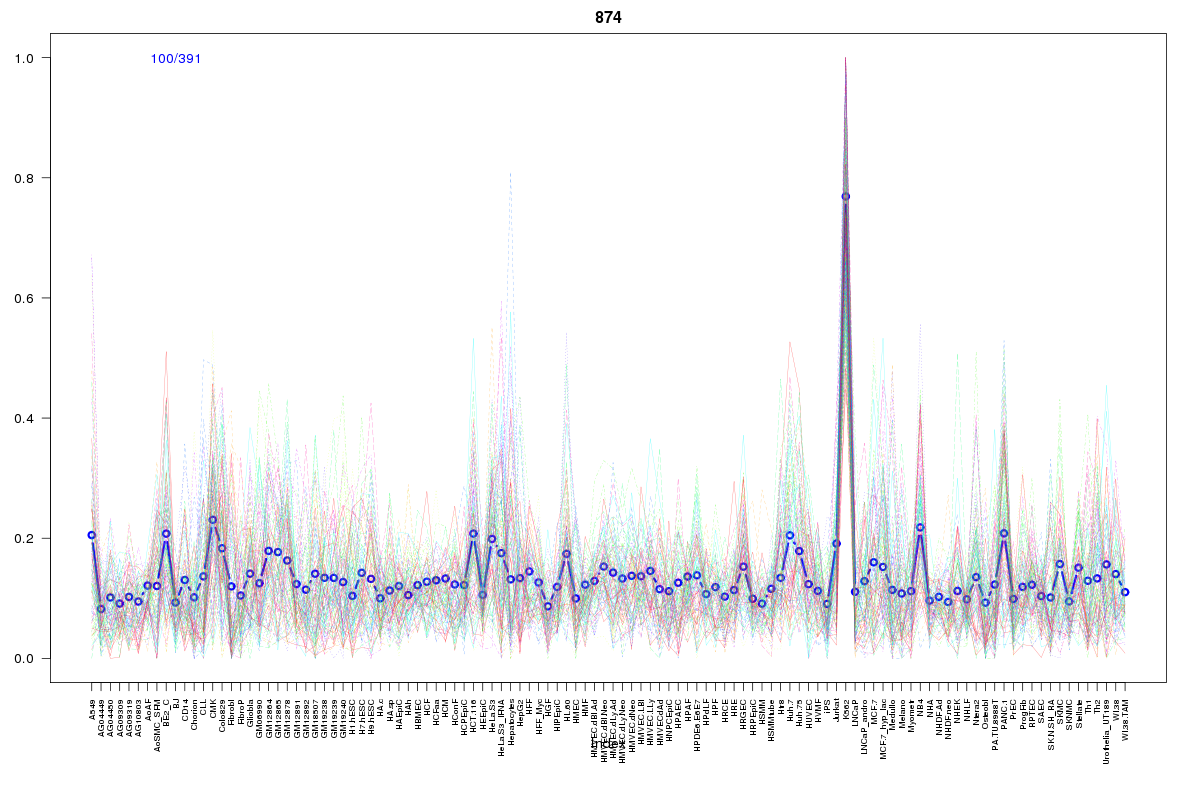 | 874 | 1 |
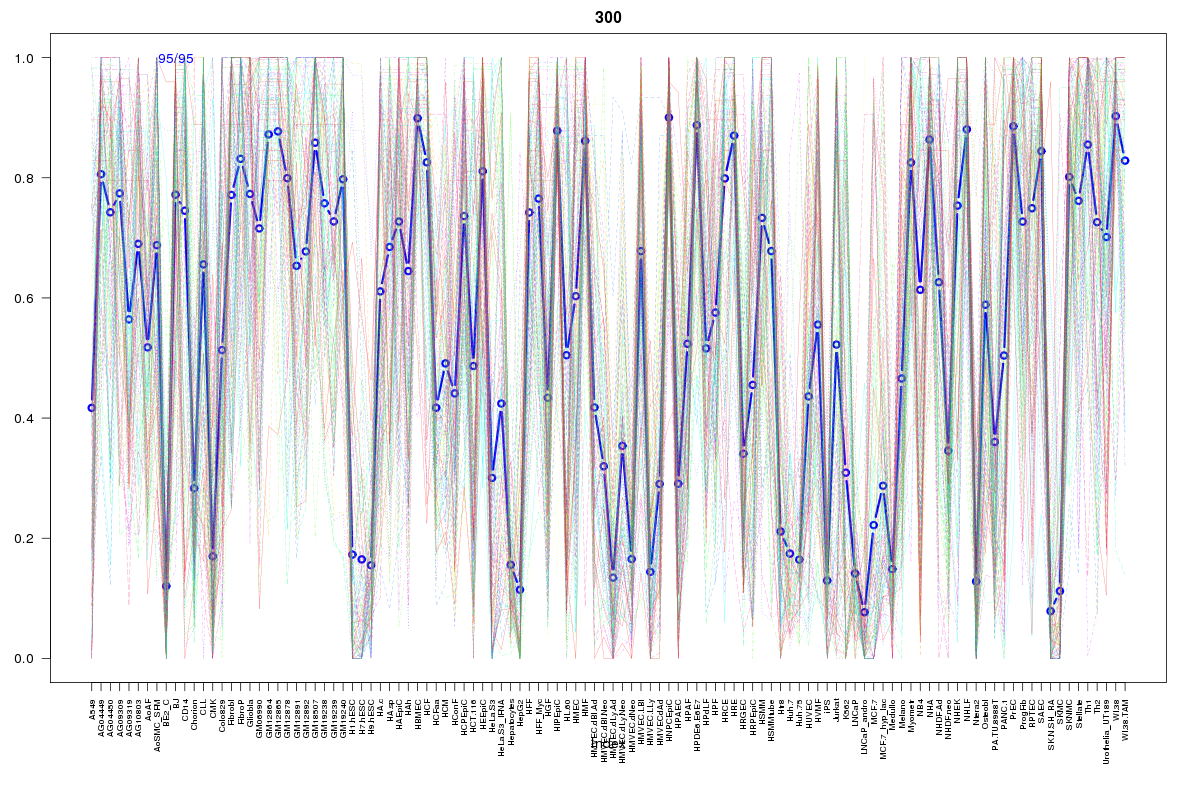 | 300 | 1 |
Resources
BED file downloads
Connects to 62 DHS sitesTop 10 Correlated DHS Sites
p-values indiciate significant higher or lower correlationExternal Databases
UCSCEnsembl (ENSG00000110245)