Gene: GTPBP4
chr10: 1034337-1065876Expression Profile
(log scale)
Graphical Connections
Distribution of linked clusters:
You may find it interesting if many of the connected DHS sites belong to the same cluster.| Cluster Profile | Cluster ID | Number of DHS sites in this cluster |
|---|---|---|
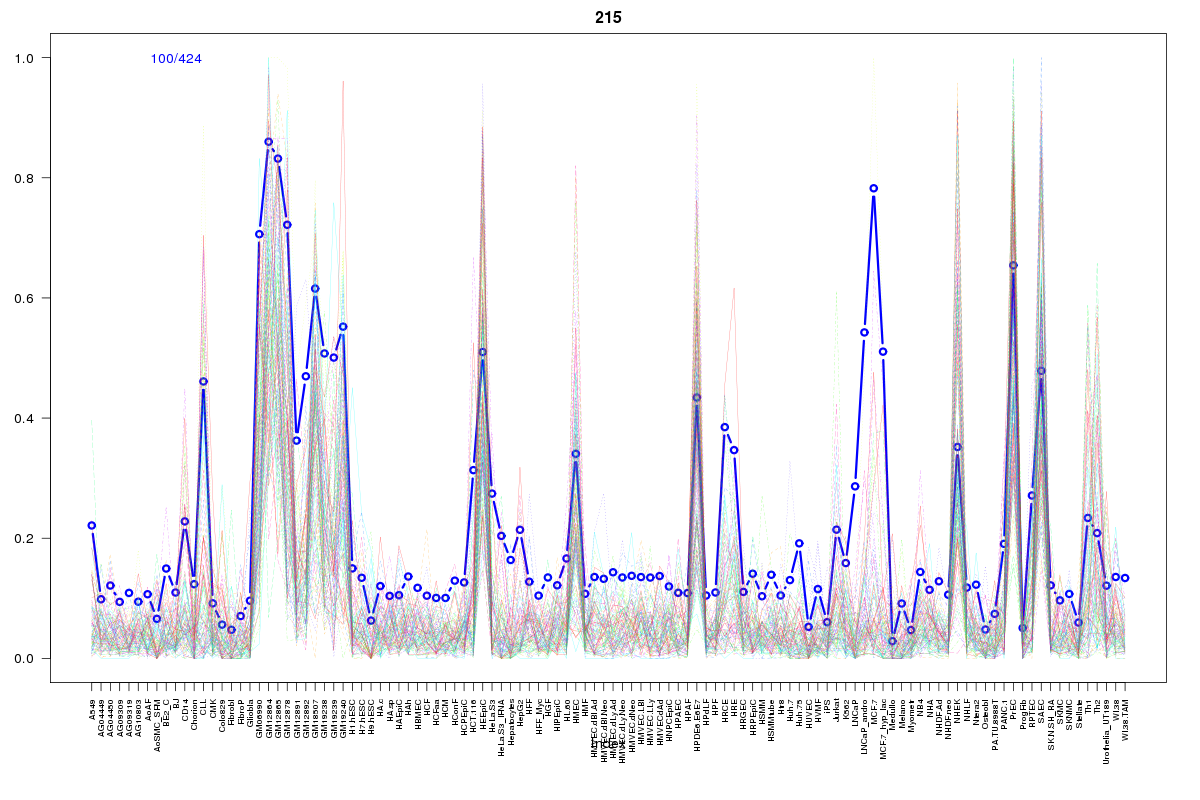 | 215 | 2 |
 | 2114 | 2 |
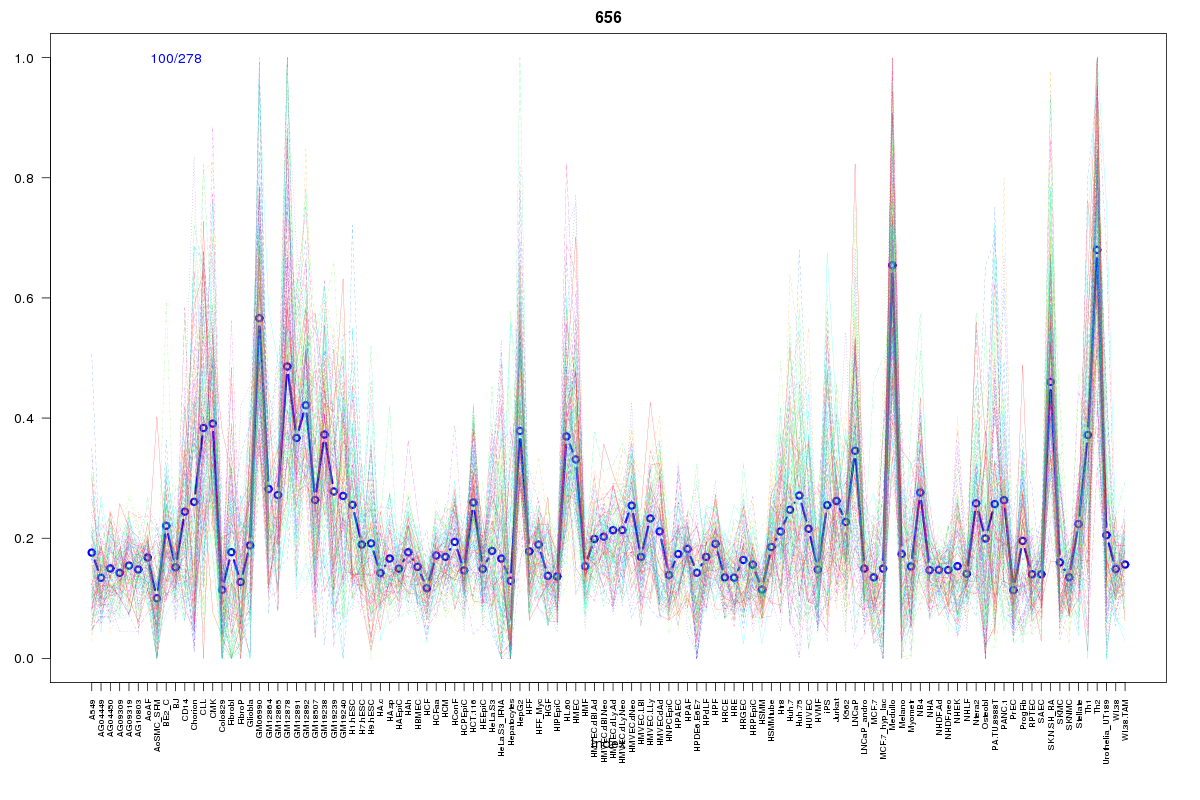 | 656 | 1 |
 | 469 | 1 |
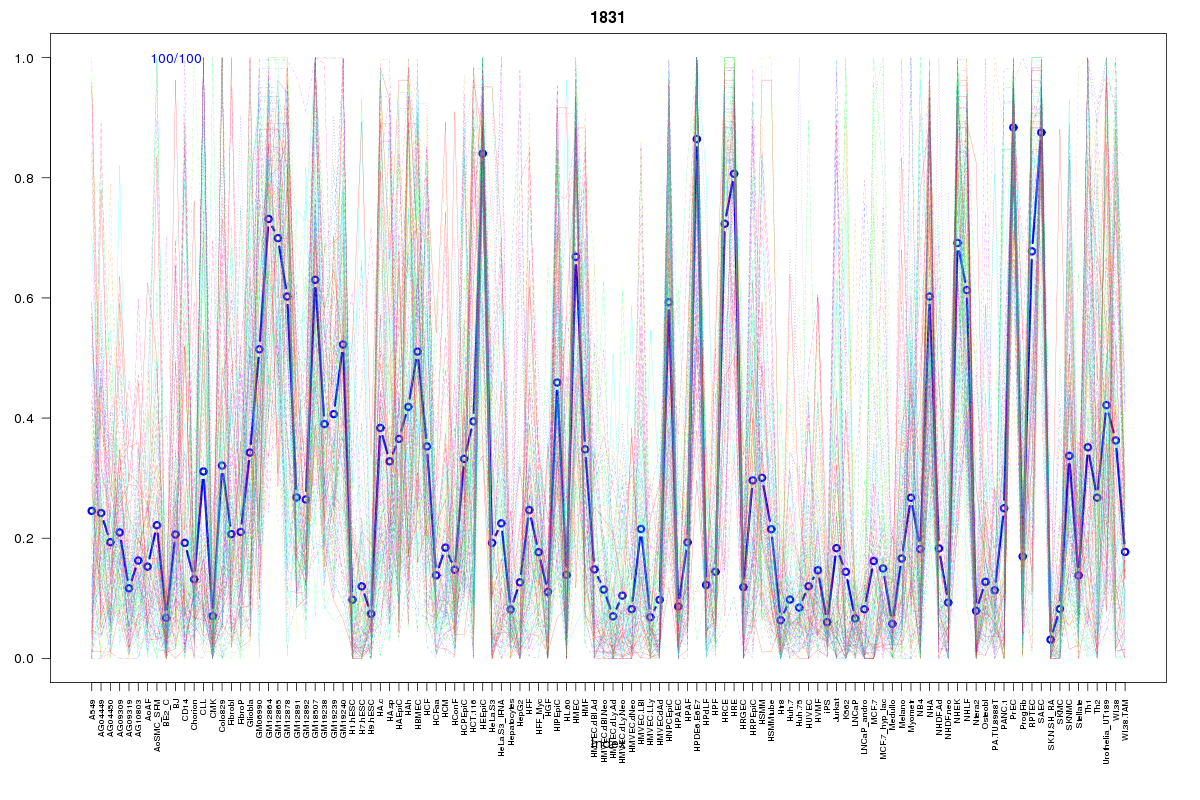 | 1831 | 1 |
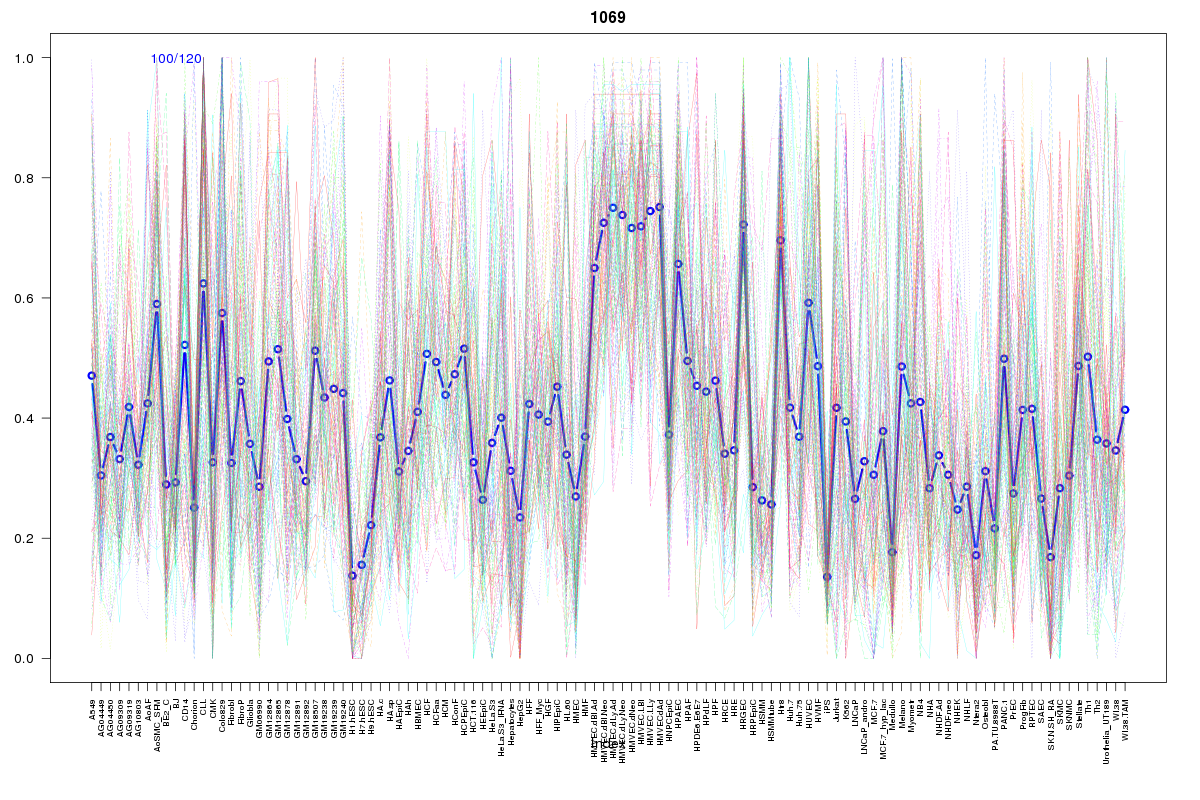 | 1069 | 1 |
 | 1213 | 1 |
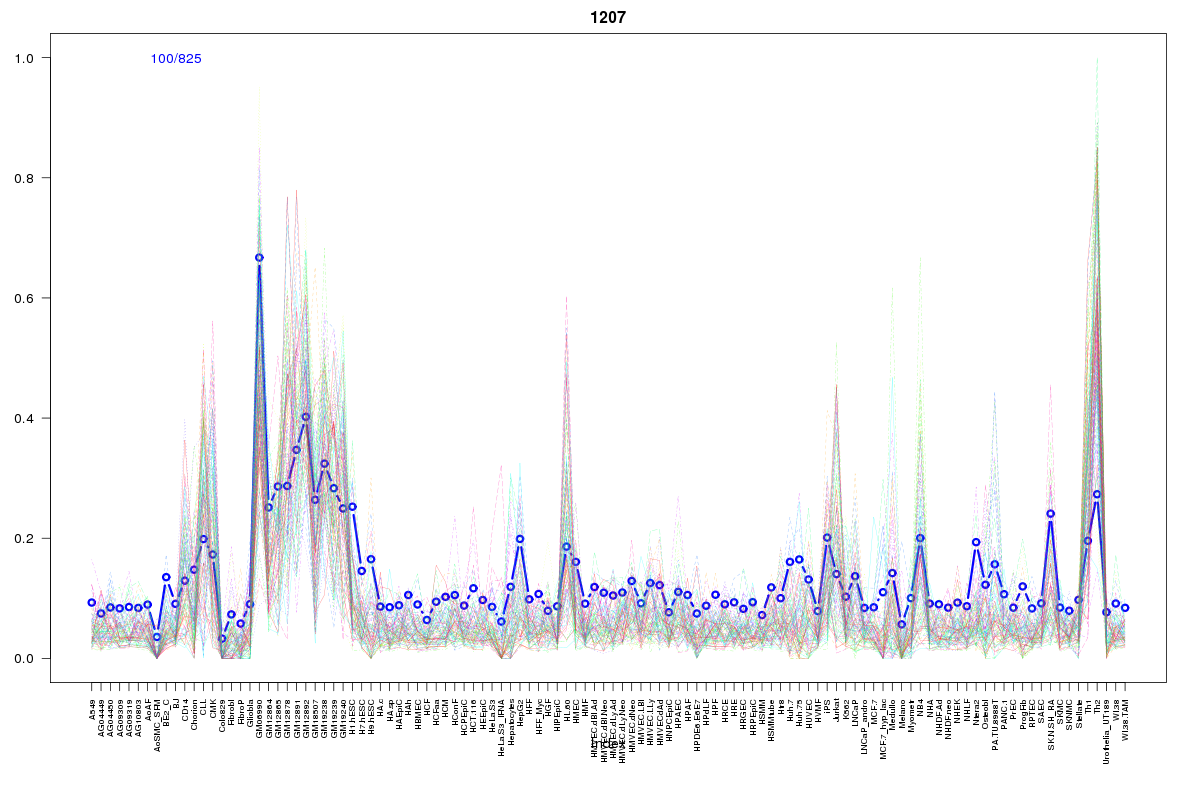 | 1207 | 1 |
 | 935 | 1 |
 | 2468 | 1 |
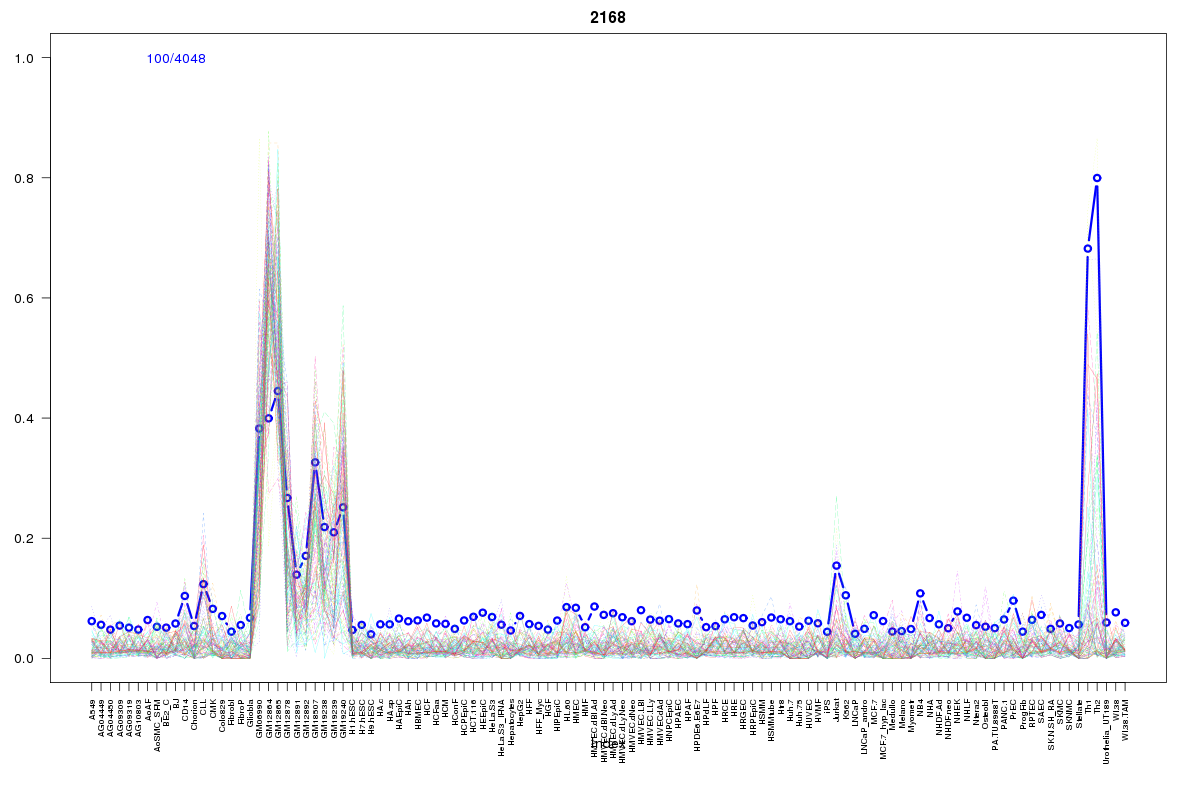 | 2168 | 1 |
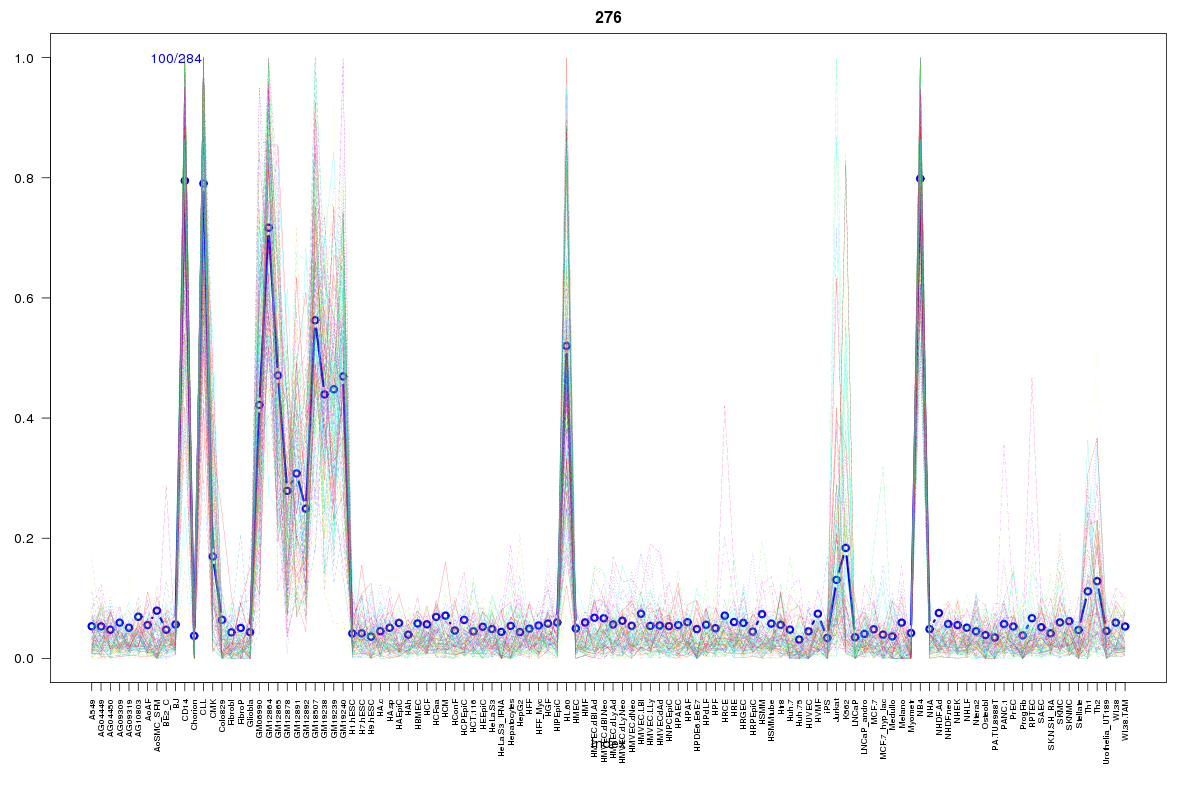 | 276 | 1 |
 | 2068 | 1 |
 | 1604 | 1 |
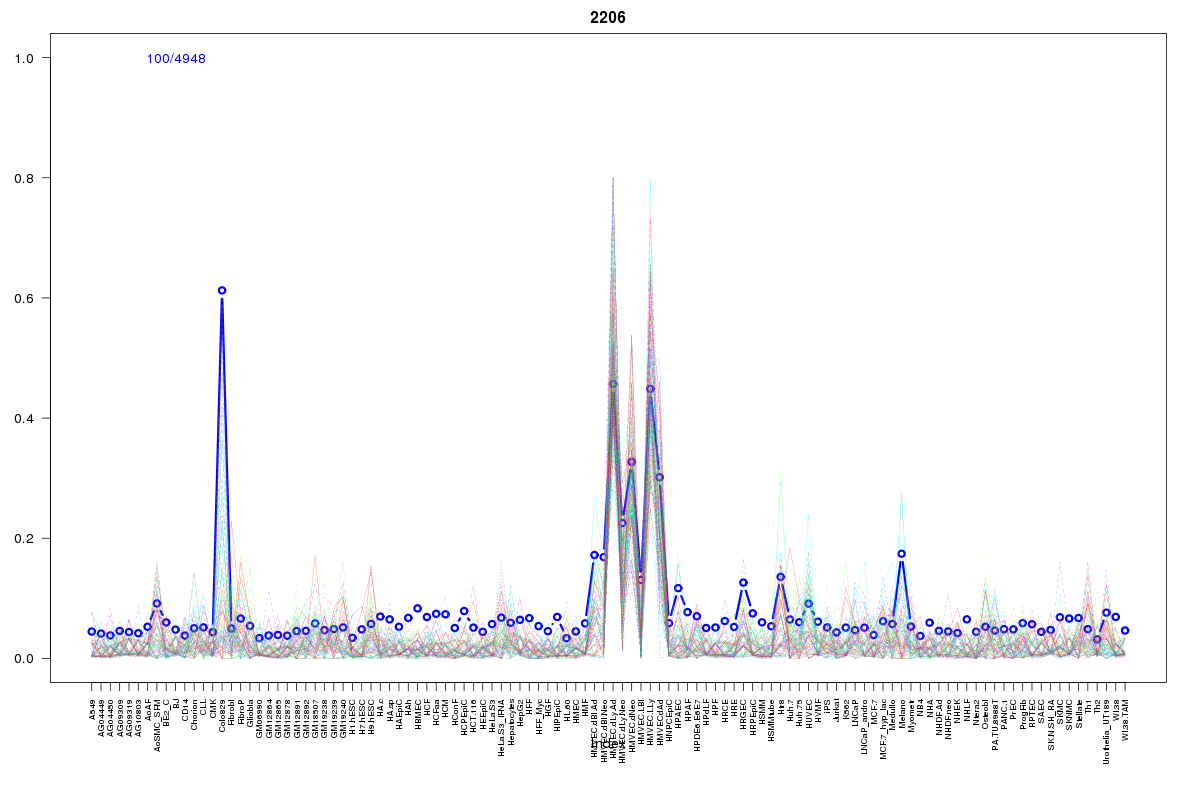 | 2206 | 1 |
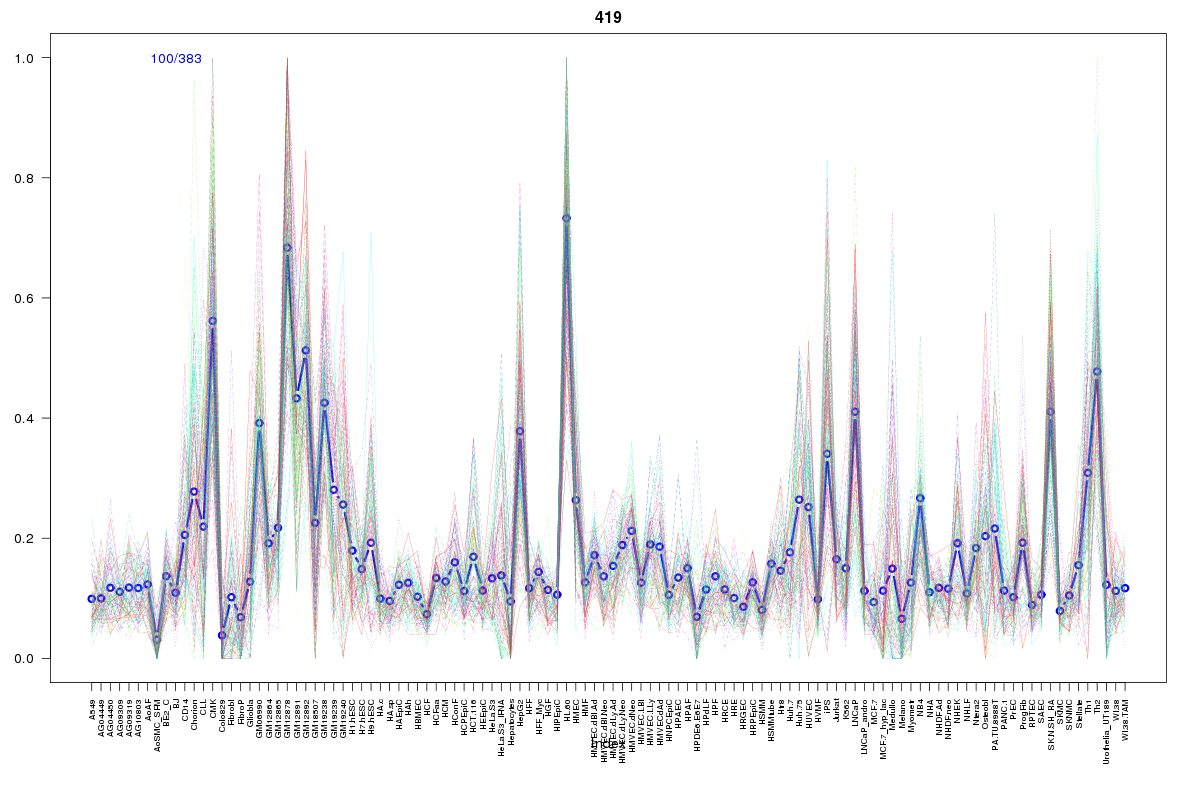 | 419 | 1 |
 | 2110 | 1 |
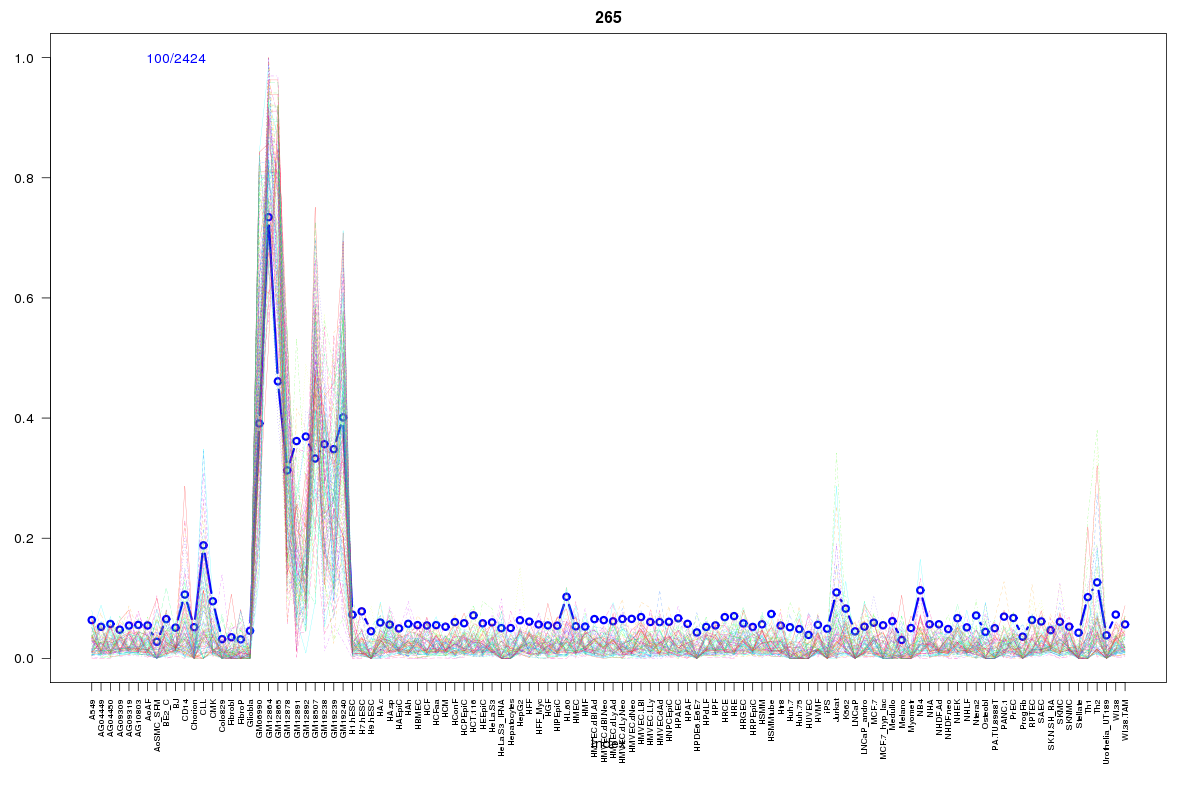 | 265 | 1 |
 | 1865 | 1 |
Resources
BED file downloads
Connects to 21 DHS sitesTop 10 Correlated DHS Sites
p-values indiciate significant higher or lower correlation| Location | Cluster | P-value |
|---|---|---|
| chr10:1102865-1103015 | 1213 | 0.001 |
| chr10:1096640-1096790 | 215 | 0.001 |
| chr10:1034580-1034730 | 656 | 0.002 |
| chr10:1109340-1109490 | 2114 | 0.005 |
| chr10:1034740-1034890 | 469 | 0.007 |
| chr10:1082440-1082590 | 215 | 0.016 |
| chr10:1140245-1140395 | 2168 | 0.016 |
| chr10:1154345-1154495 | 2110 | 0.017 |
| chr10:1103085-1103235 | 1207 | 0.018 |
| chr10:976940-977090 | 1604 | 0.018 |
| chr10:989860-990010 | 265 | 0.019 |
External Databases
UCSCEnsembl (ENSG00000107937)