Gene: GLI3
chr7: 42000547-42276612Expression Profile
(log scale)
Graphical Connections
Distribution of linked clusters:
You may find it interesting if many of the connected DHS sites belong to the same cluster.| Cluster Profile | Cluster ID | Number of DHS sites in this cluster |
|---|---|---|
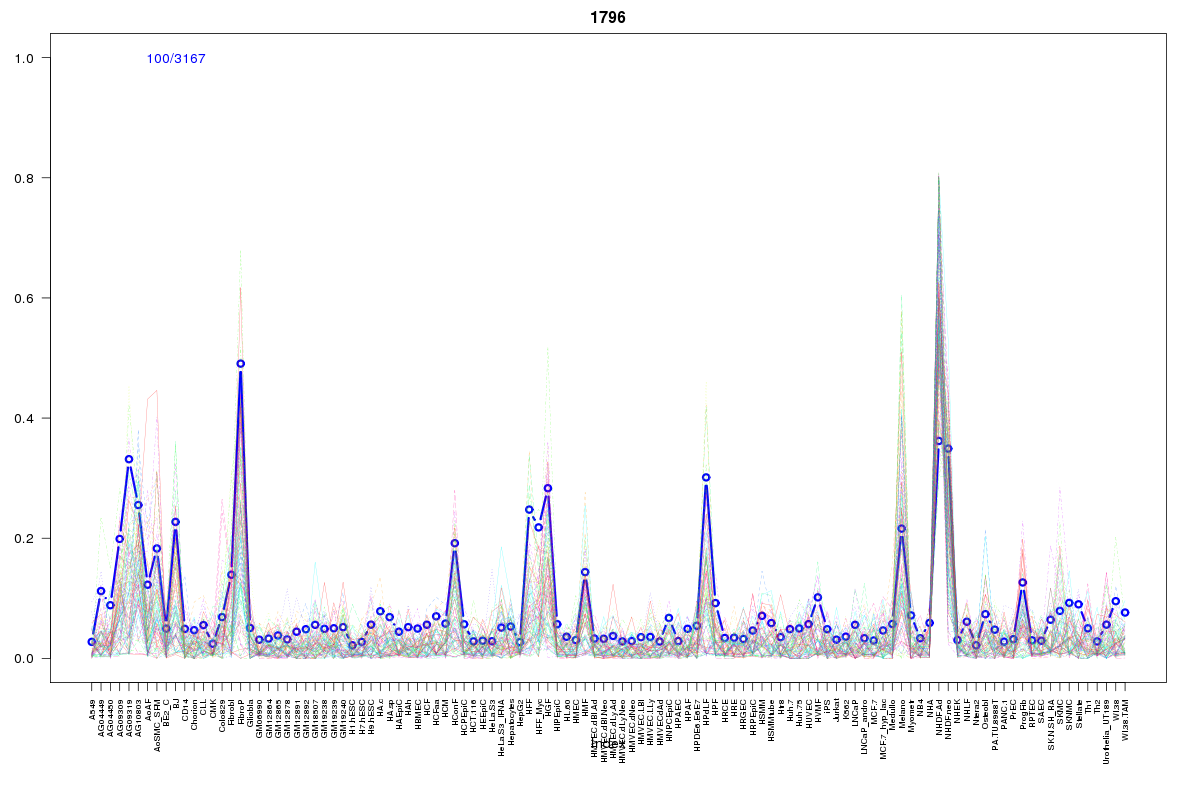 | 1796 | 3 |
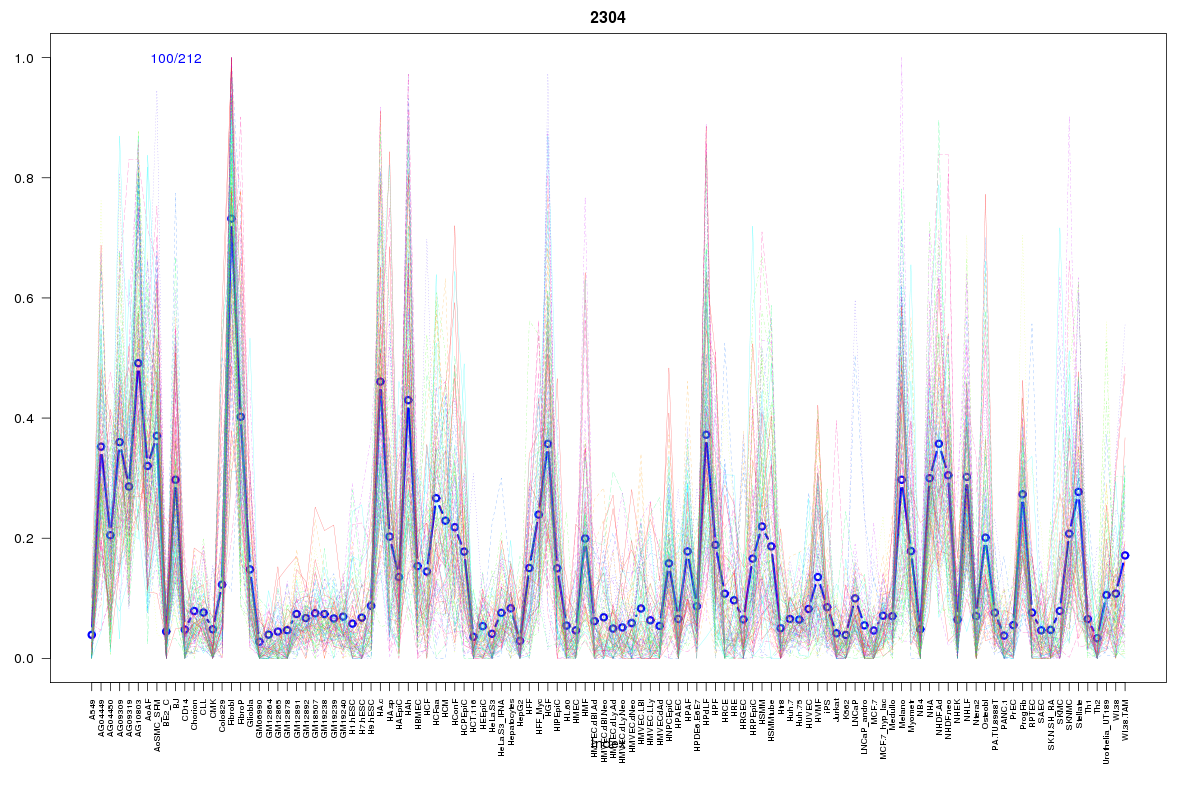 | 2304 | 2 |
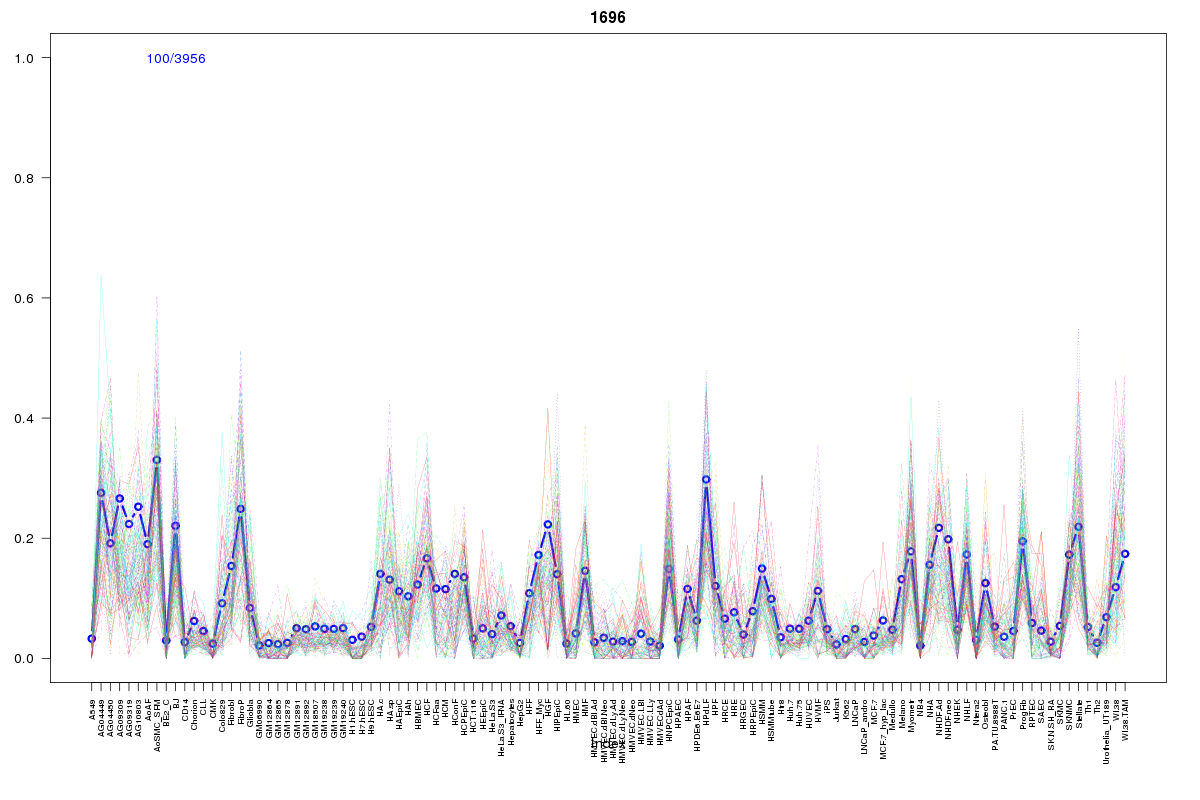 | 1696 | 2 |
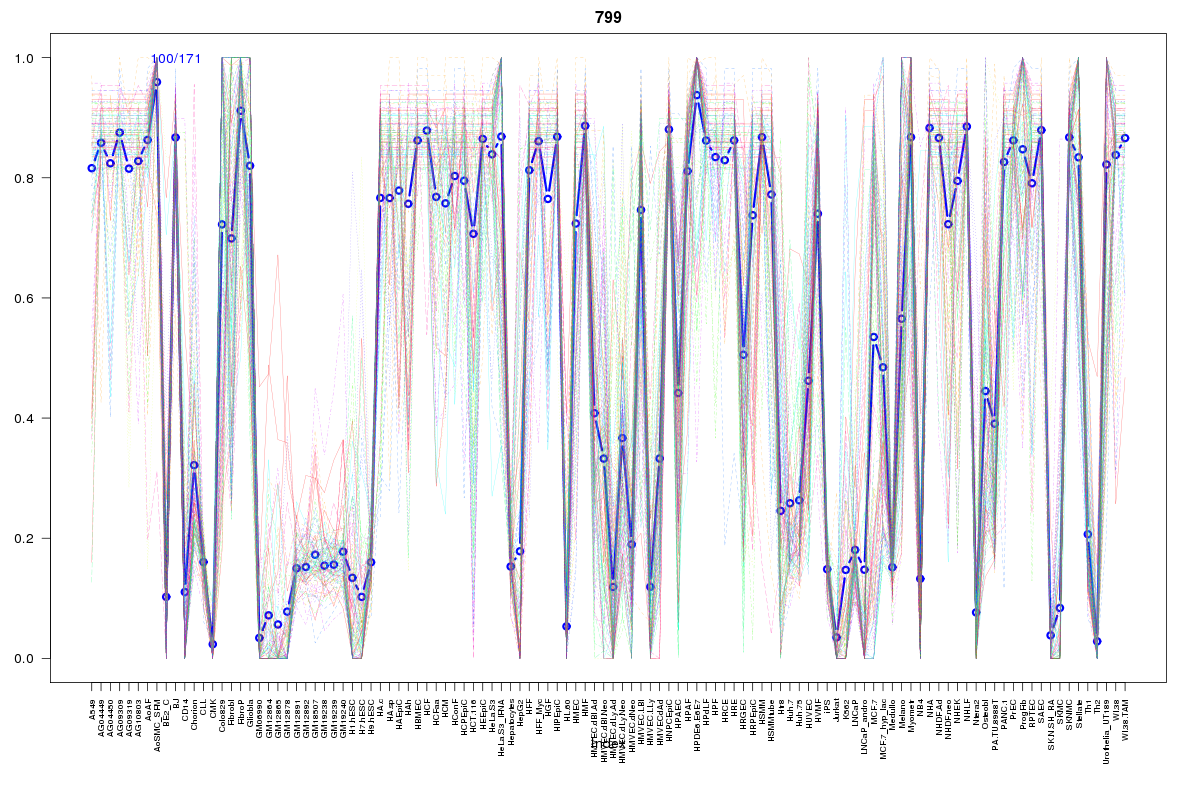 | 799 | 2 |
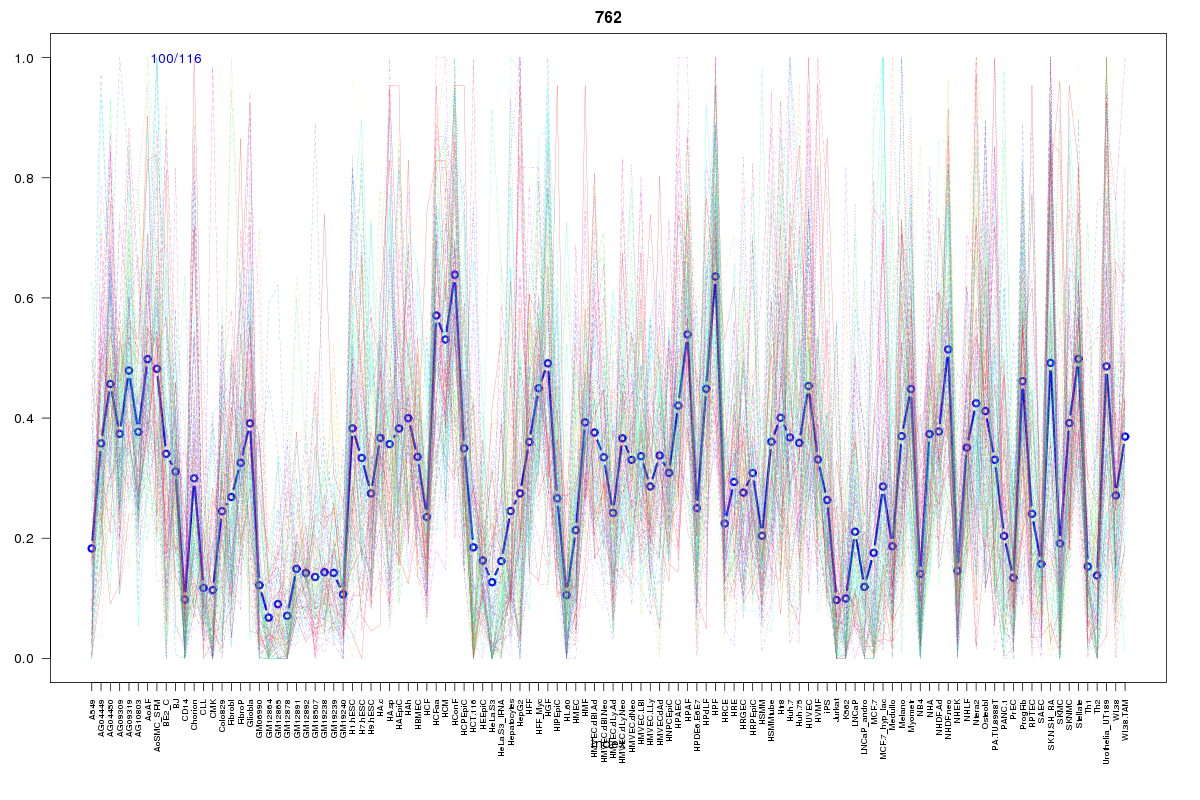 | 762 | 2 |
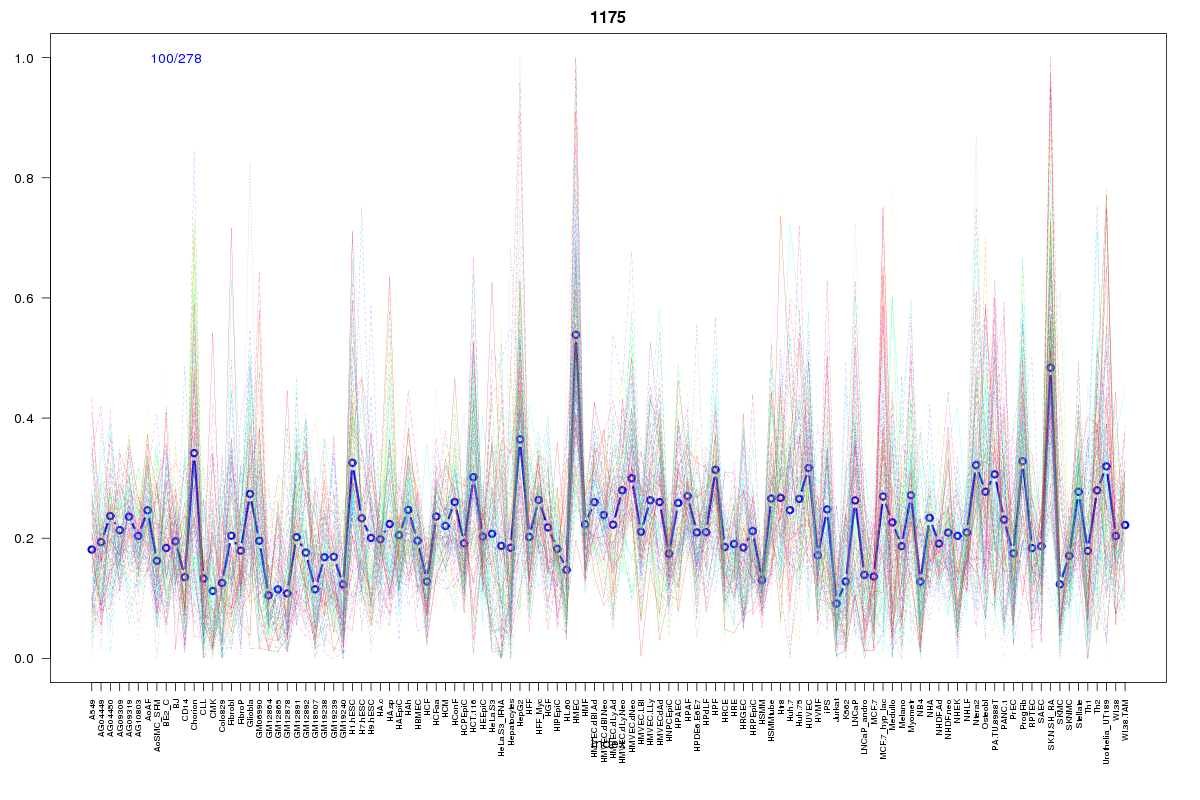 | 1175 | 2 |
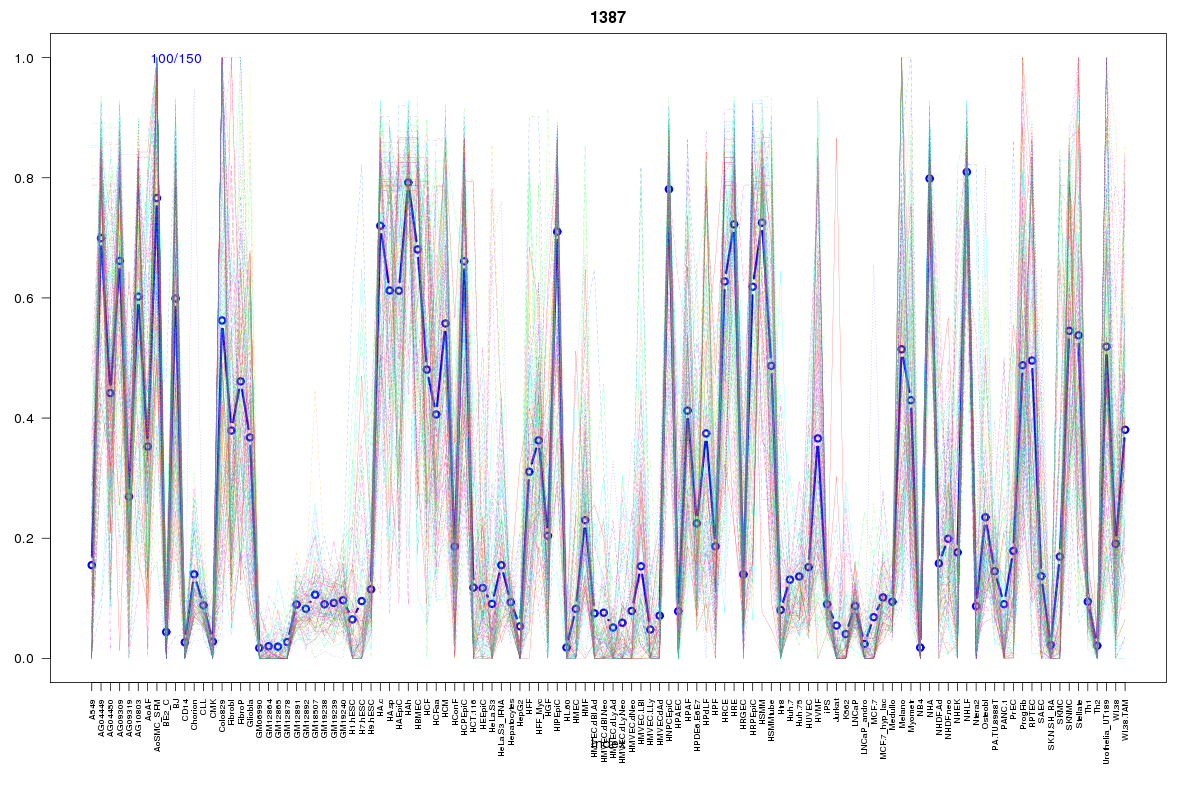 | 1387 | 2 |
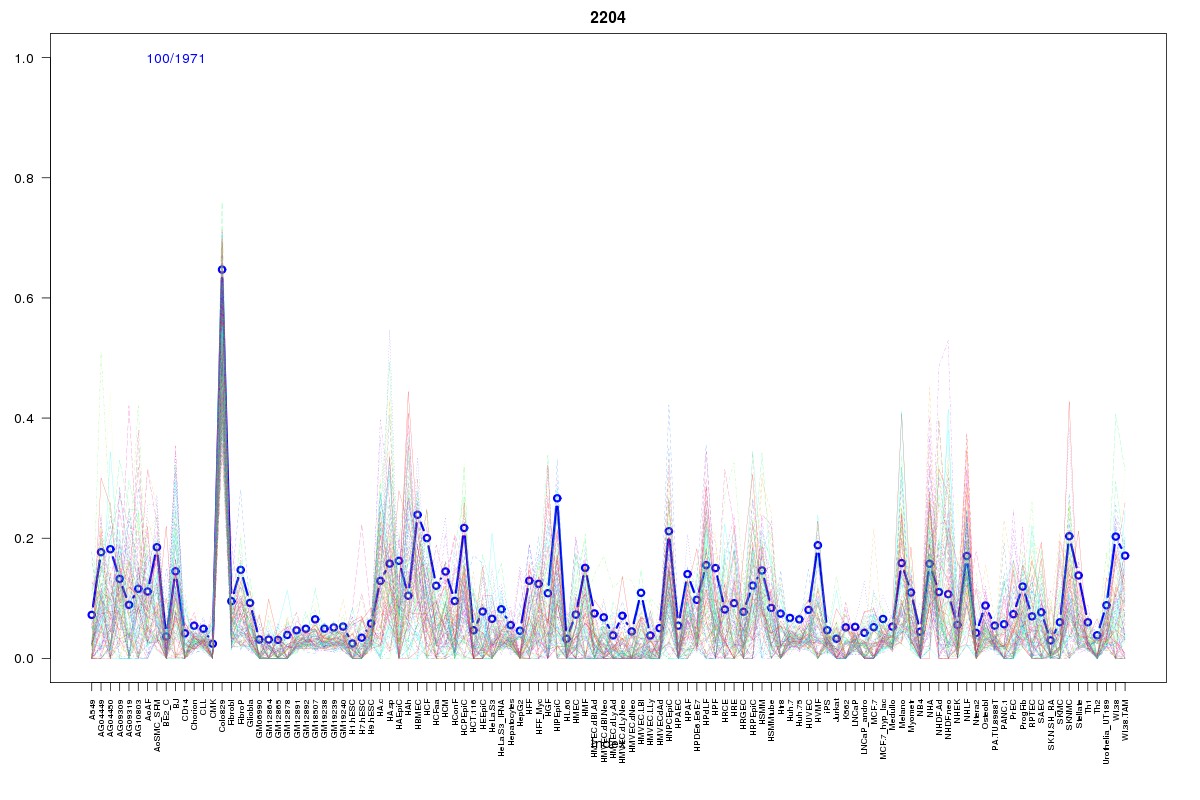 | 2204 | 2 |
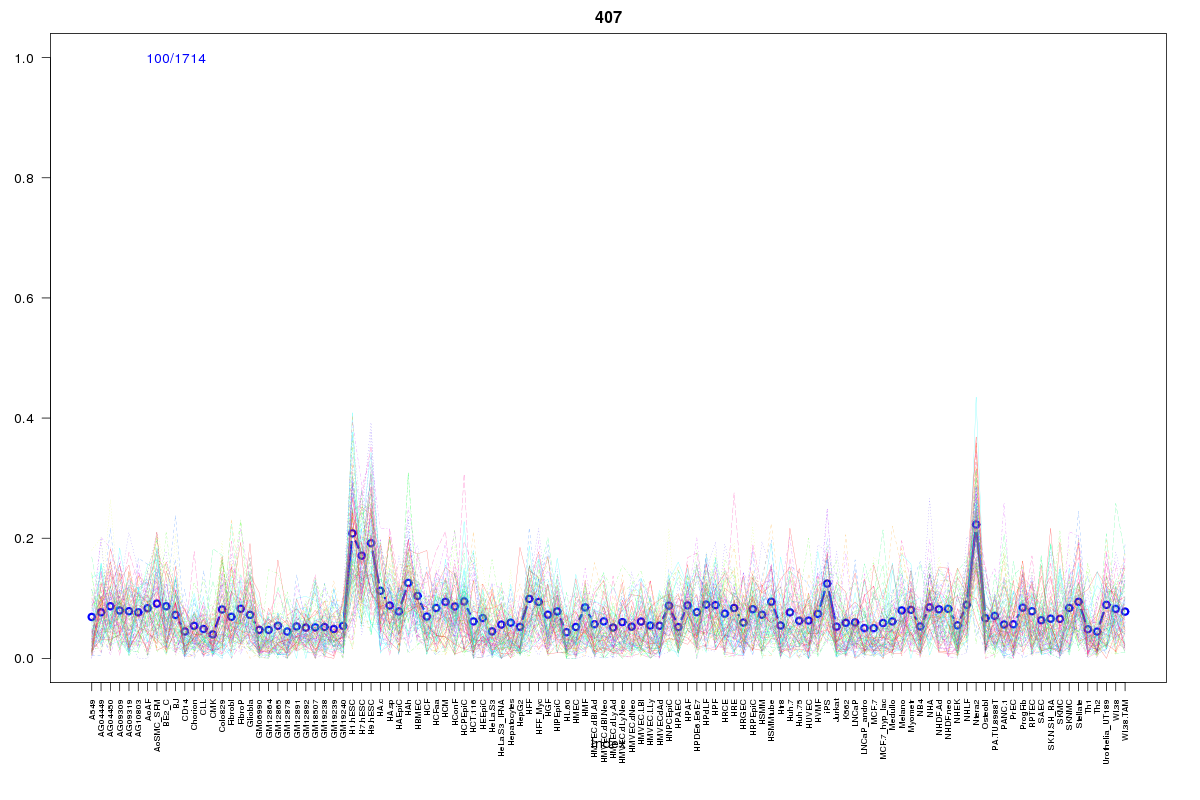 | 407 | 2 |
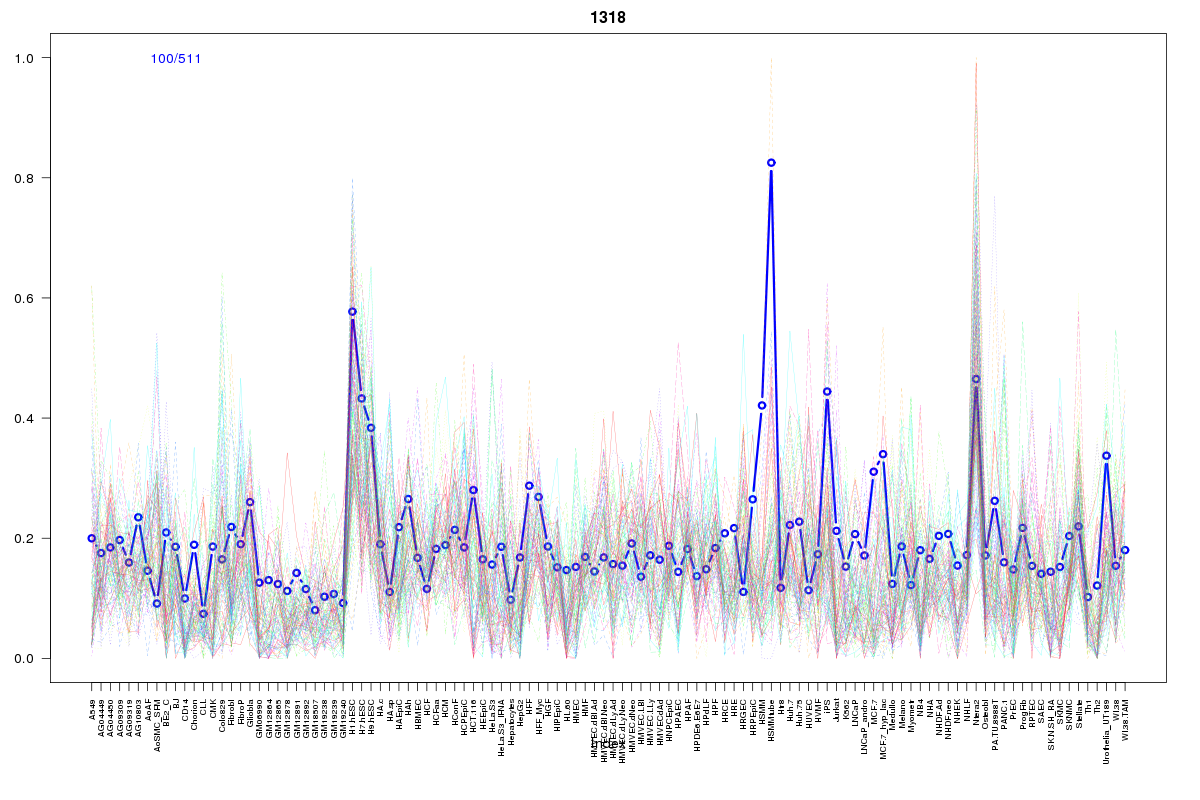 | 1318 | 2 |
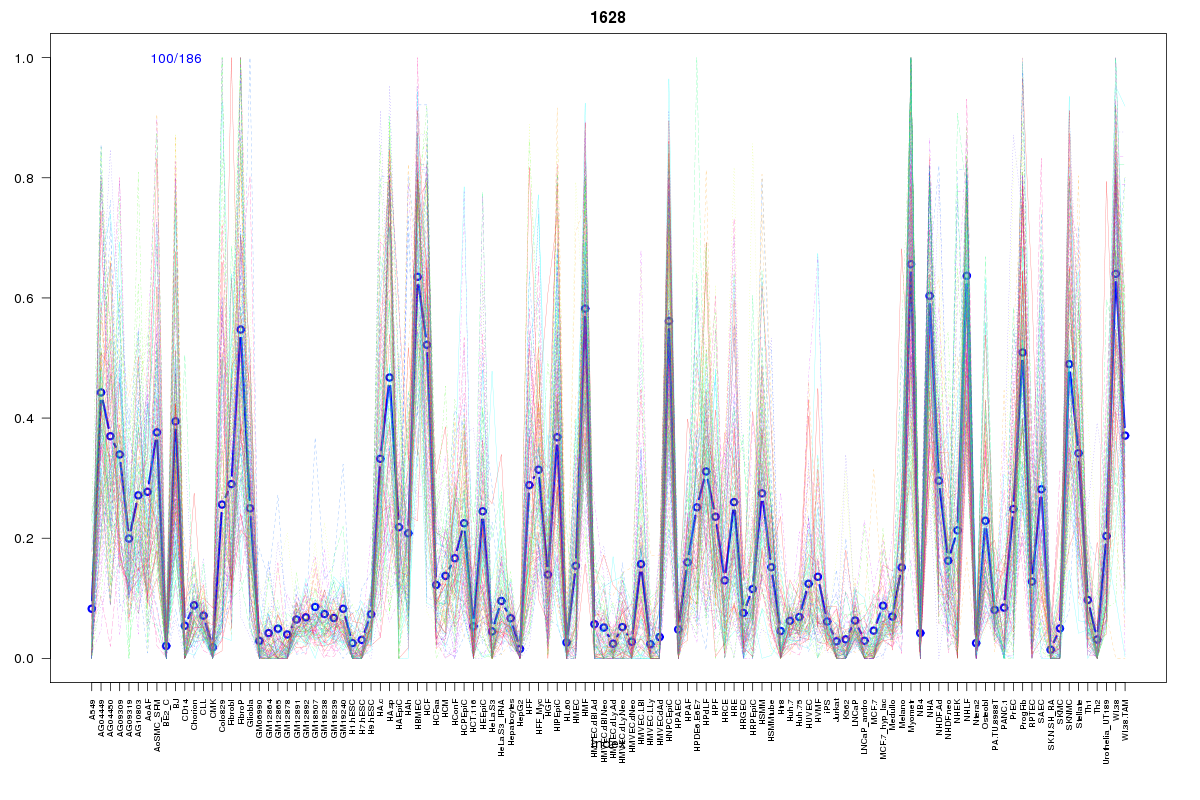 | 1628 | 1 |
 | 60 | 1 |
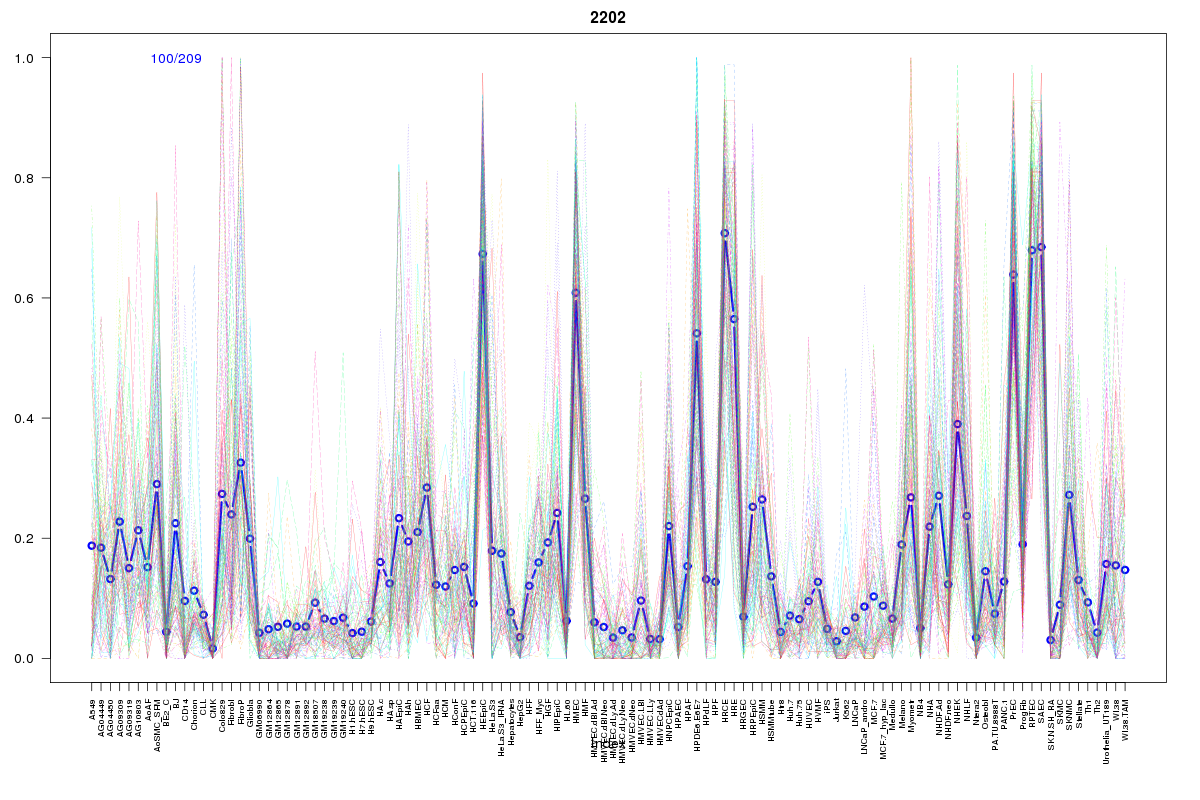 | 2202 | 1 |
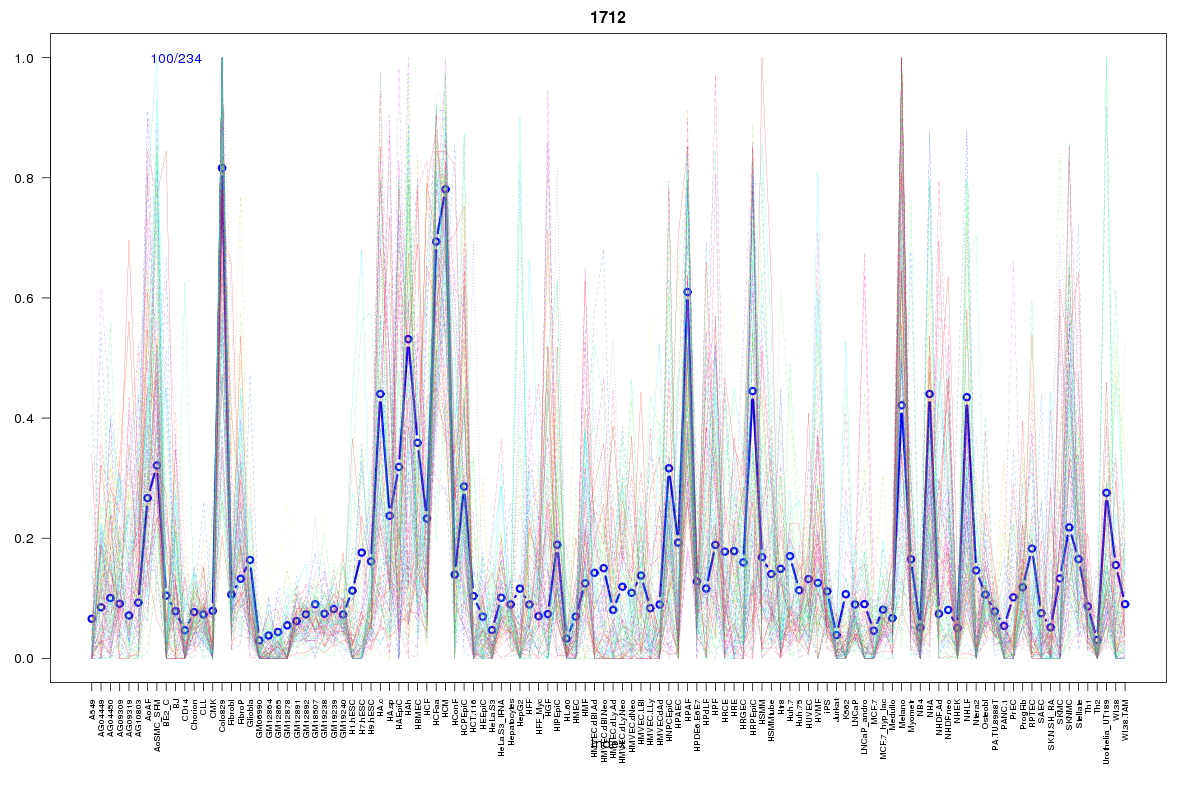 | 1712 | 1 |
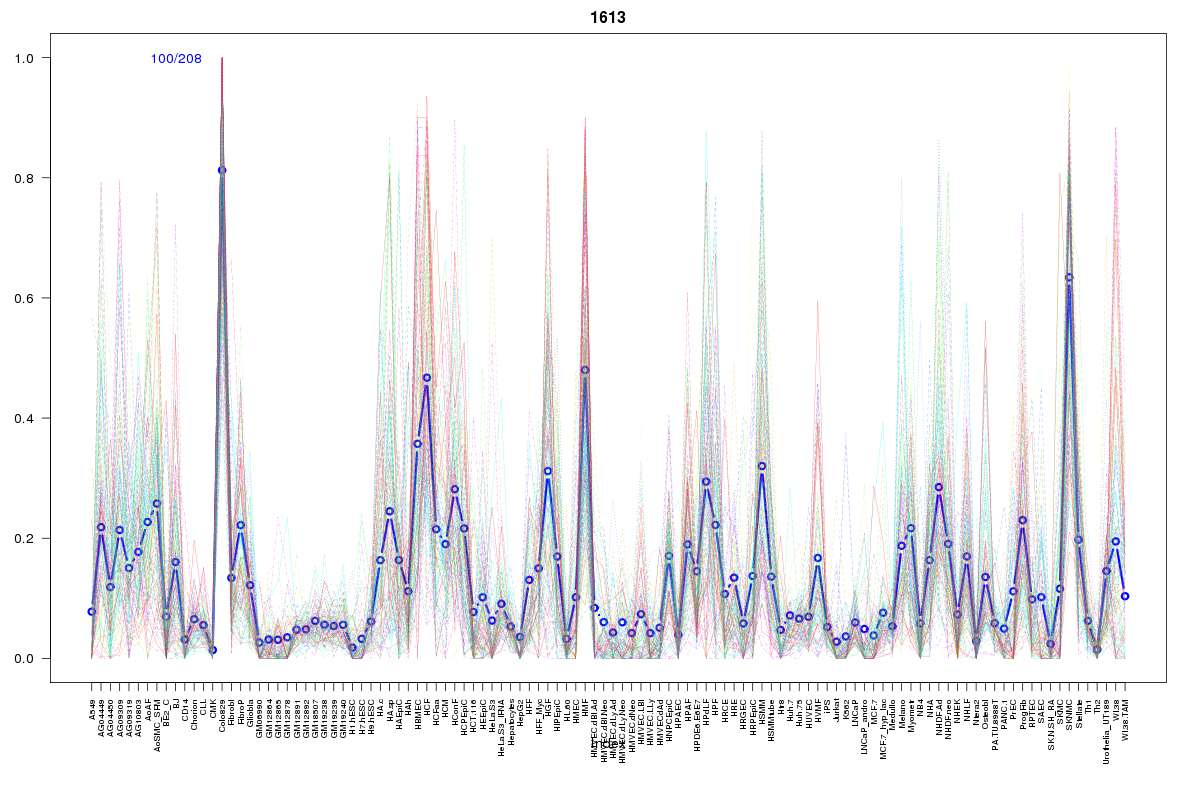 | 1613 | 1 |
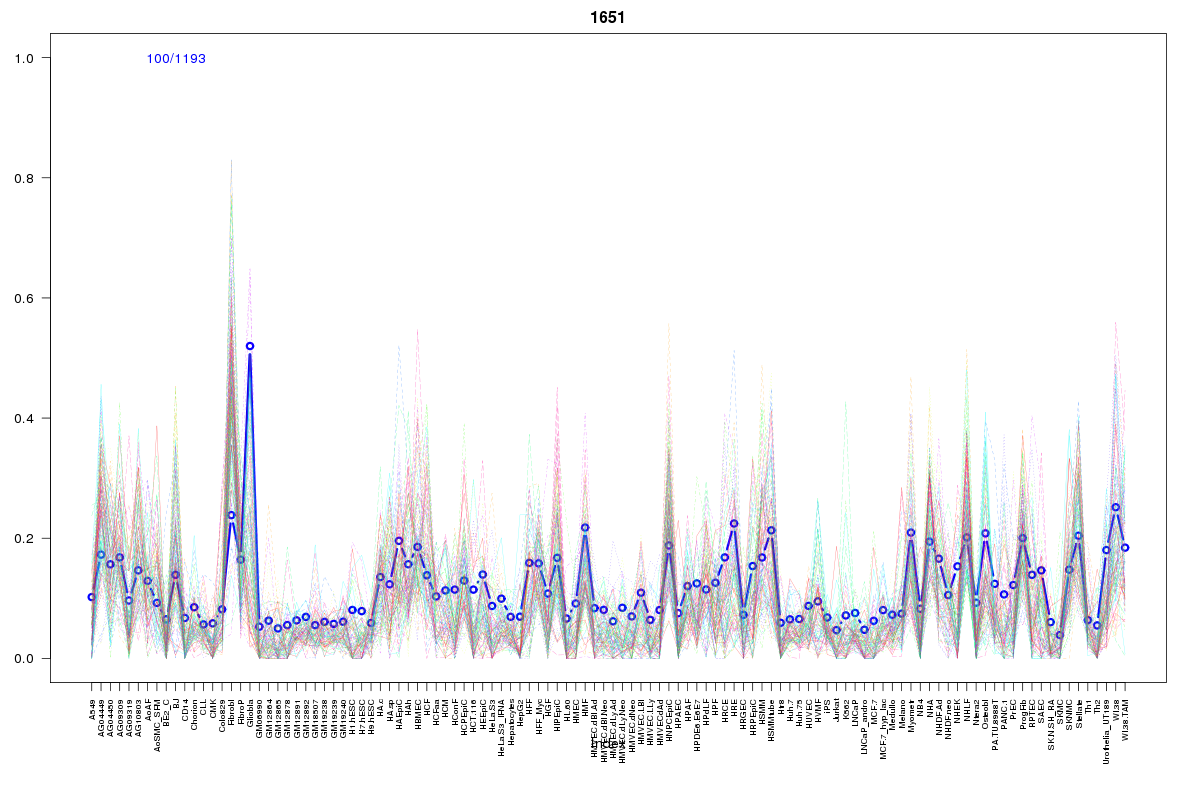 | 1651 | 1 |
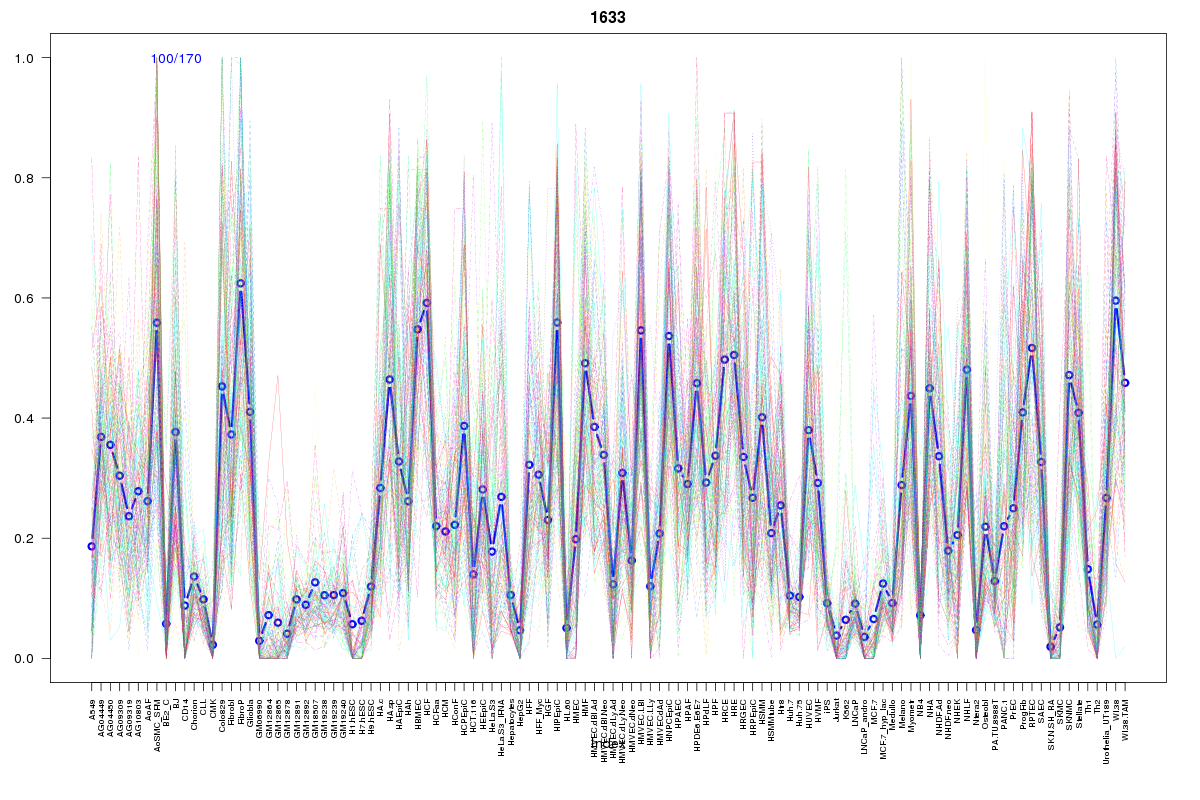 | 1633 | 1 |
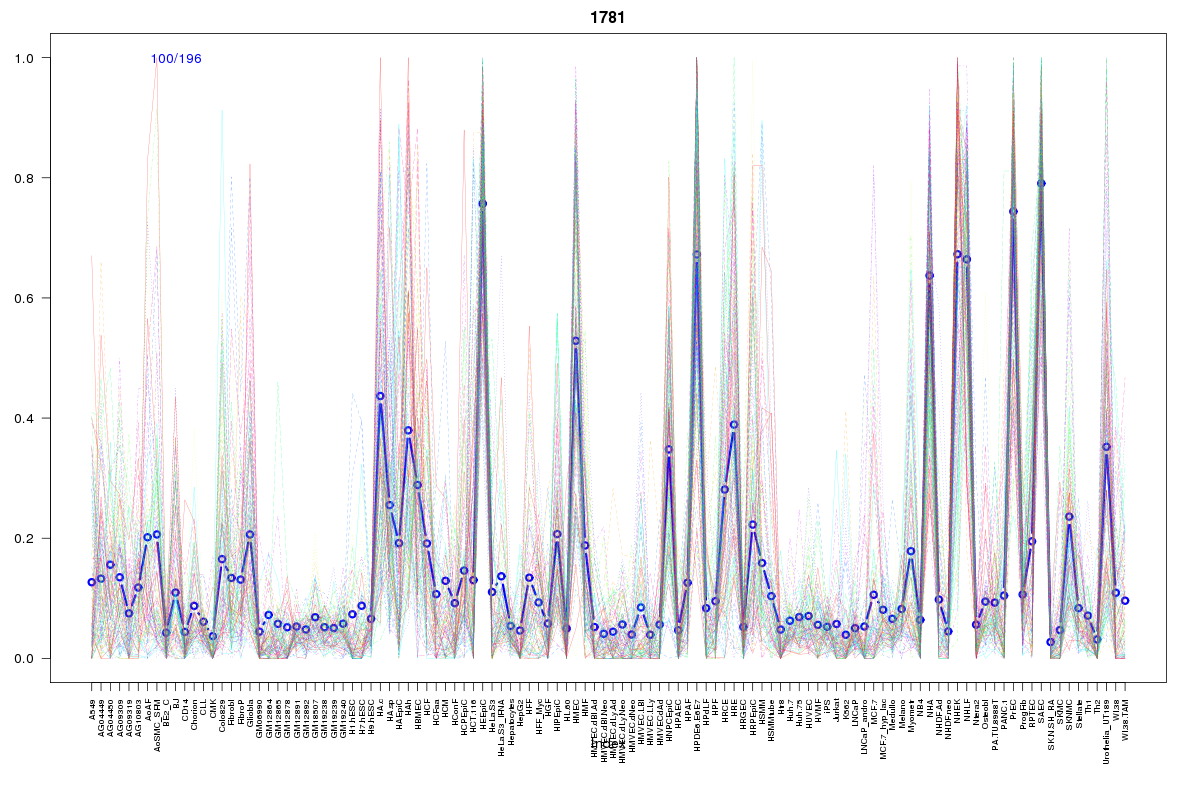 | 1781 | 1 |
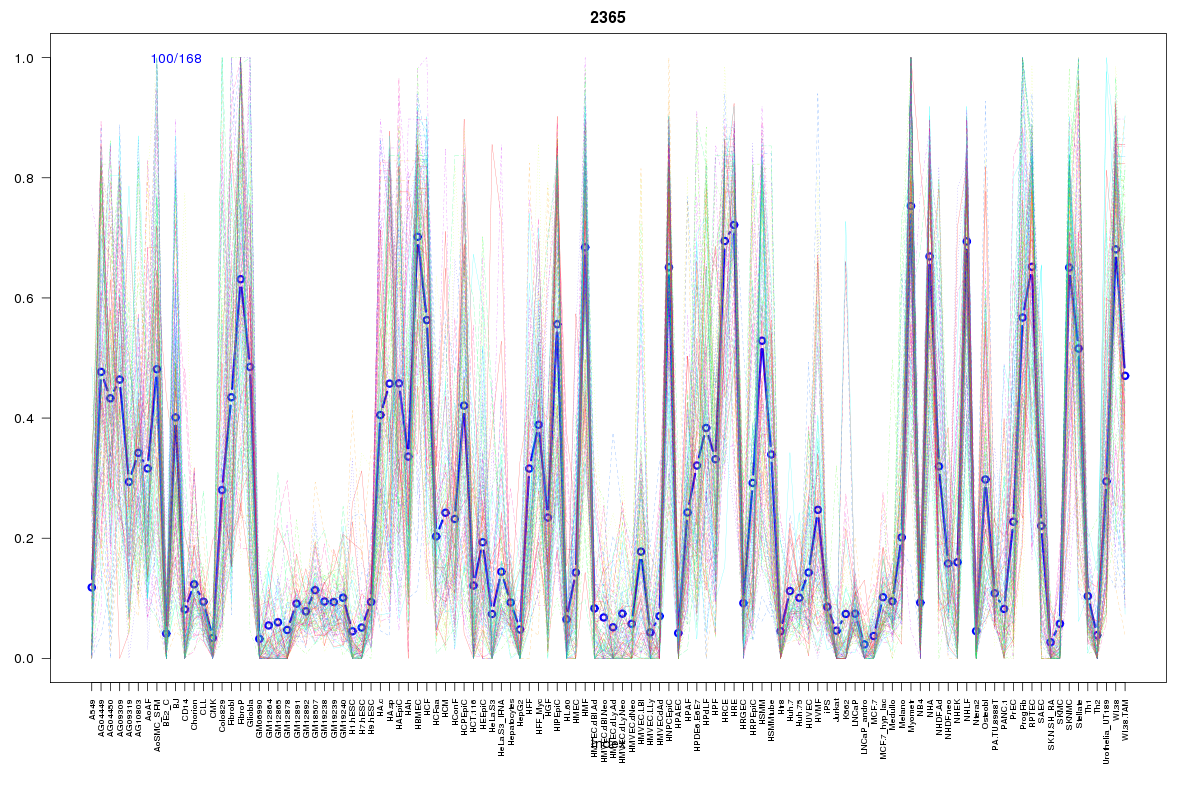 | 2365 | 1 |
 | 2457 | 1 |
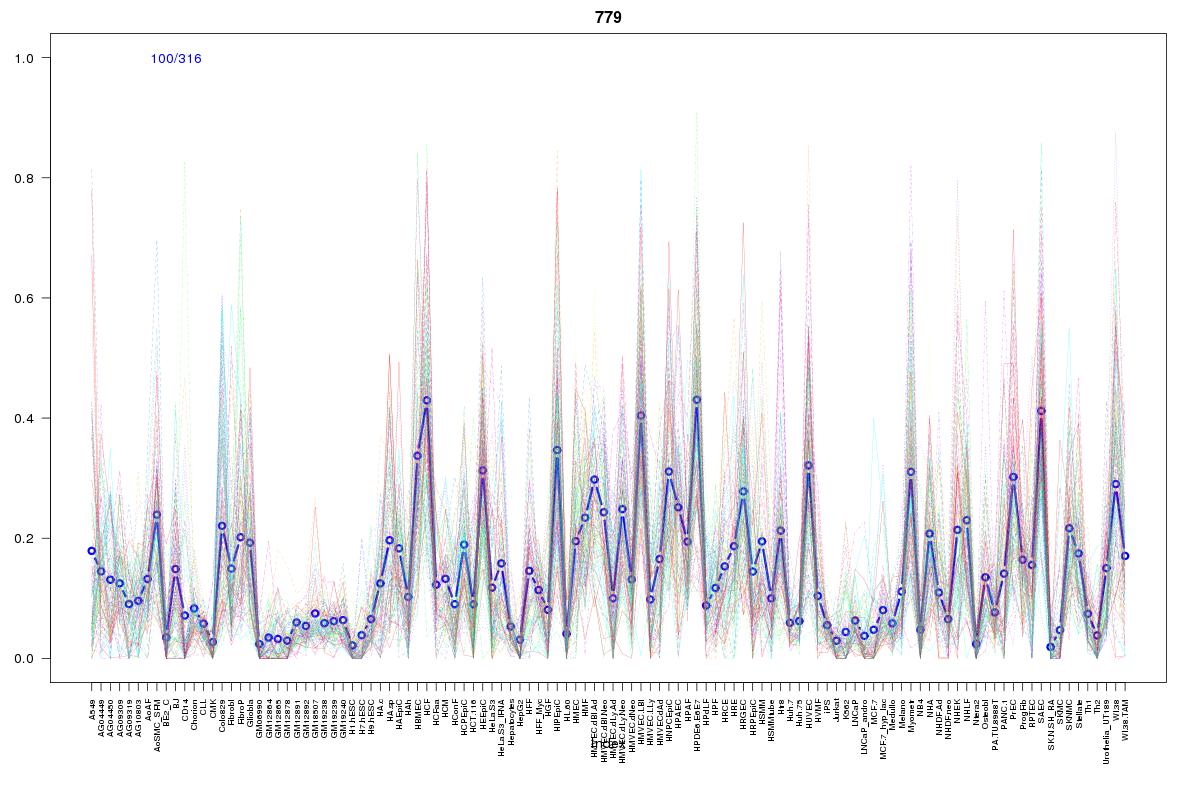 | 779 | 1 |
 | 1345 | 1 |
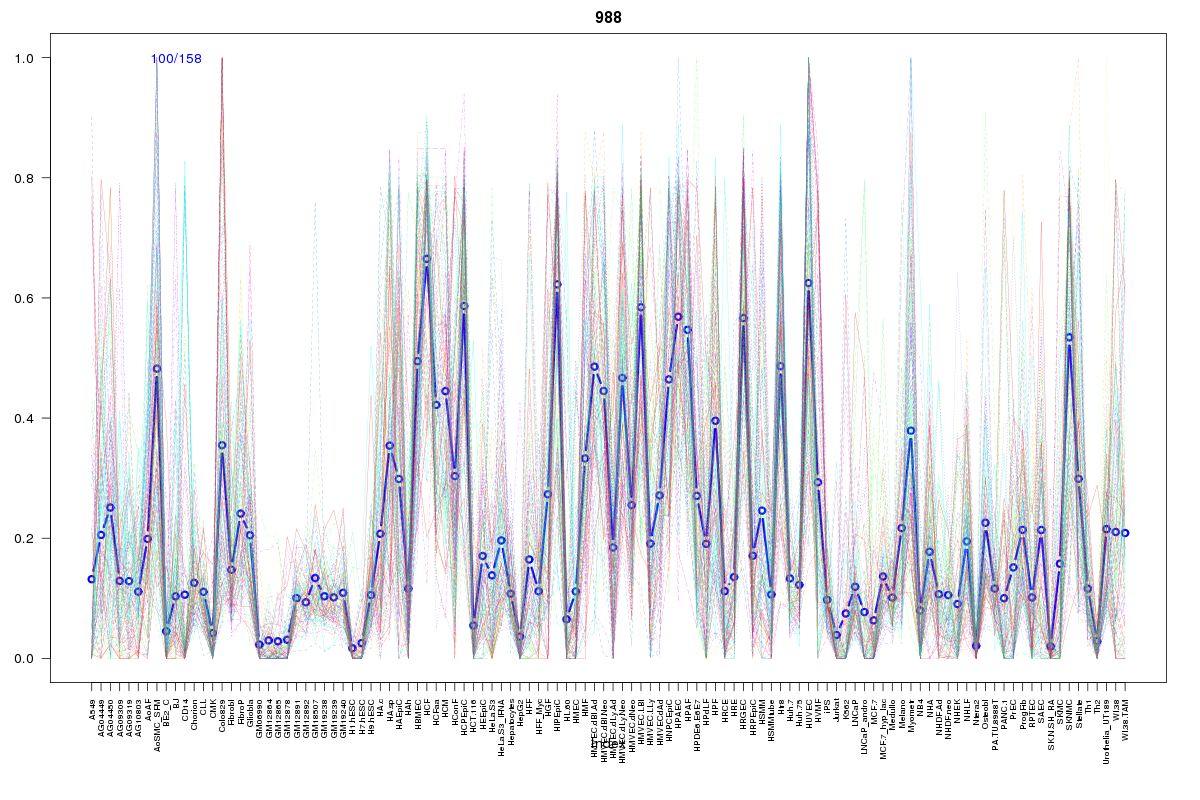 | 988 | 1 |
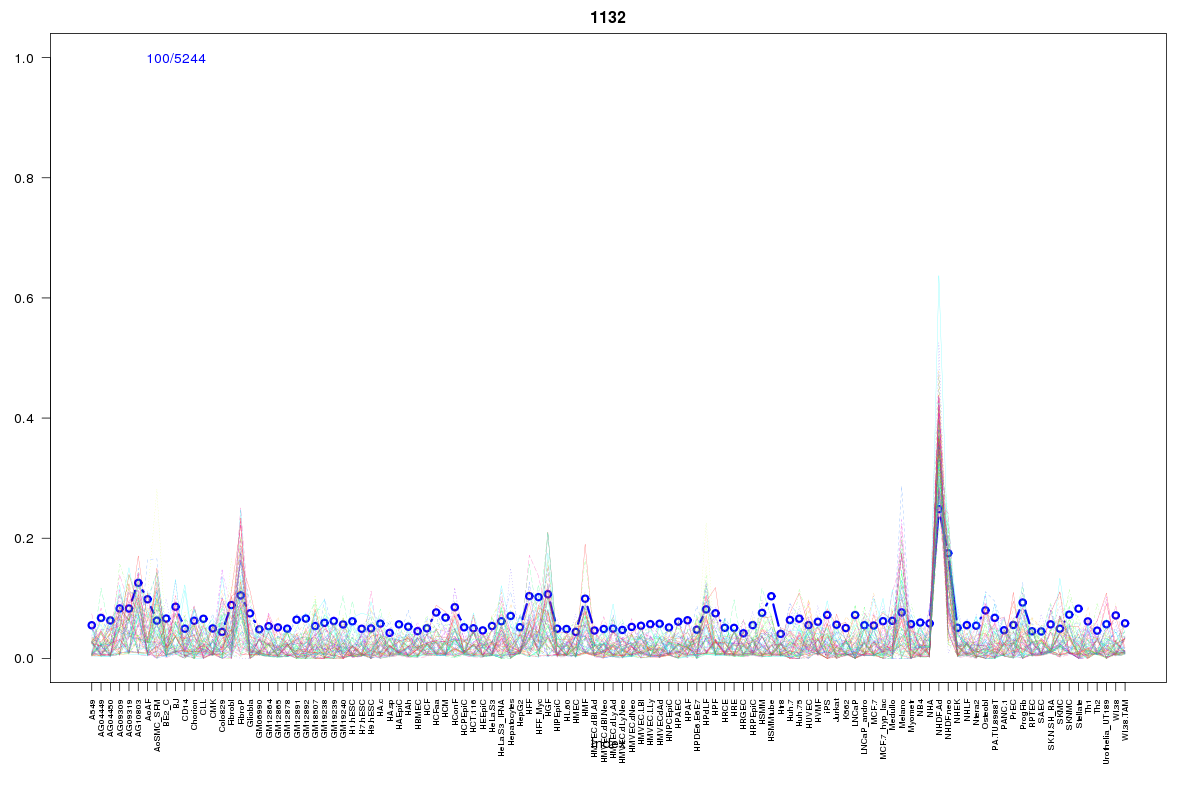 | 1132 | 1 |
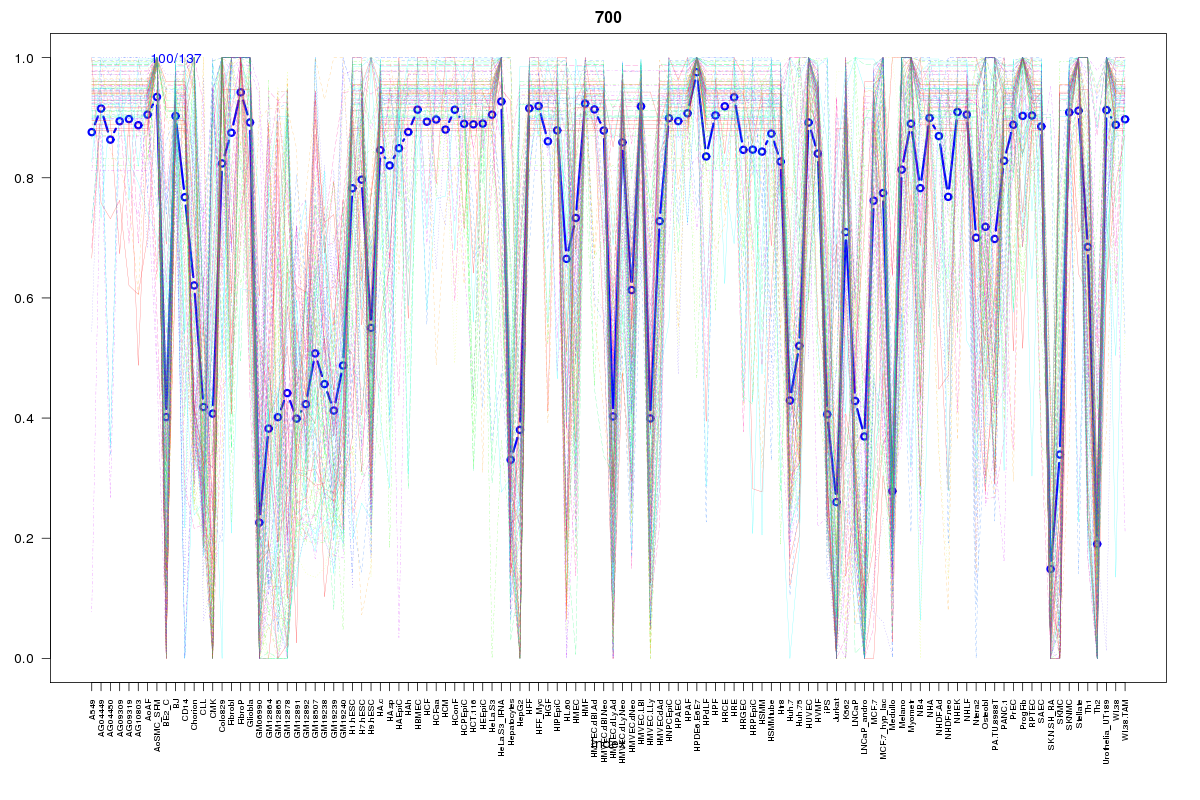 | 700 | 1 |
 | 1738 | 1 |
 | 1595 | 1 |
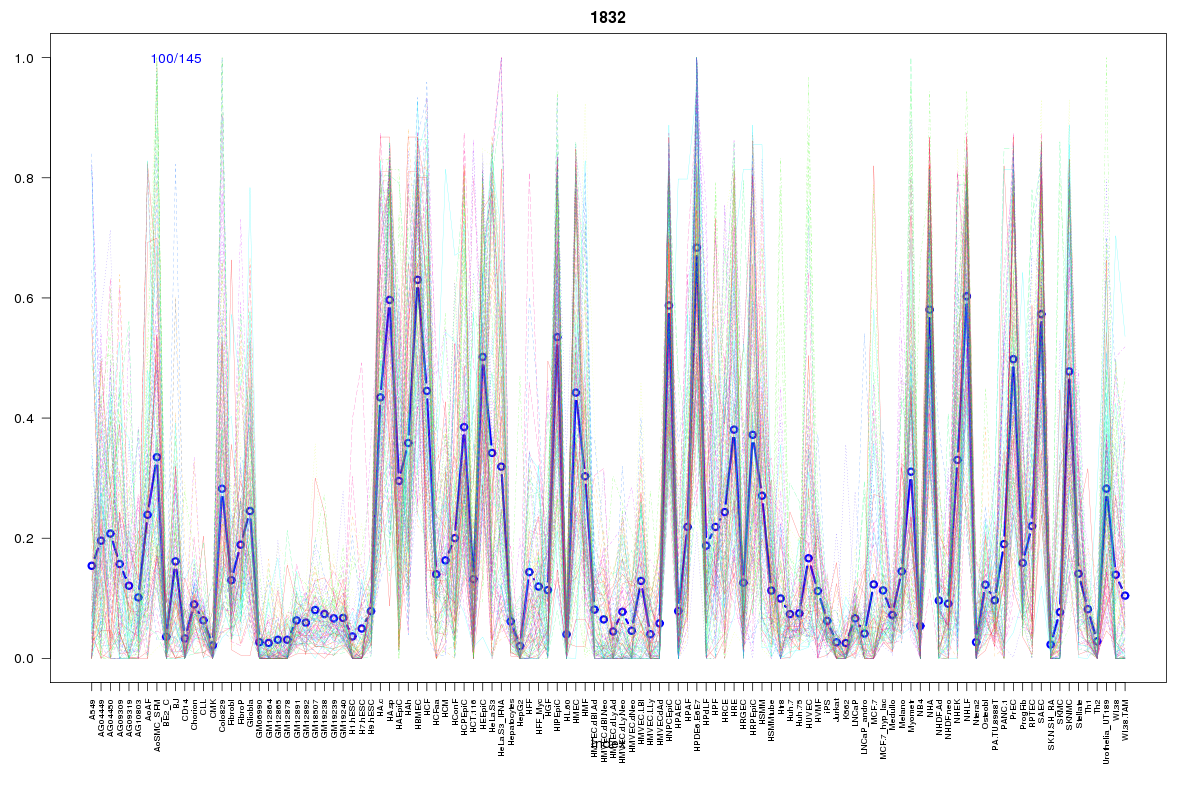 | 1832 | 1 |
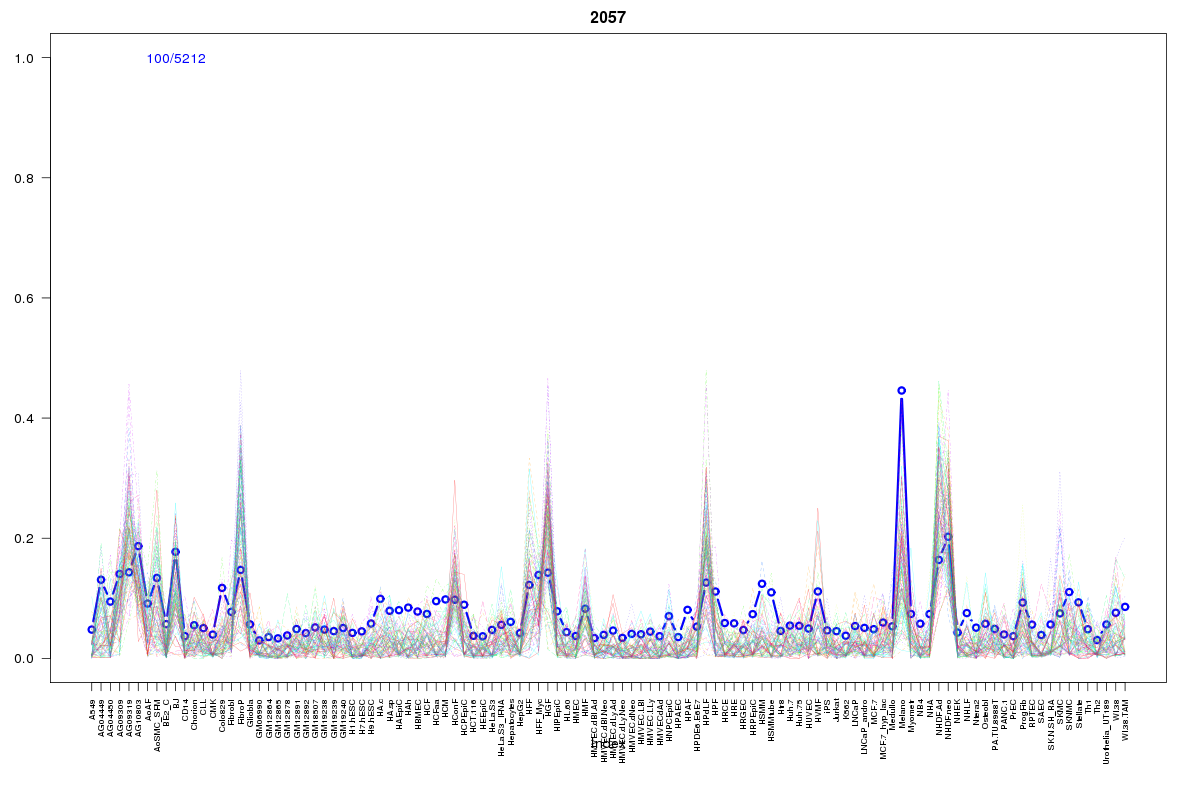 | 2057 | 1 |
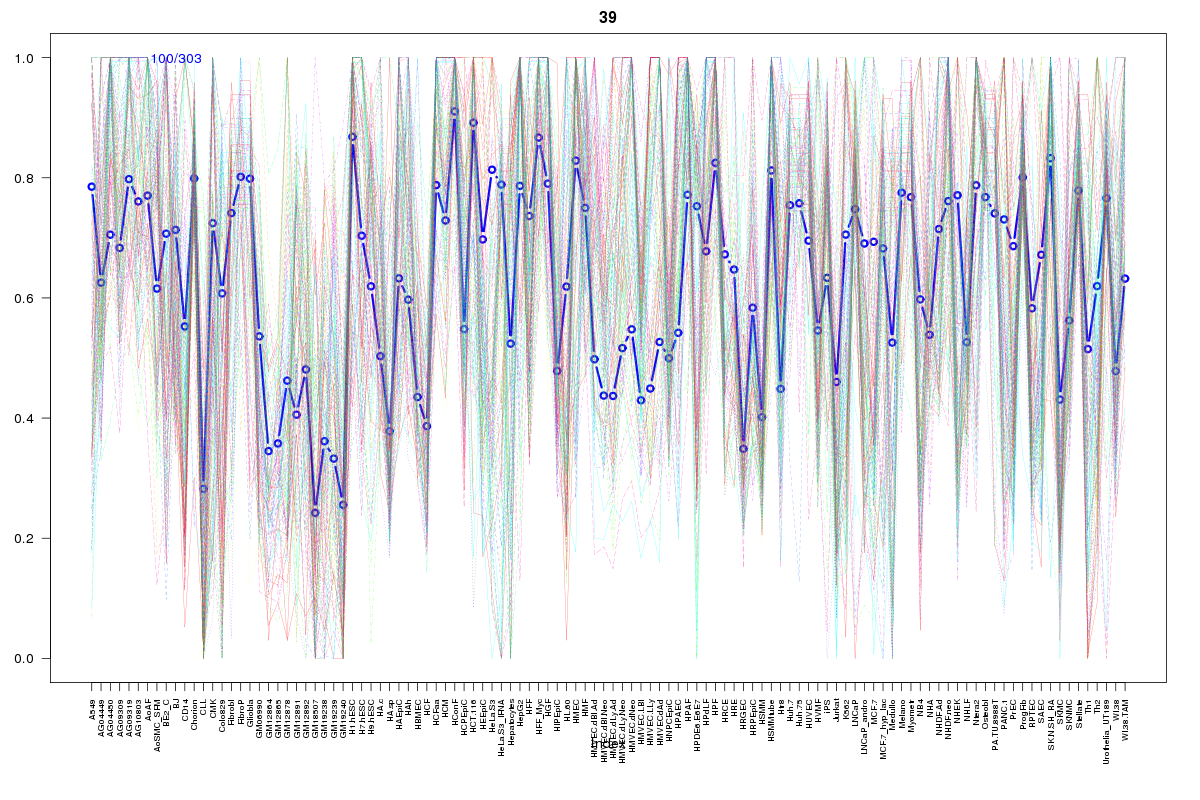 | 39 | 1 |
 | 1964 | 1 |
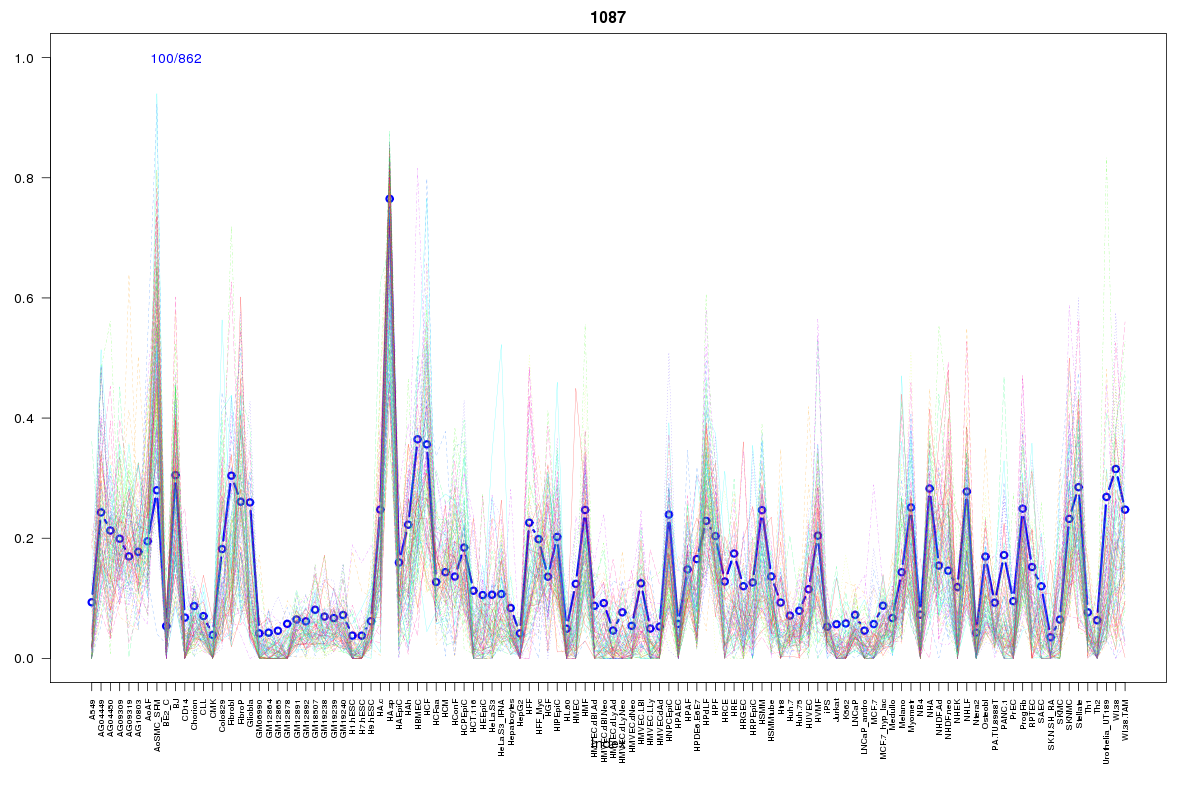 | 1087 | 1 |
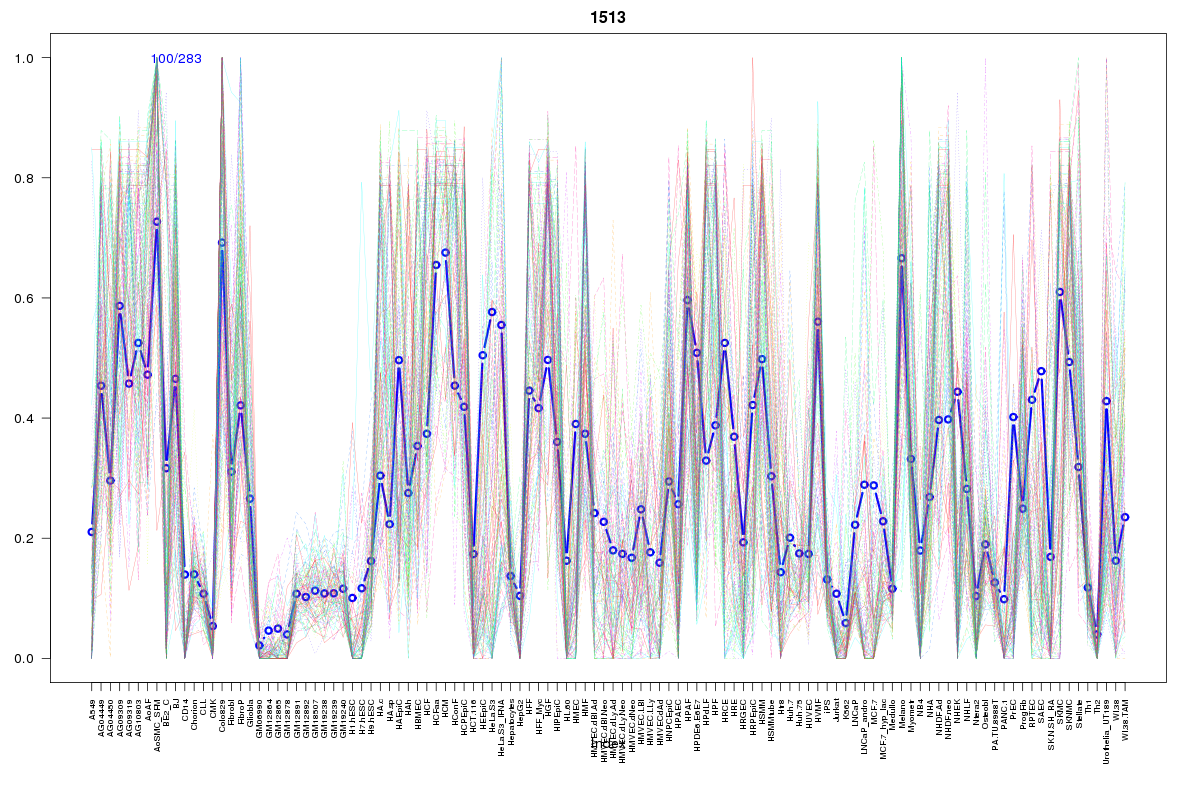 | 1513 | 1 |
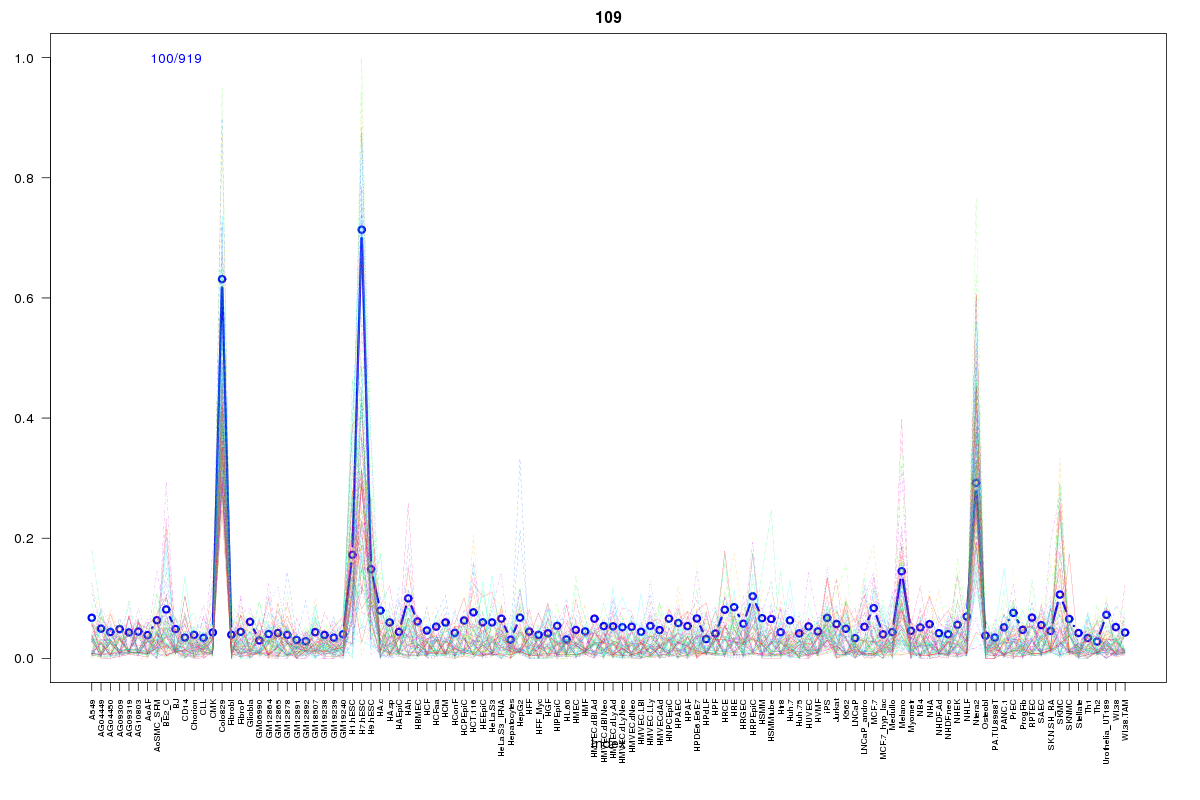 | 109 | 1 |
 | 62 | 1 |
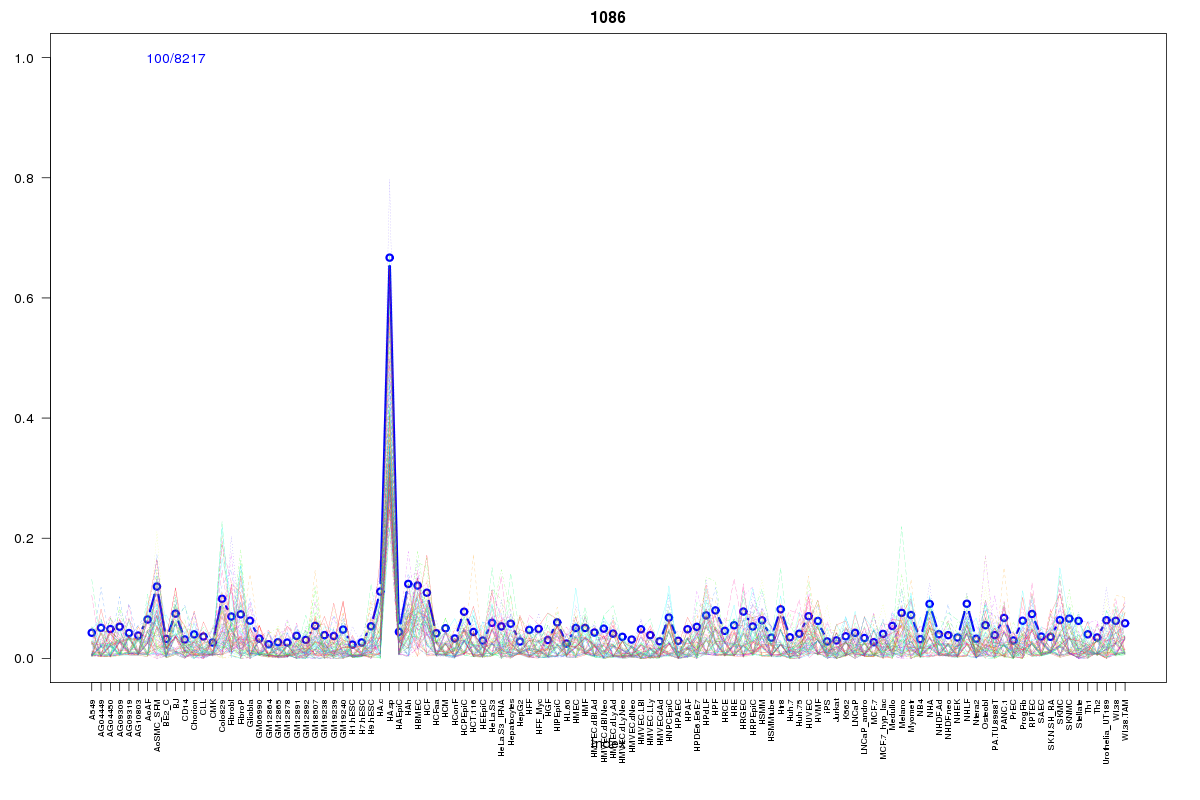 | 1086 | 1 |
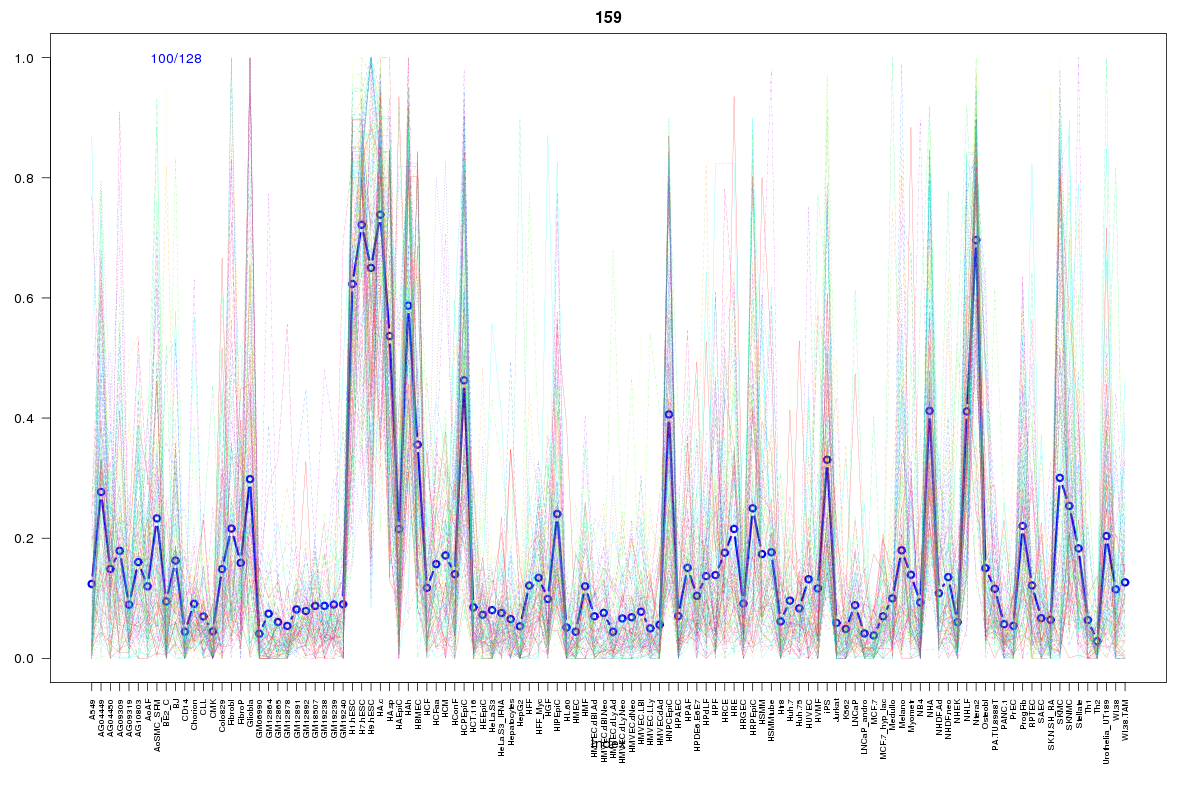 | 159 | 1 |
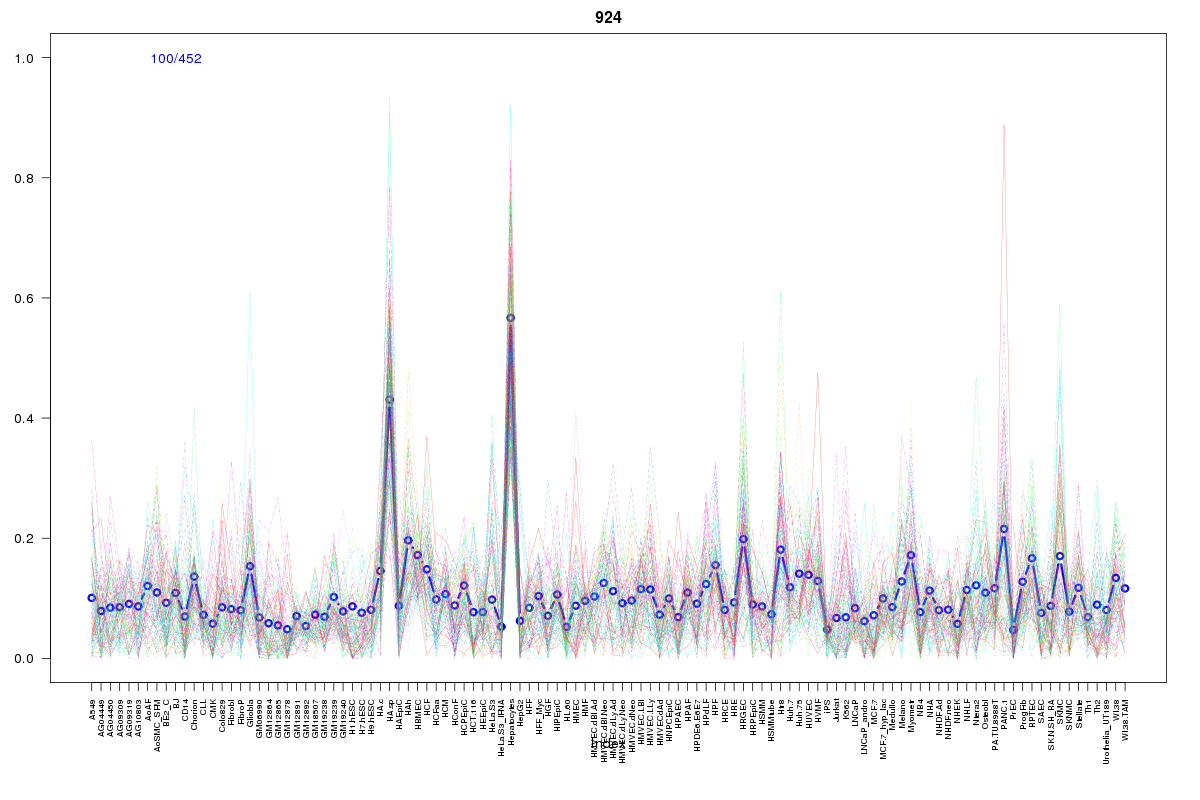 | 924 | 1 |
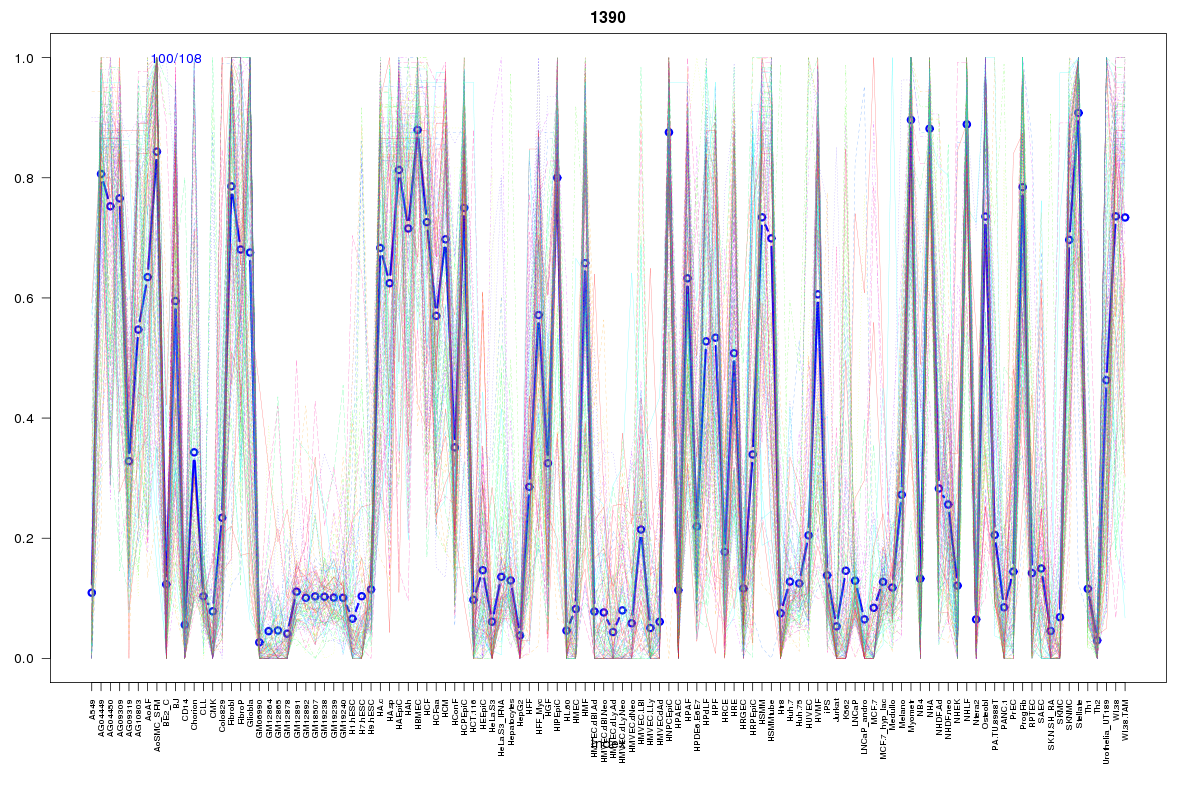 | 1390 | 1 |
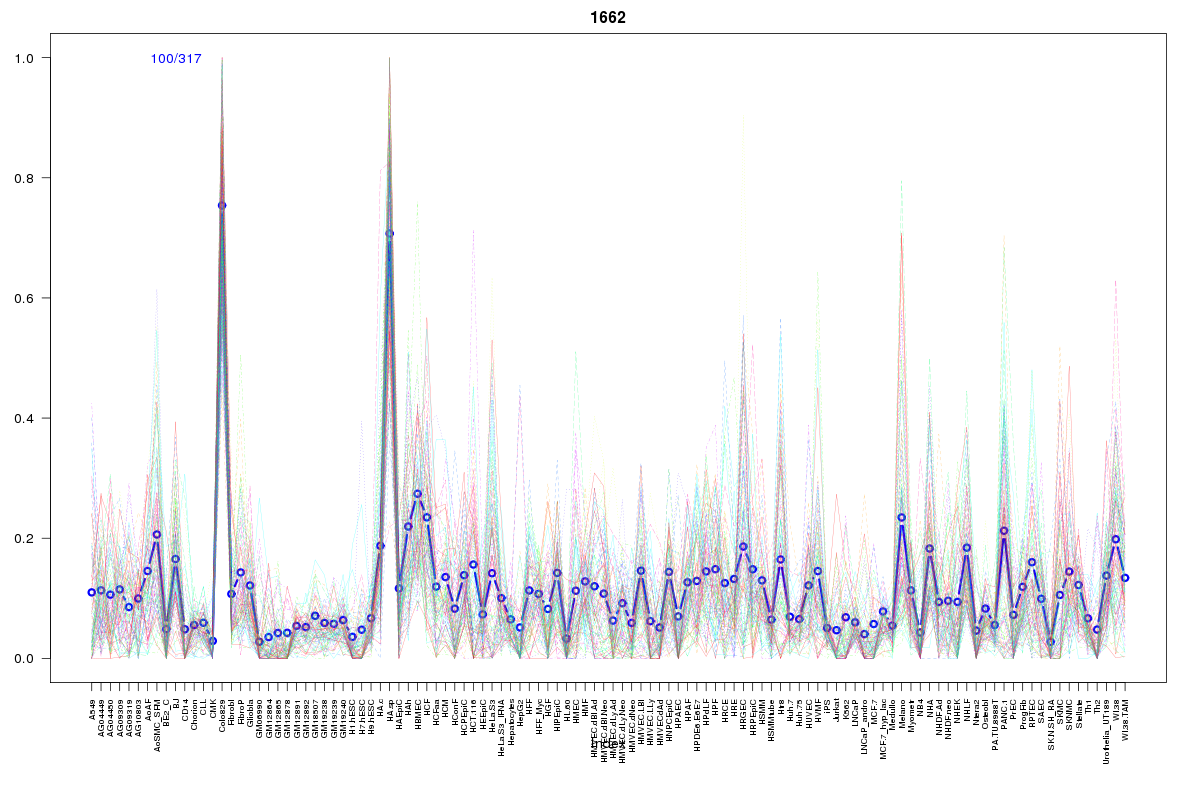 | 1662 | 1 |
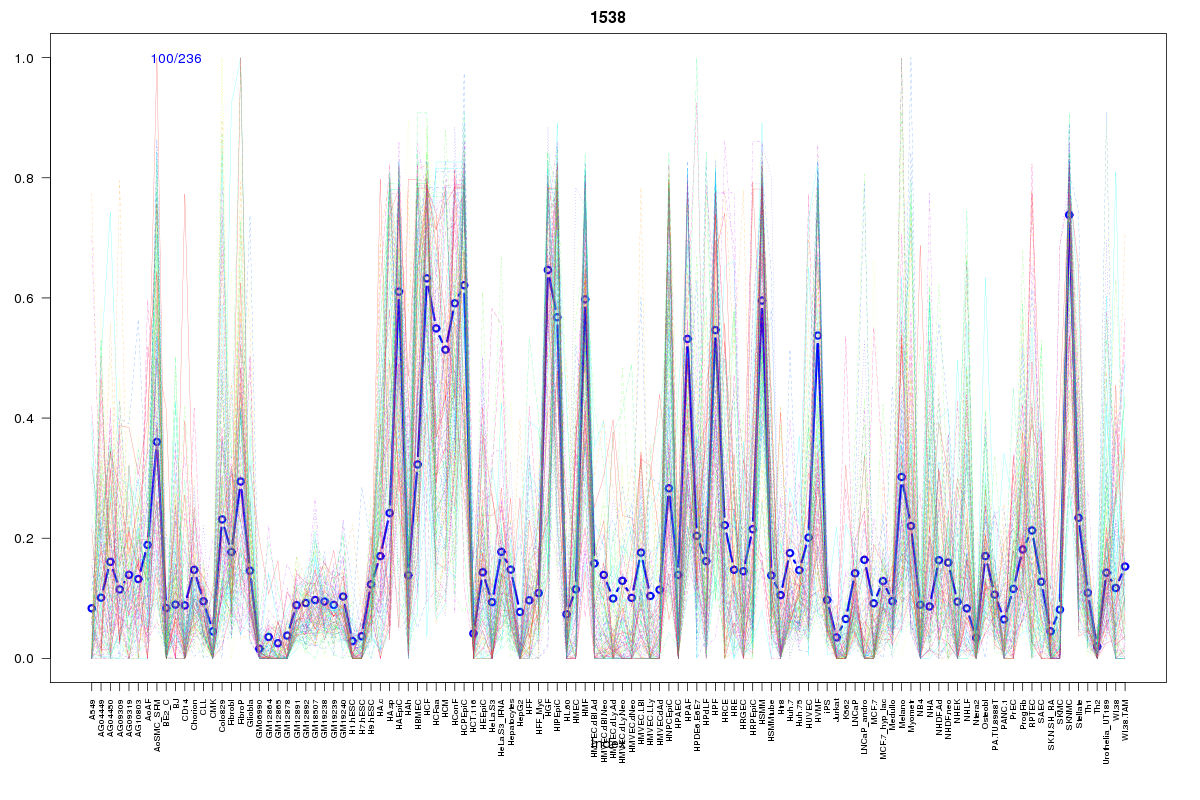 | 1538 | 1 |
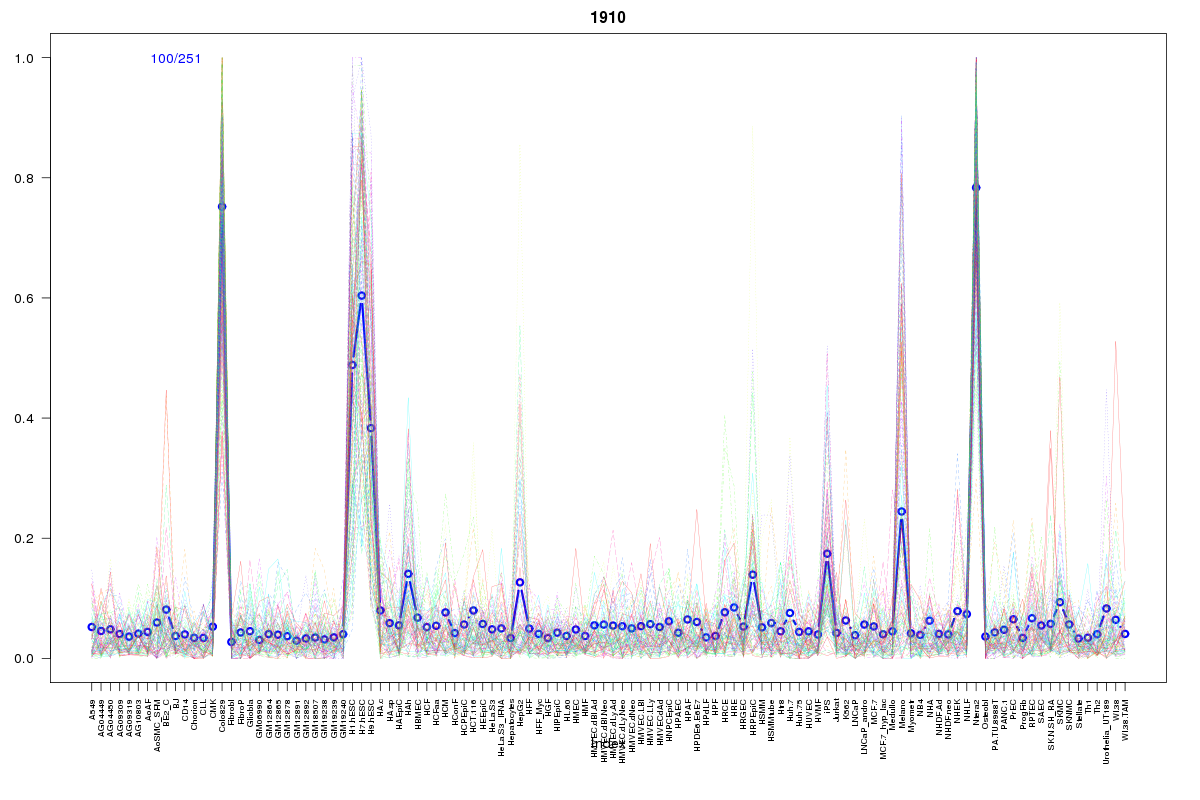 | 1910 | 1 |
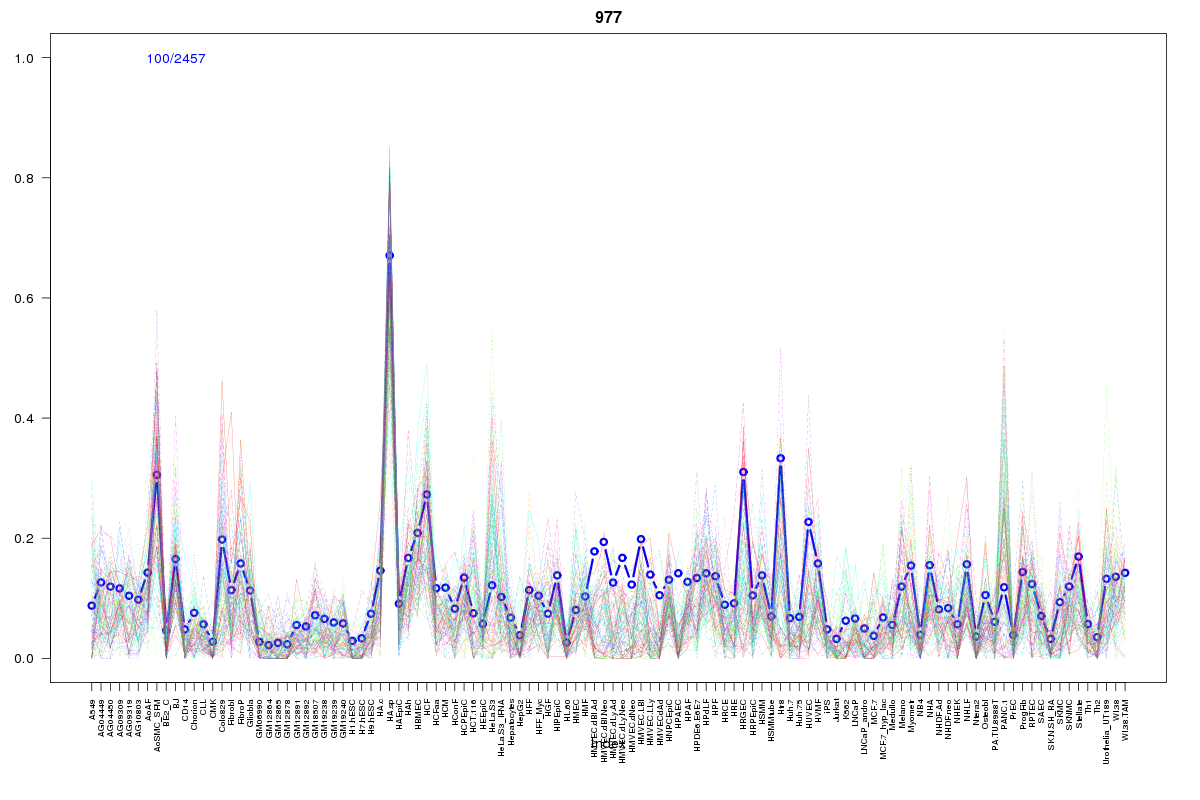 | 977 | 1 |
 | 73 | 1 |
 | 600 | 1 |
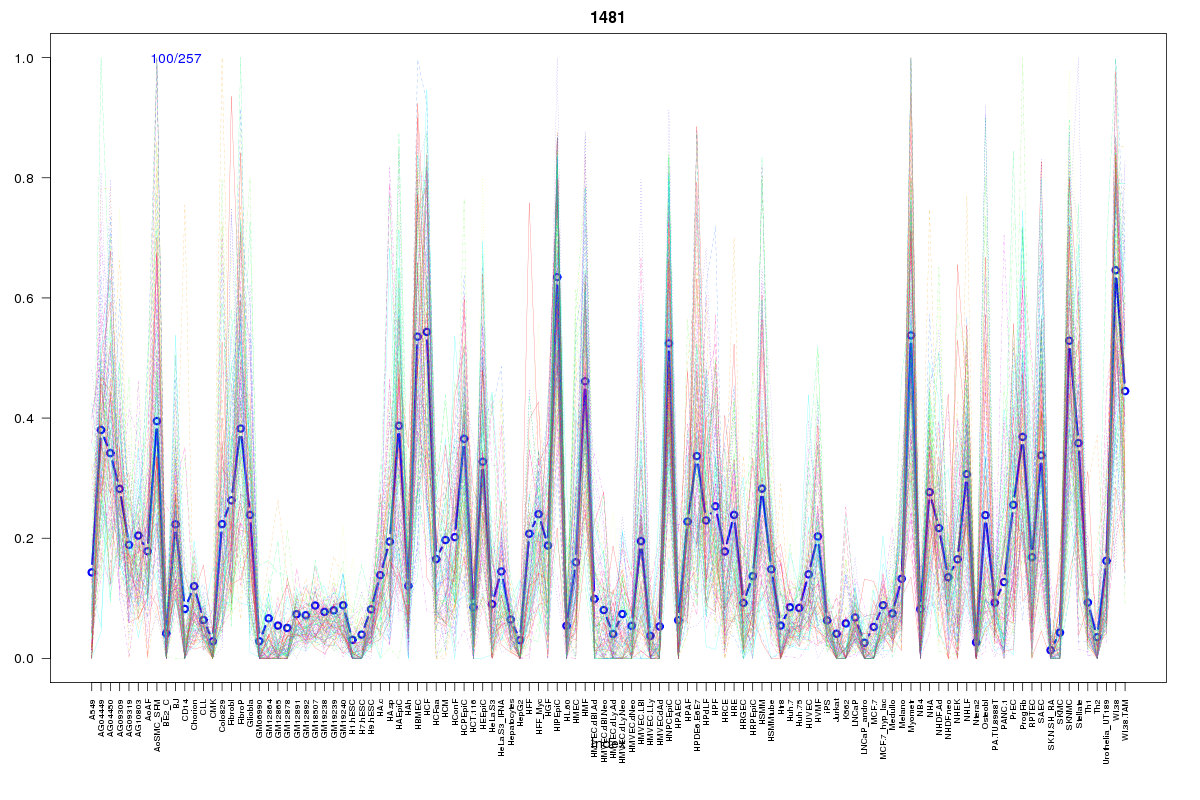 | 1481 | 1 |
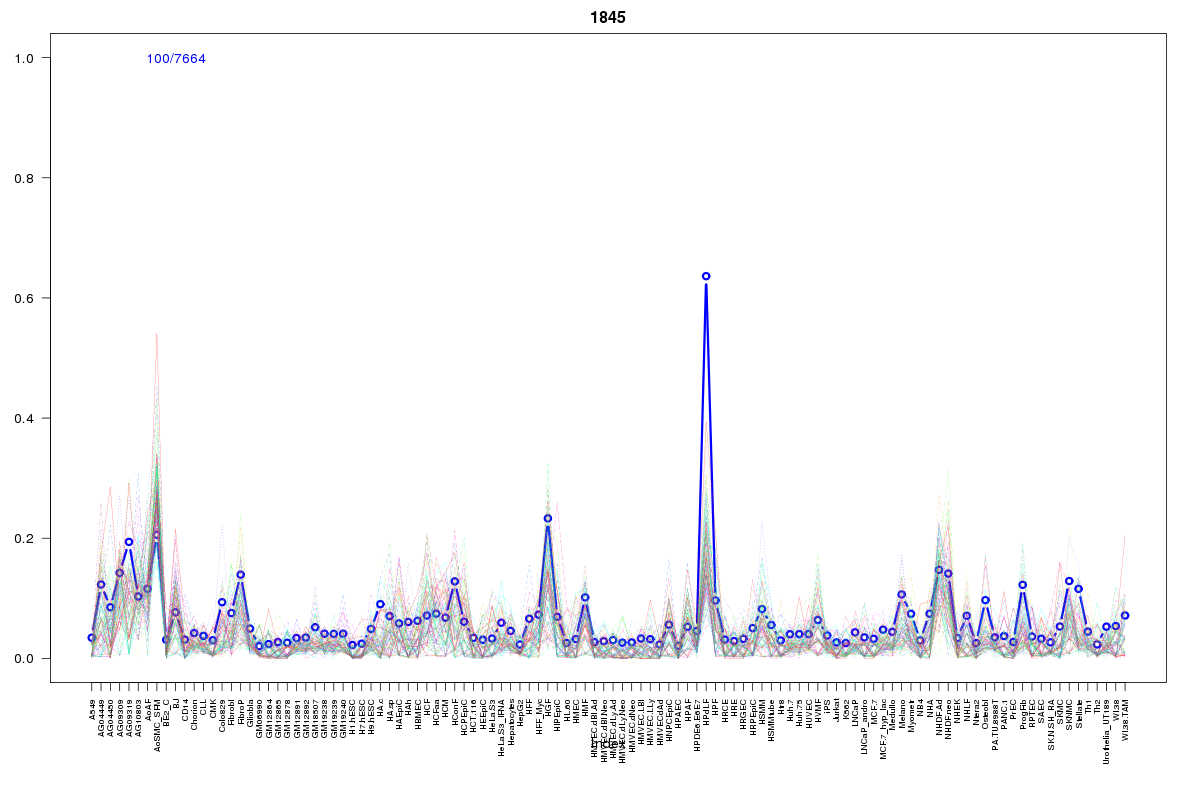 | 1845 | 1 |
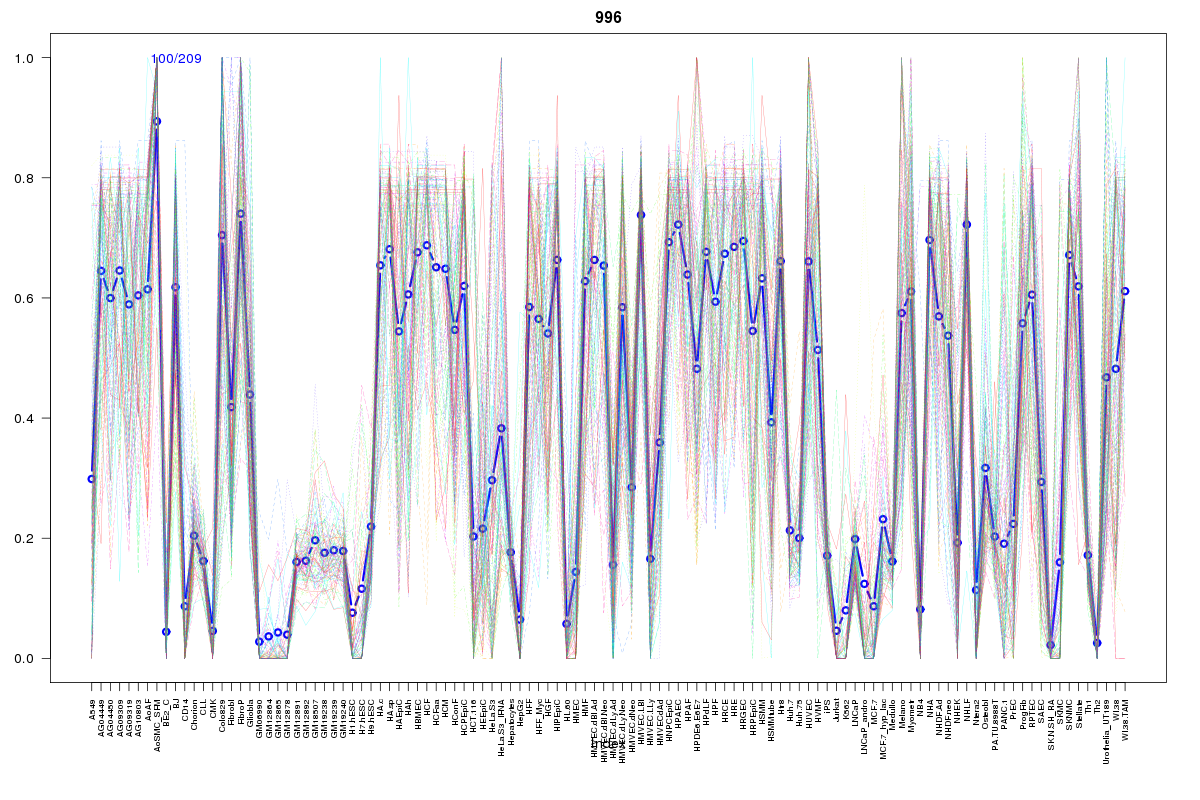 | 996 | 1 |
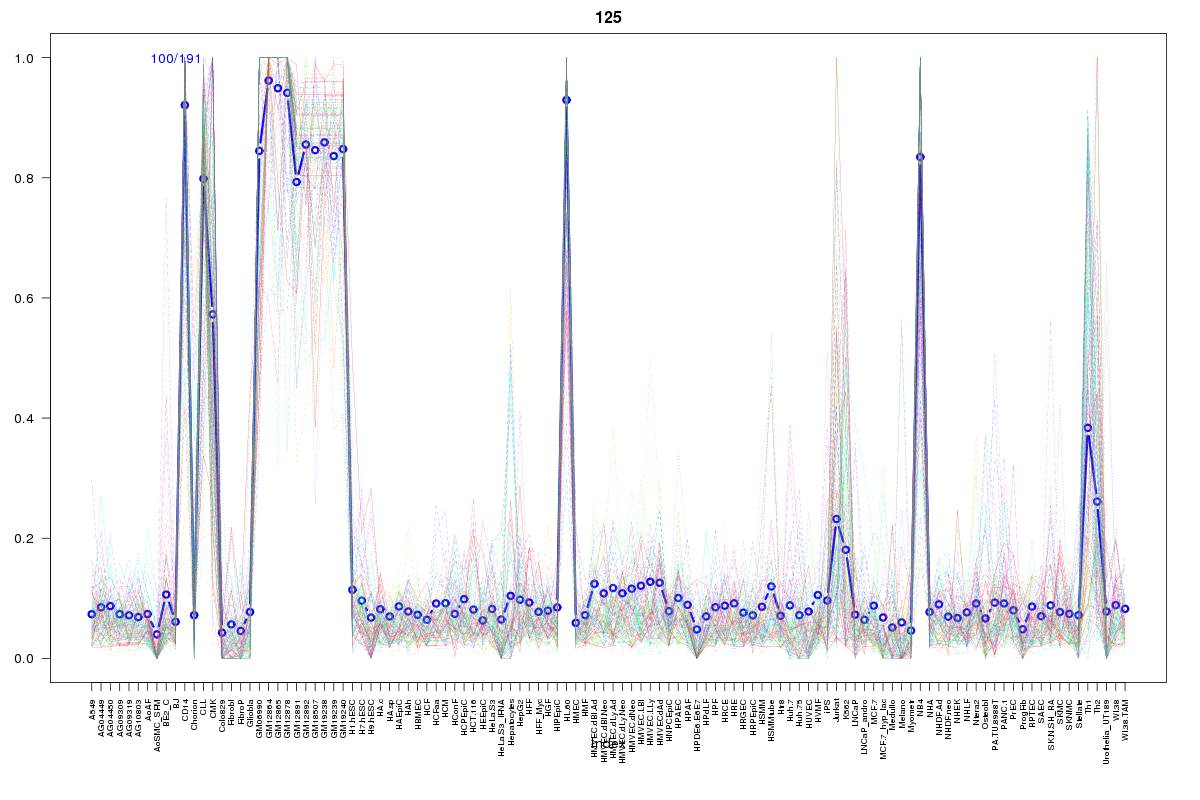 | 125 | 1 |
 | 957 | 1 |
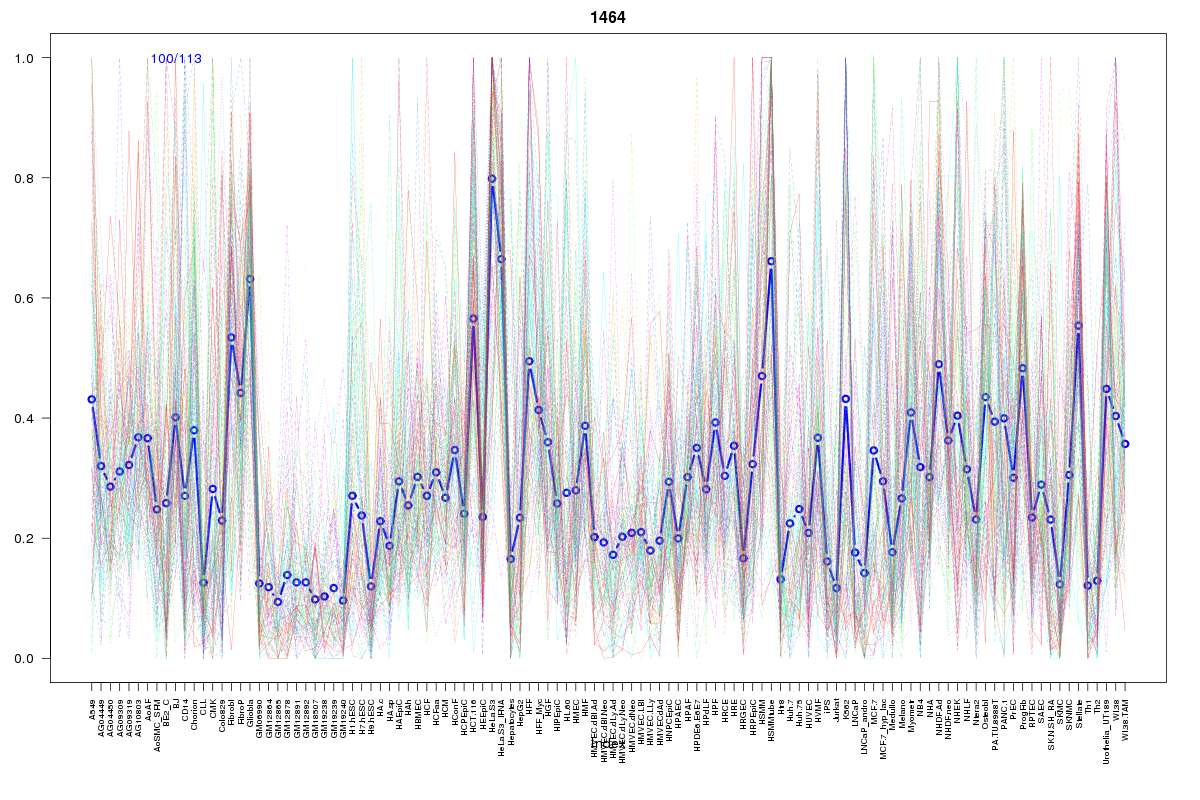 | 1464 | 1 |
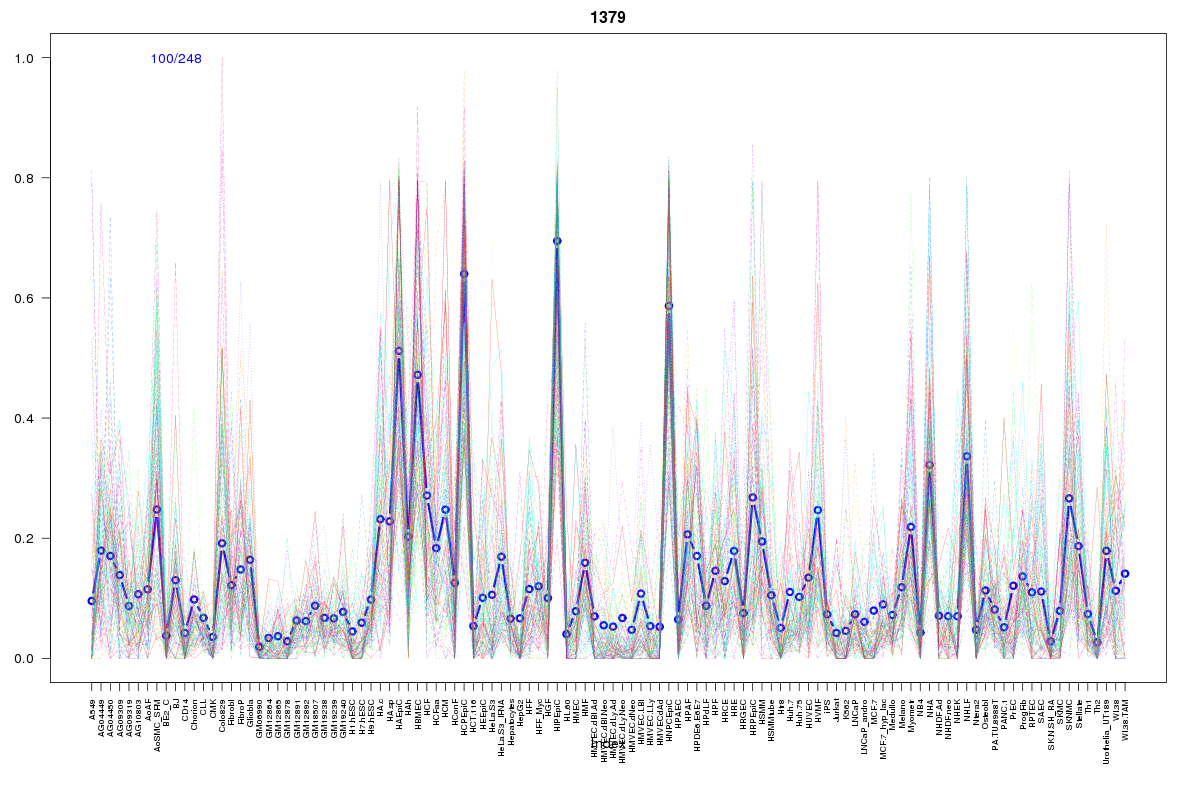 | 1379 | 1 |
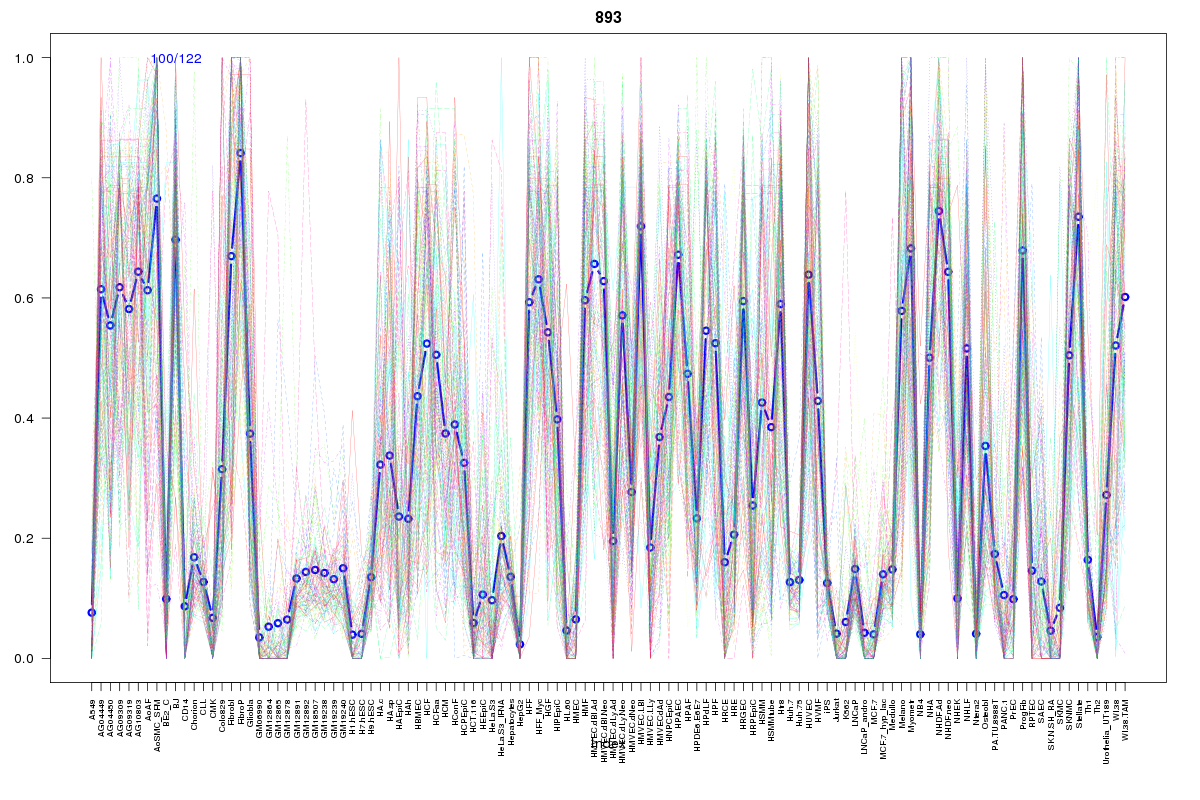 | 893 | 1 |
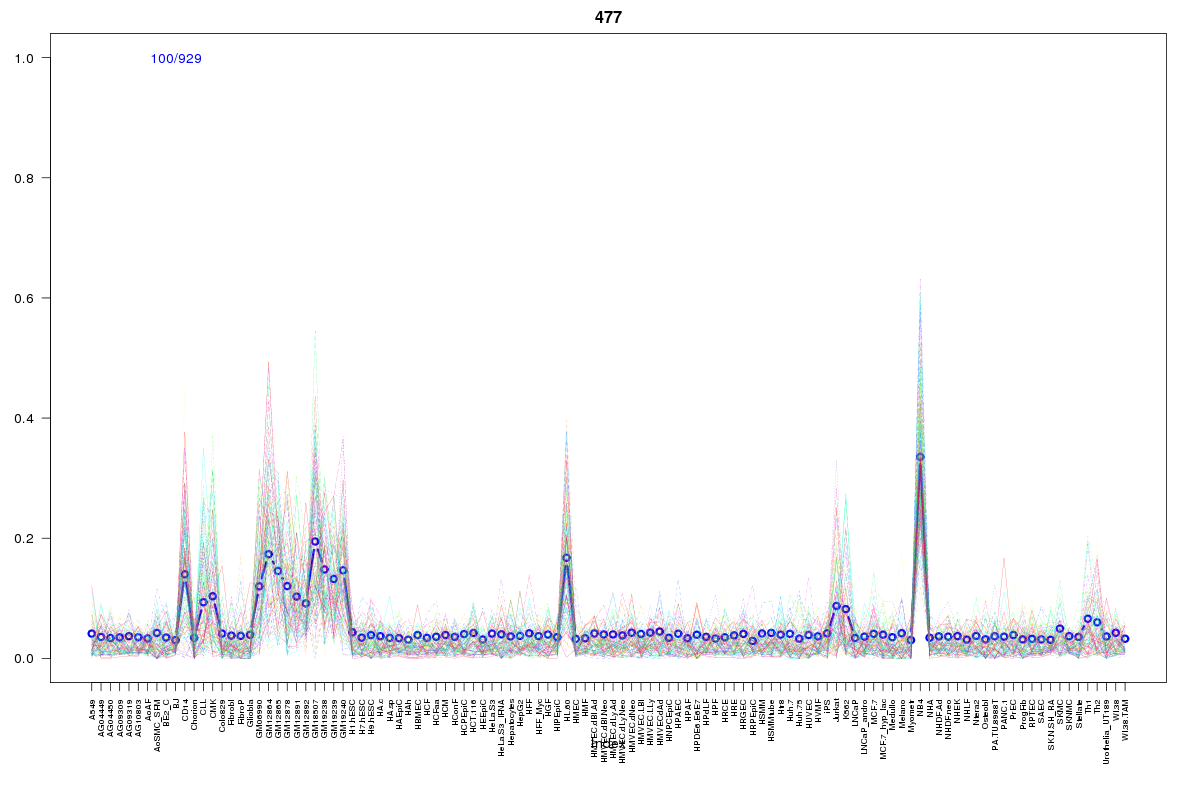 | 477 | 1 |
 | 732 | 1 |
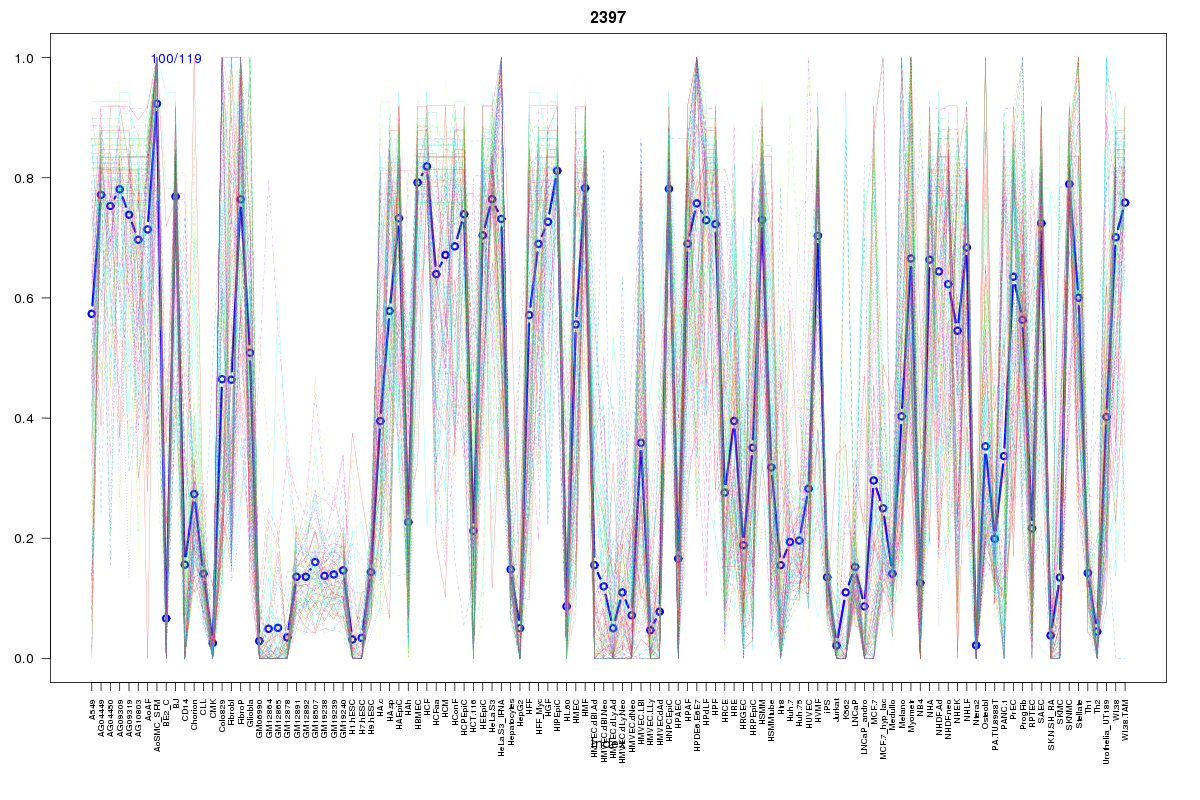 | 2397 | 1 |
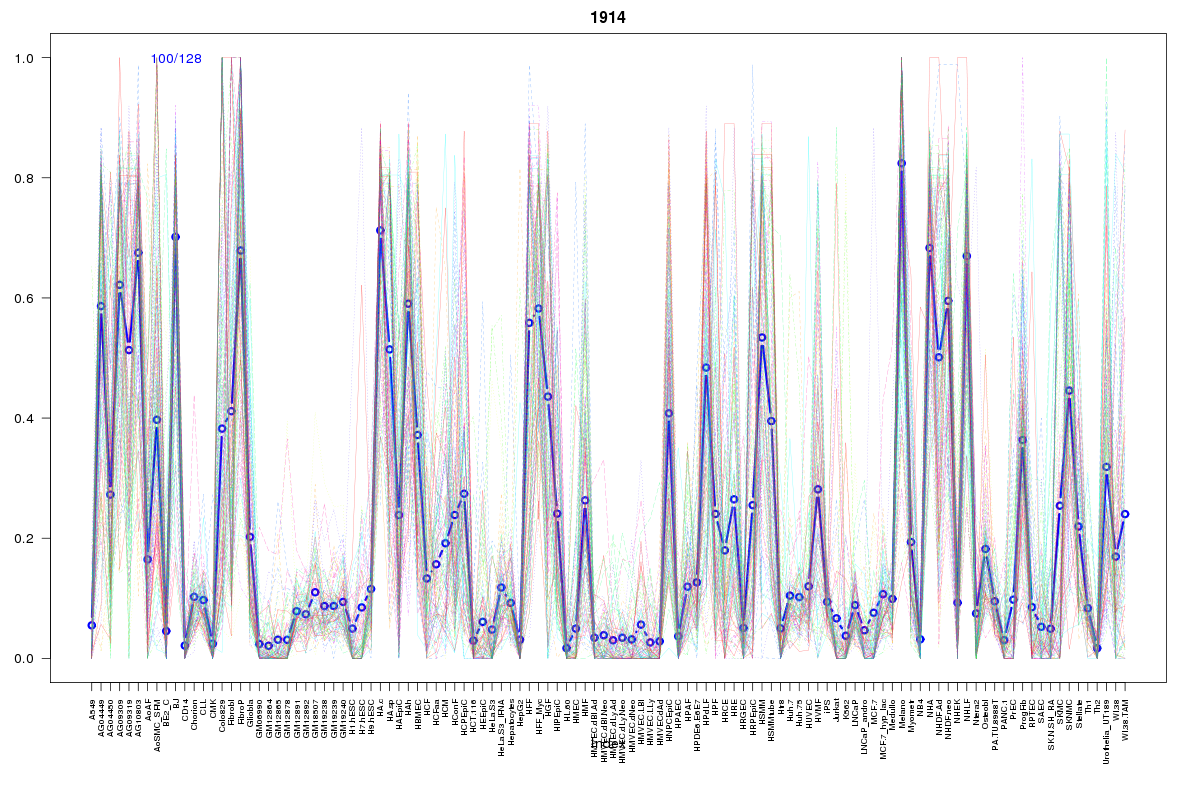 | 1914 | 1 |
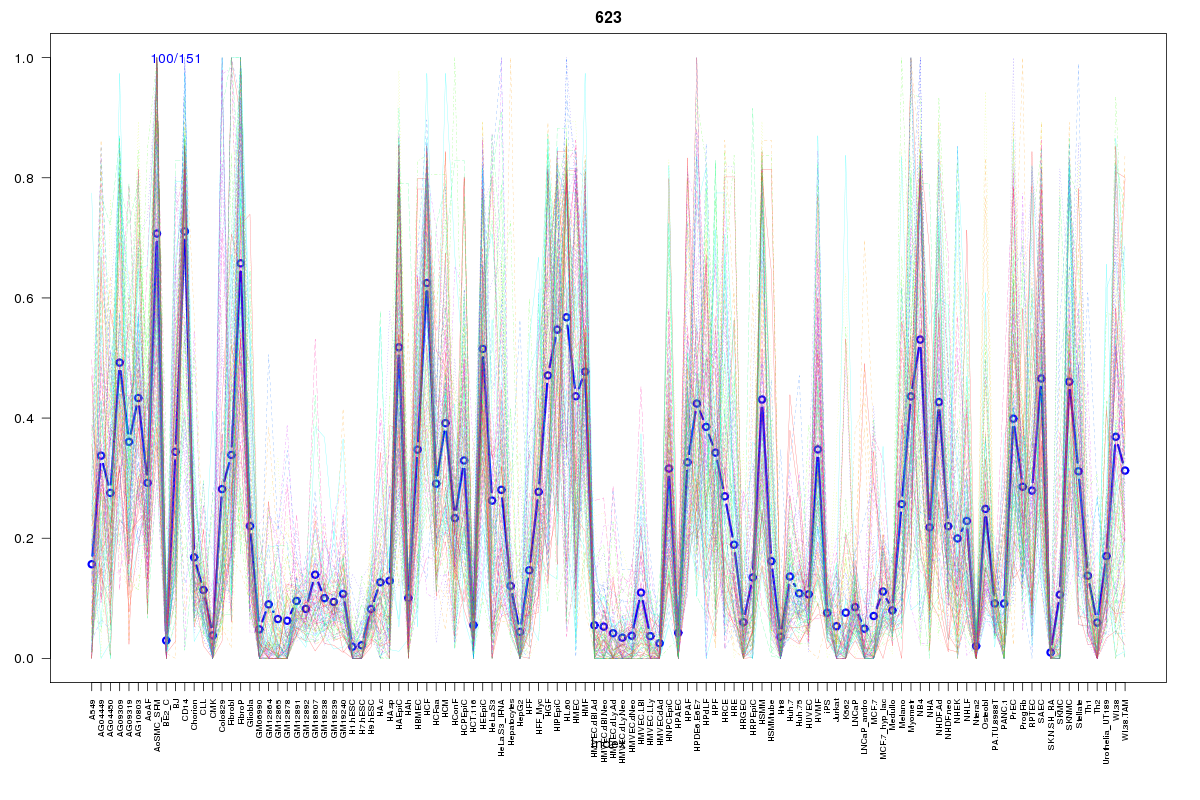 | 623 | 1 |
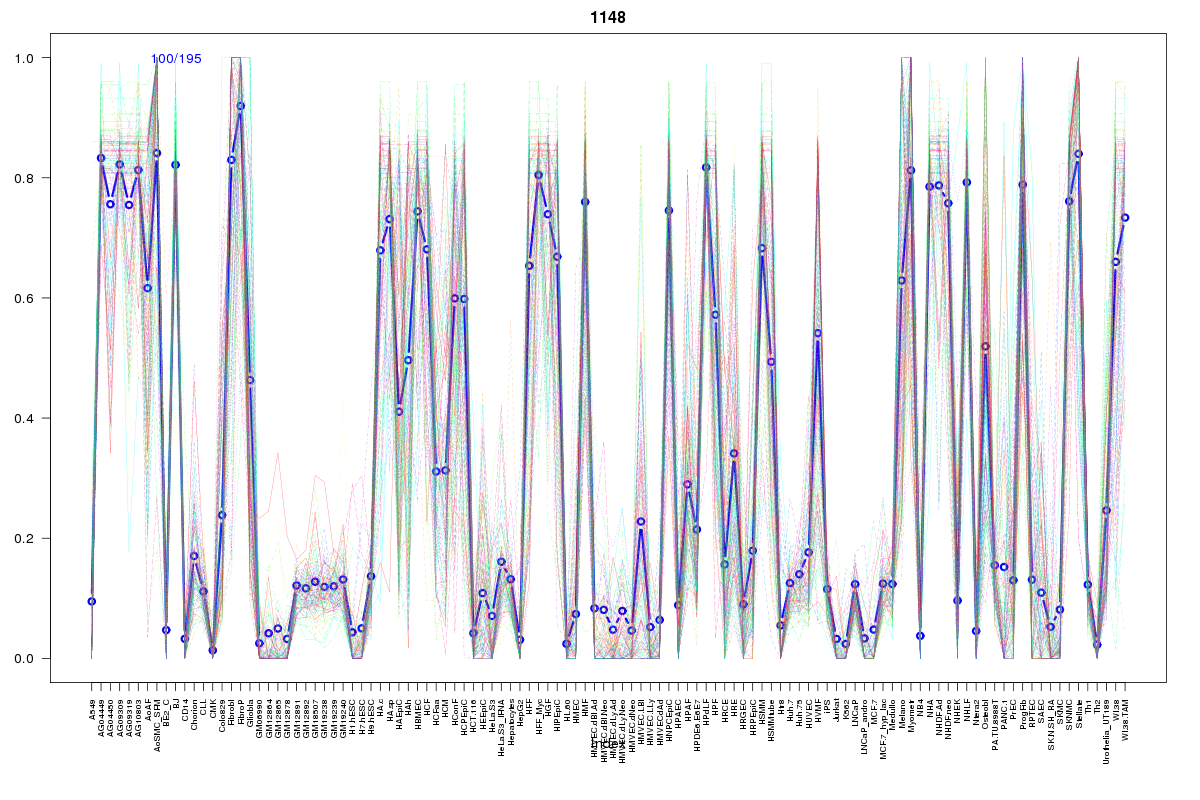 | 1148 | 1 |
 | 1348 | 1 |
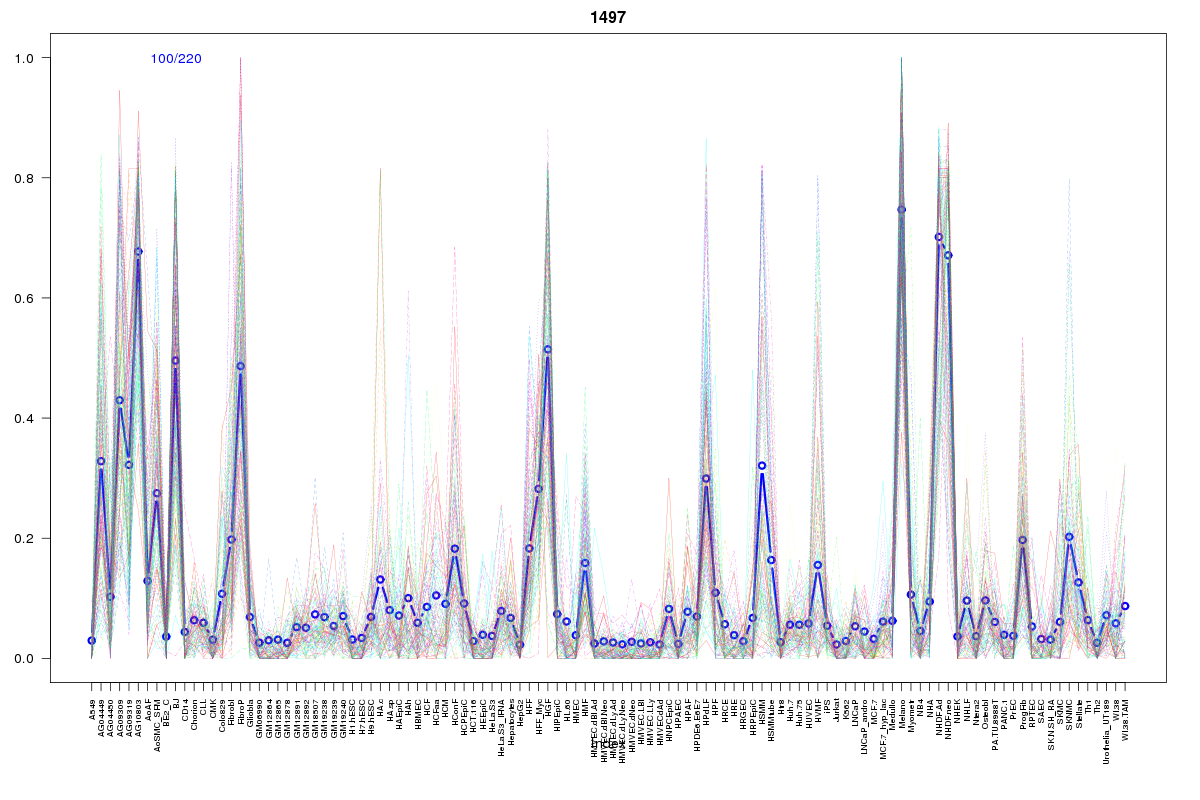 | 1497 | 1 |
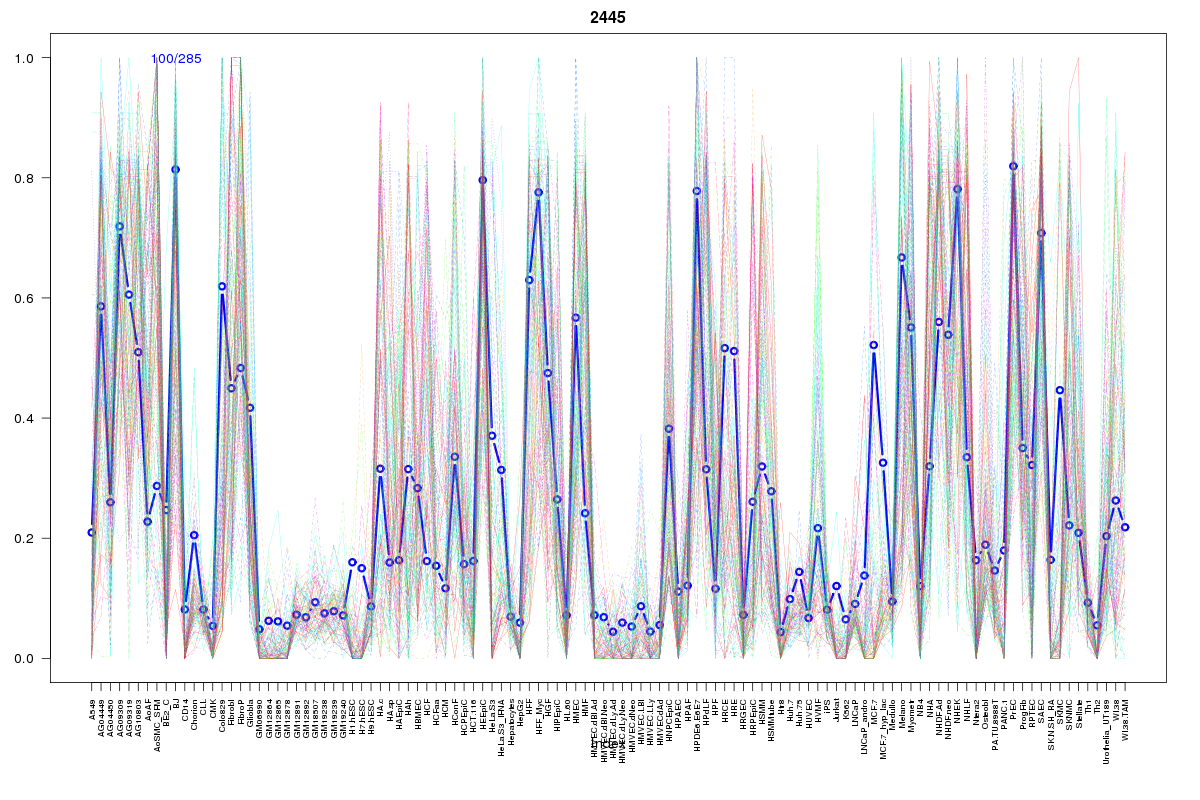 | 2445 | 1 |
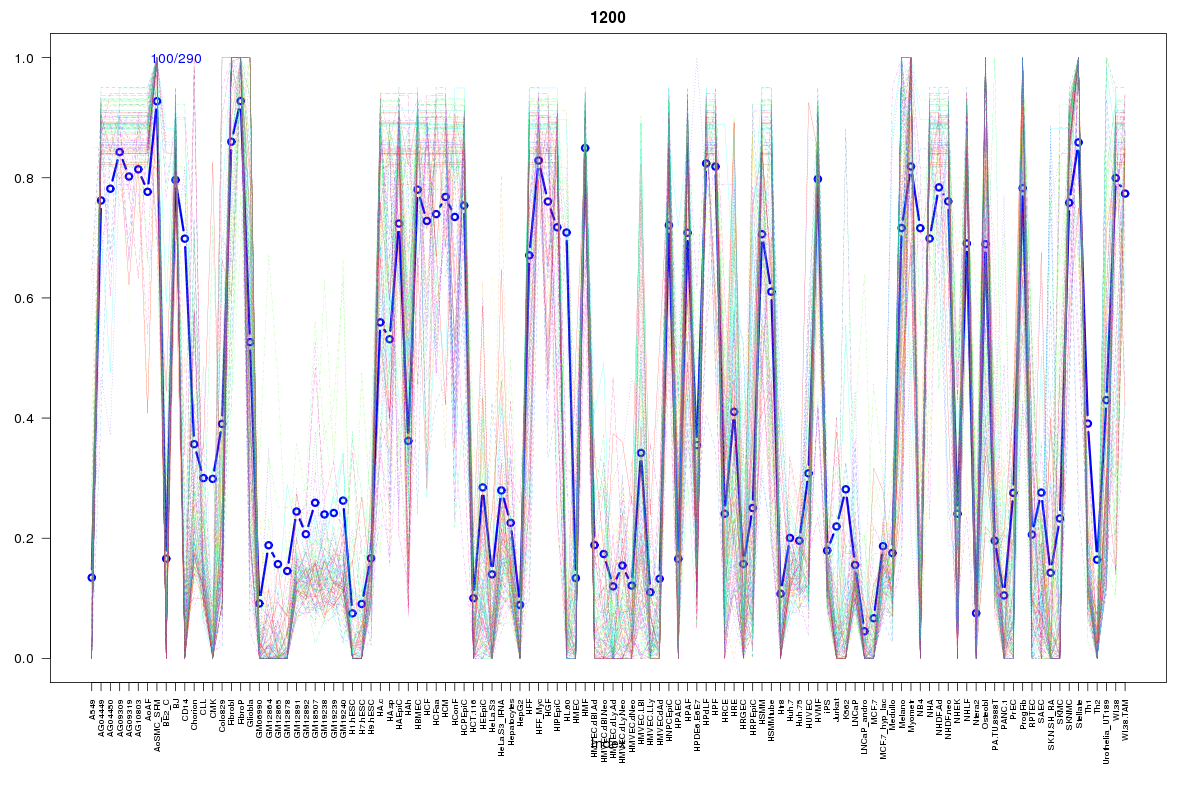 | 1200 | 1 |
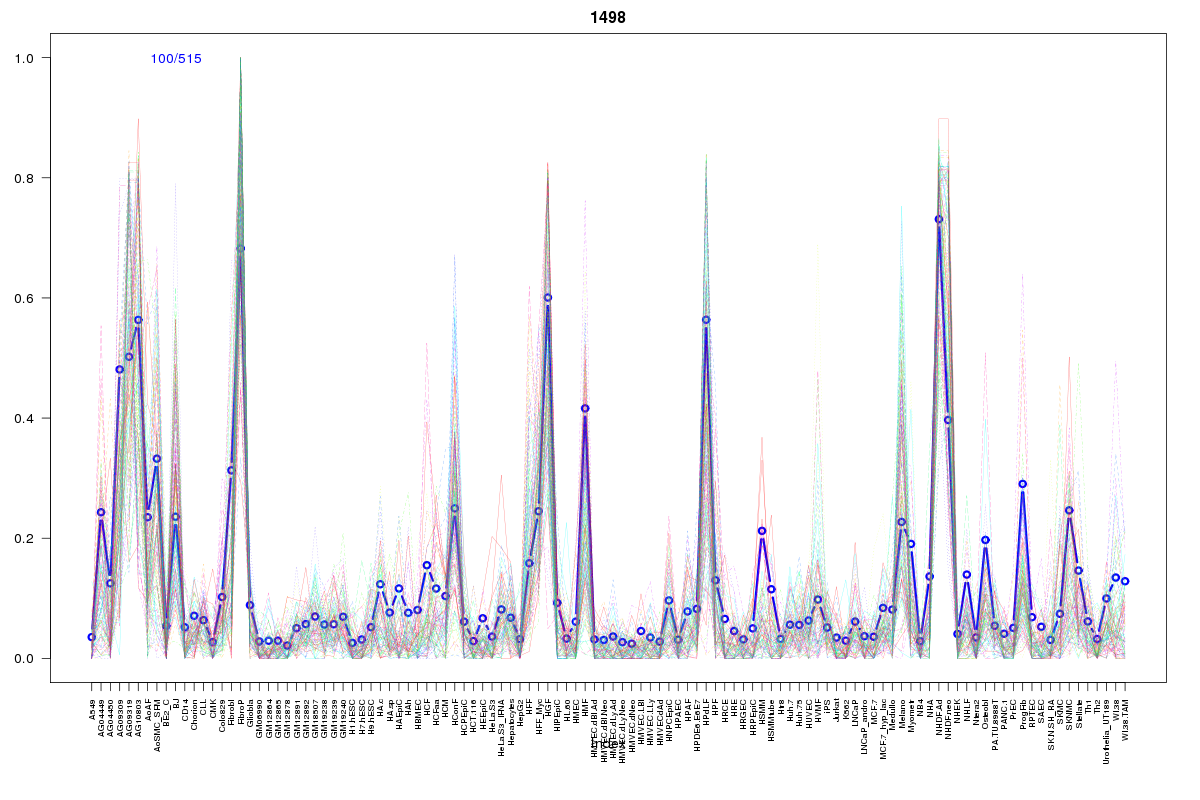 | 1498 | 1 |
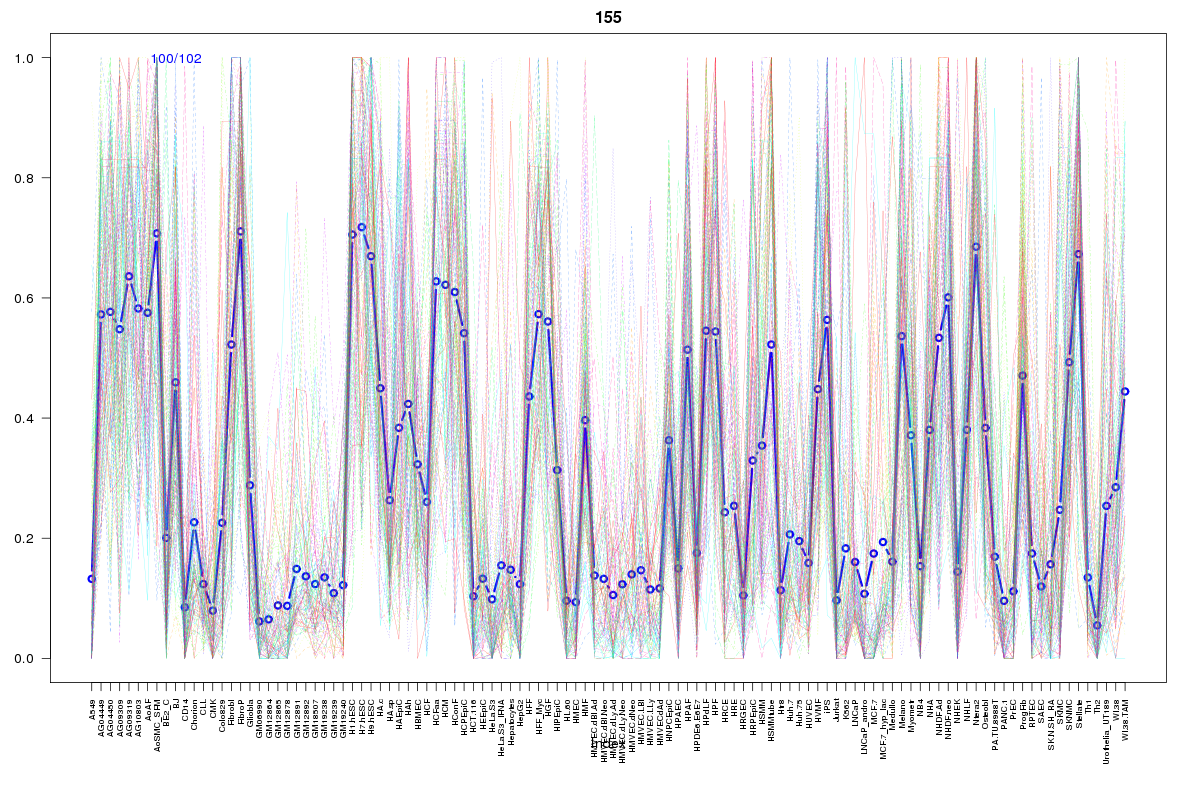 | 155 | 1 |
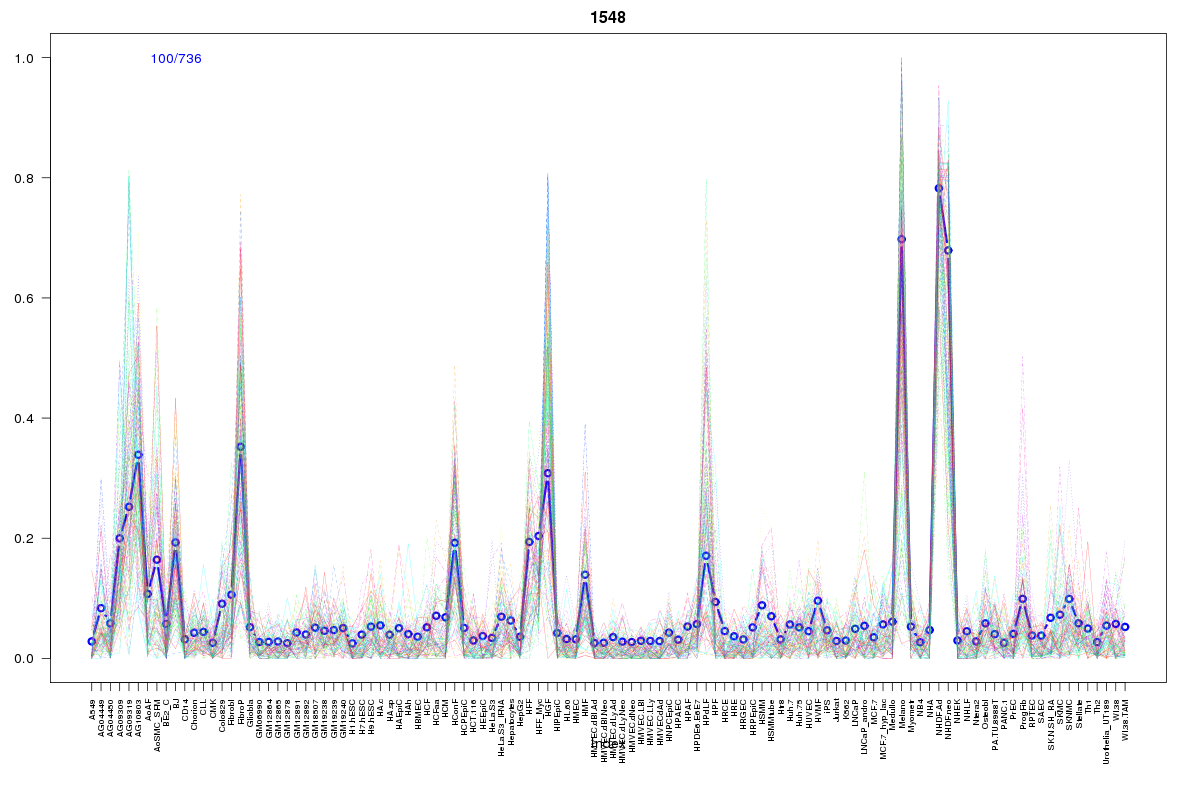 | 1548 | 1 |
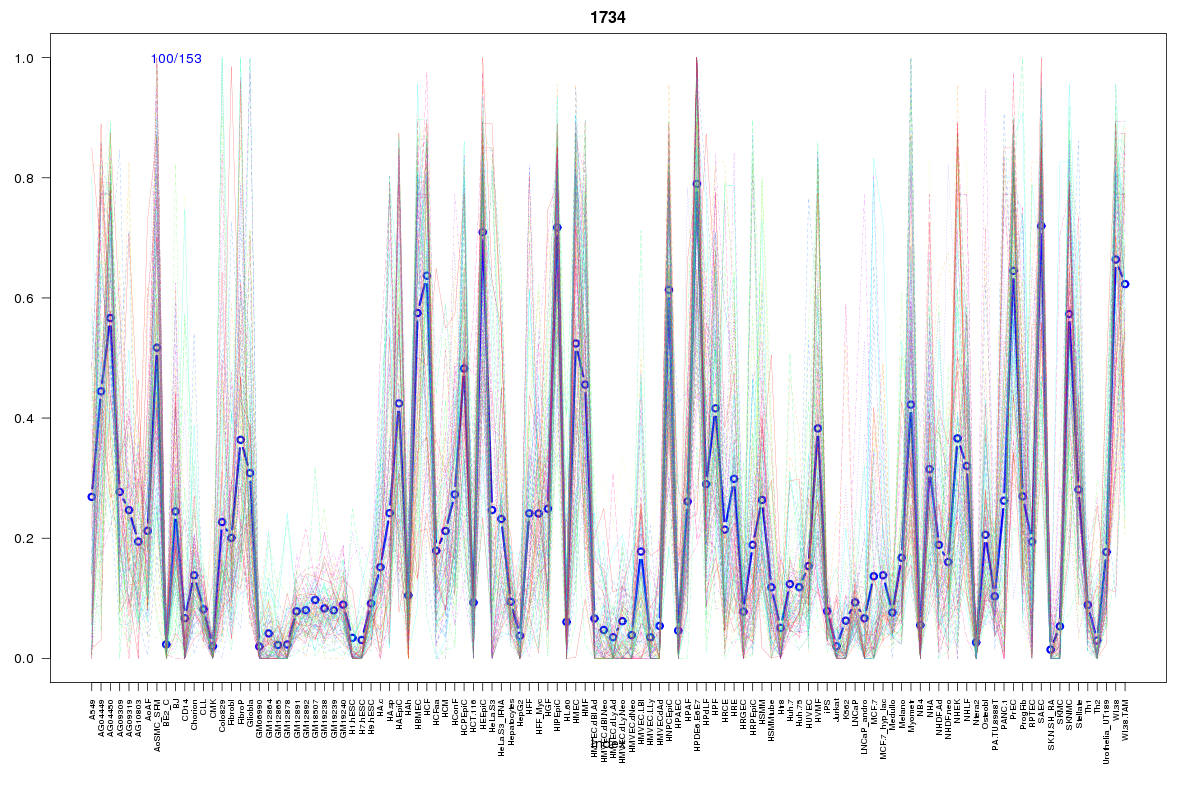 | 1734 | 1 |
 | 2084 | 1 |
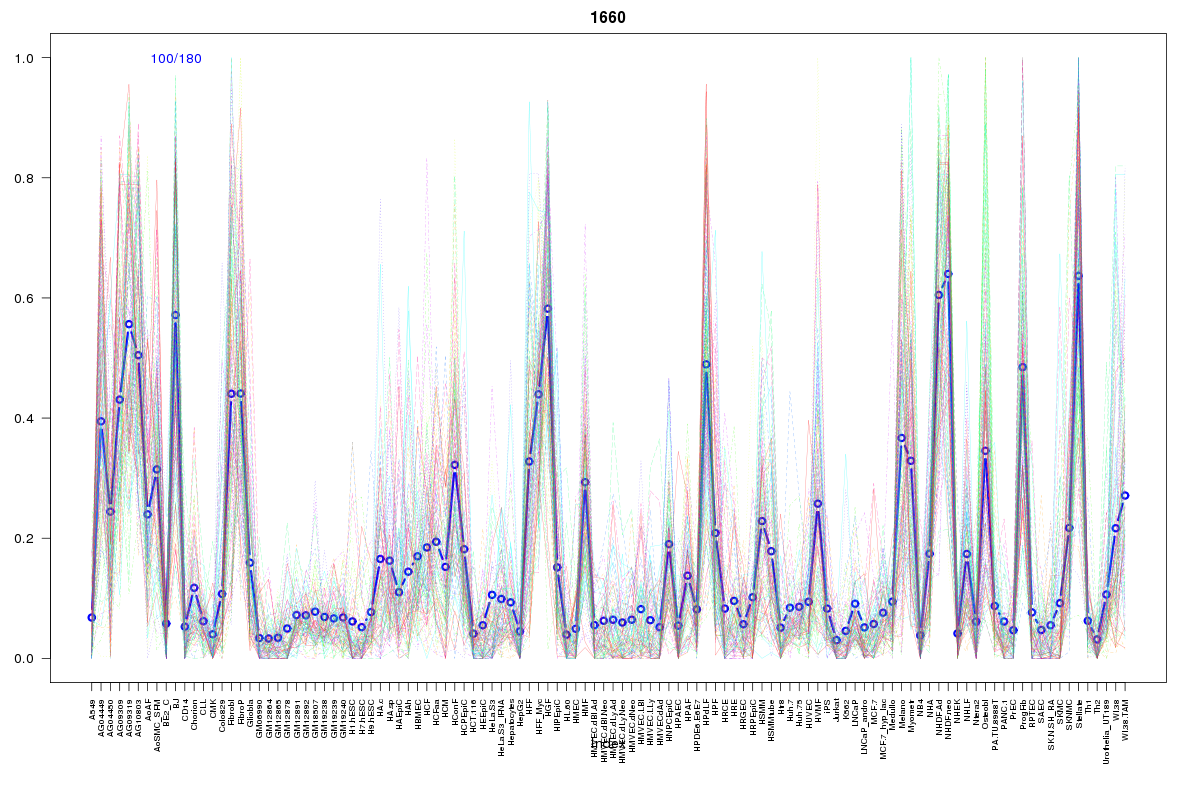 | 1660 | 1 |
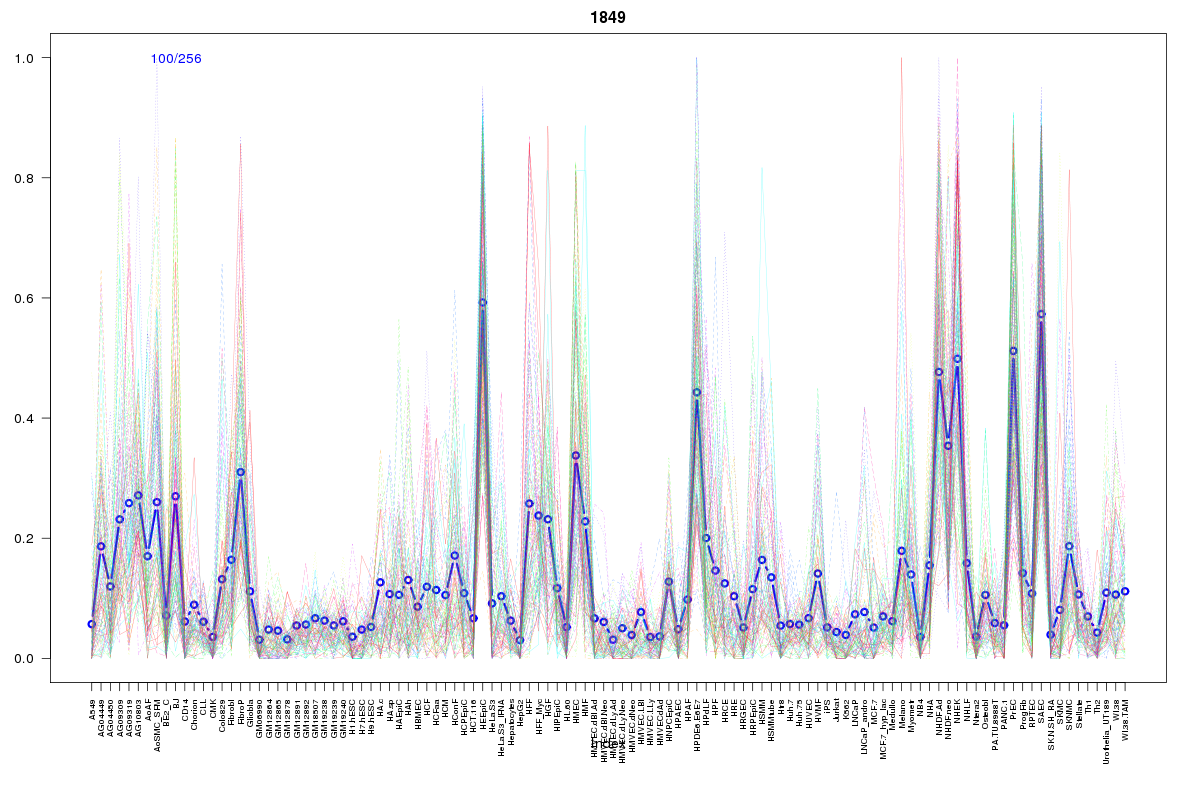 | 1849 | 1 |
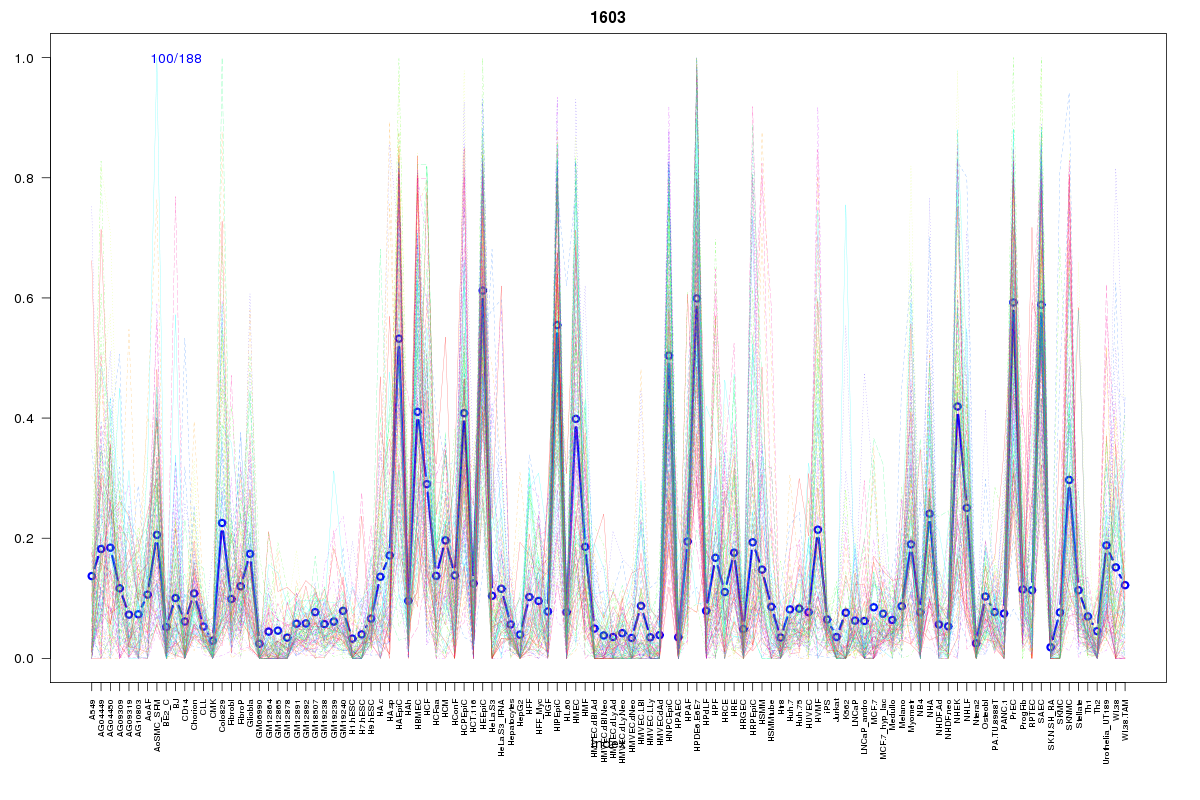 | 1603 | 1 |
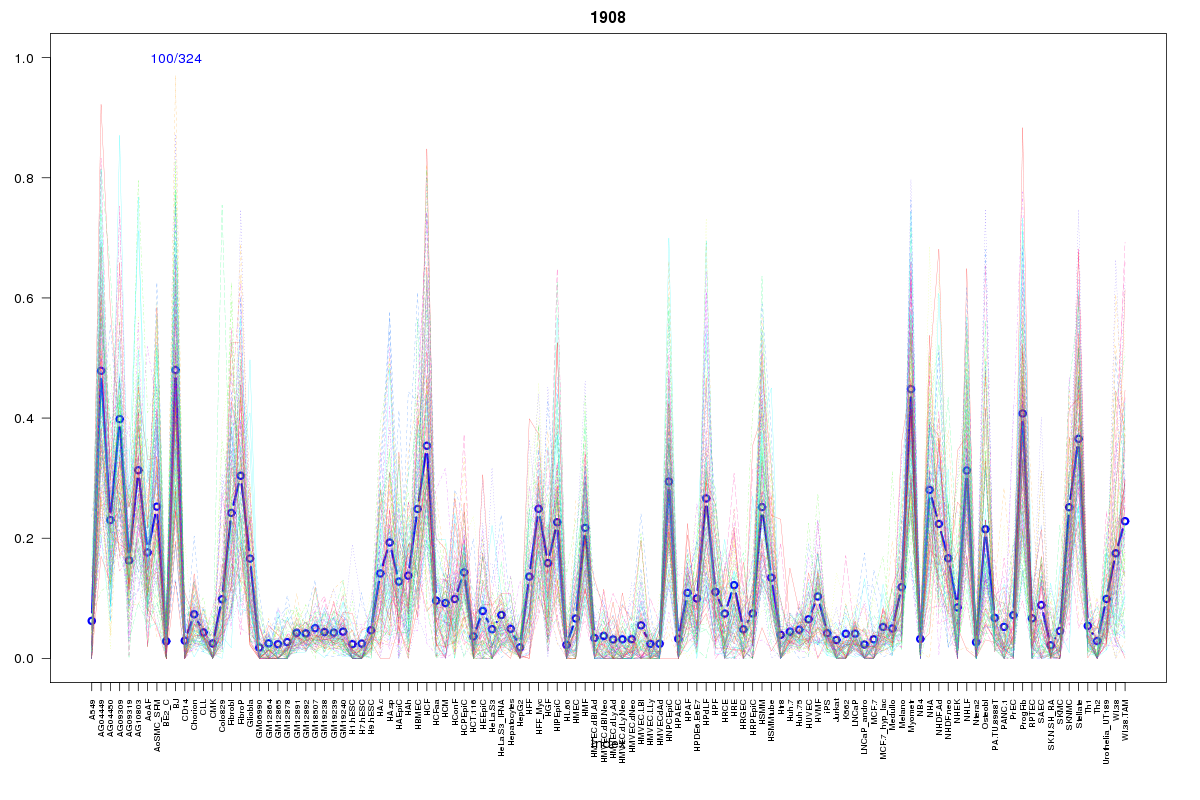 | 1908 | 1 |
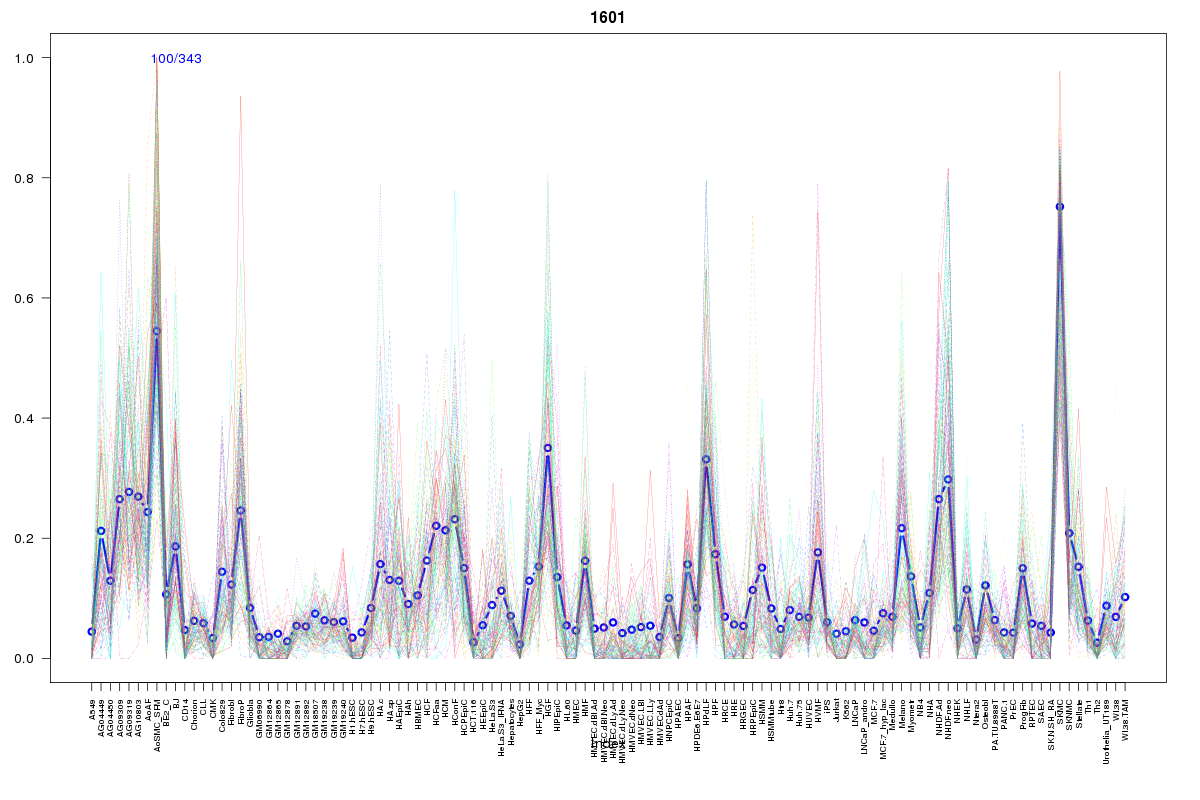 | 1601 | 1 |
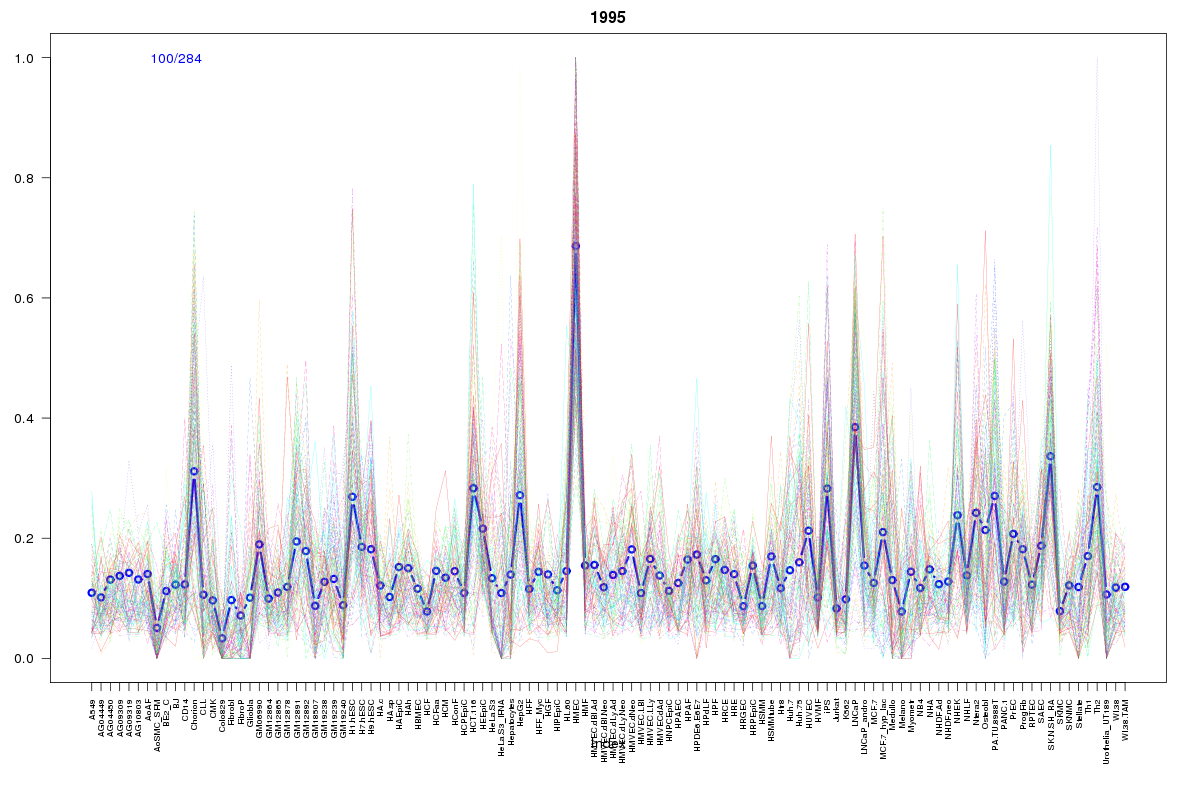 | 1995 | 1 |
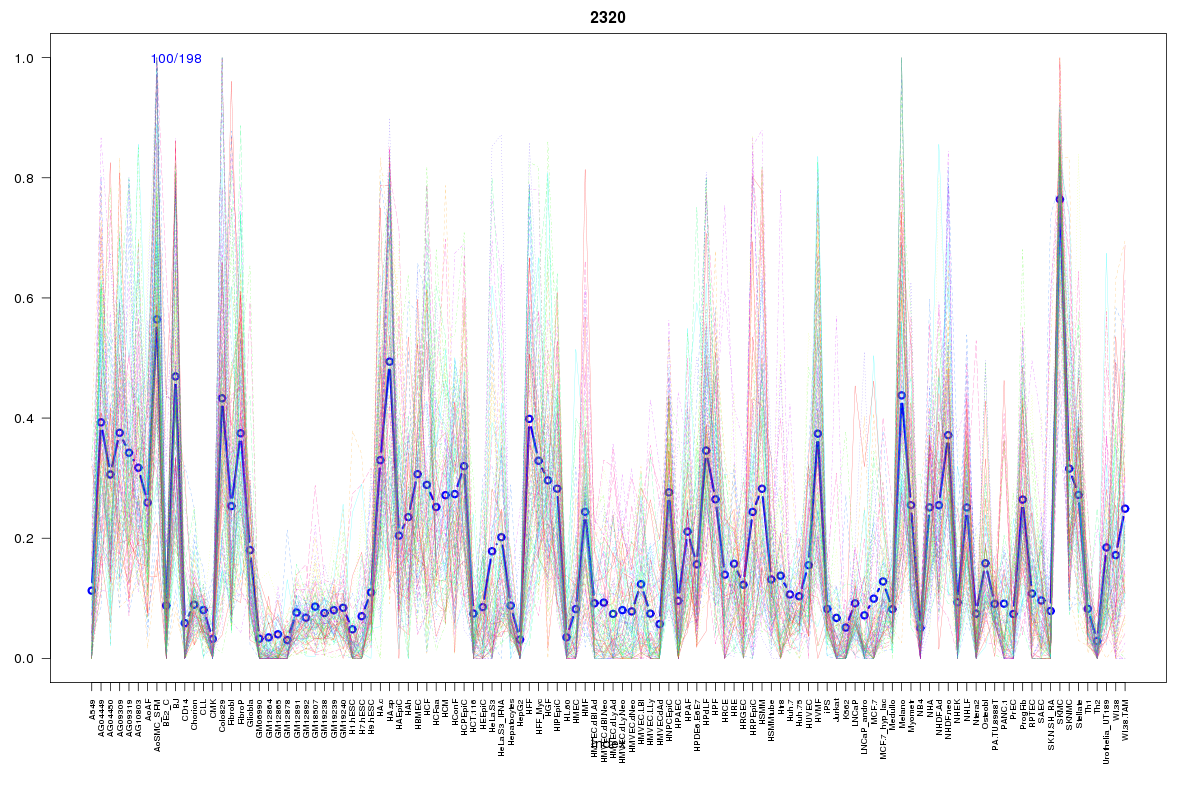 | 2320 | 1 |
Resources
BED file downloads
Connects to 86 DHS sitesTop 10 Correlated DHS Sites
p-values indiciate significant higher or lower correlation| Location | Cluster | P-value |
|---|---|---|
| chr7:42276840-42276990 | 700 | 0 |
| chr7:41995580-41995730 | 600 | 0 |
| chr7:41956325-41956475 | 799 | 0 |
| chr7:42277120-42277270 | 39 | 0 |
| chr7:41956160-41956310 | 799 | 0.001 |
| chr7:42277940-42278090 | 62 | 0.001 |
| chr7:42024640-42024790 | 1633 | 0.001 |
| chr7:41926540-41926690 | 1200 | 0.001 |
| chr7:42278720-42278870 | 996 | 0.001 |
| chr7:42006880-42007030 | 1348 | 0.001 |
| chr7:42137480-42137630 | 2397 | 0.001 |
External Databases
UCSCEnsembl (ENSG00000106571)