Gene: SIPA1L3
chr19: 38397867-38699012Expression Profile
(log scale)
Graphical Connections
Distribution of linked clusters:
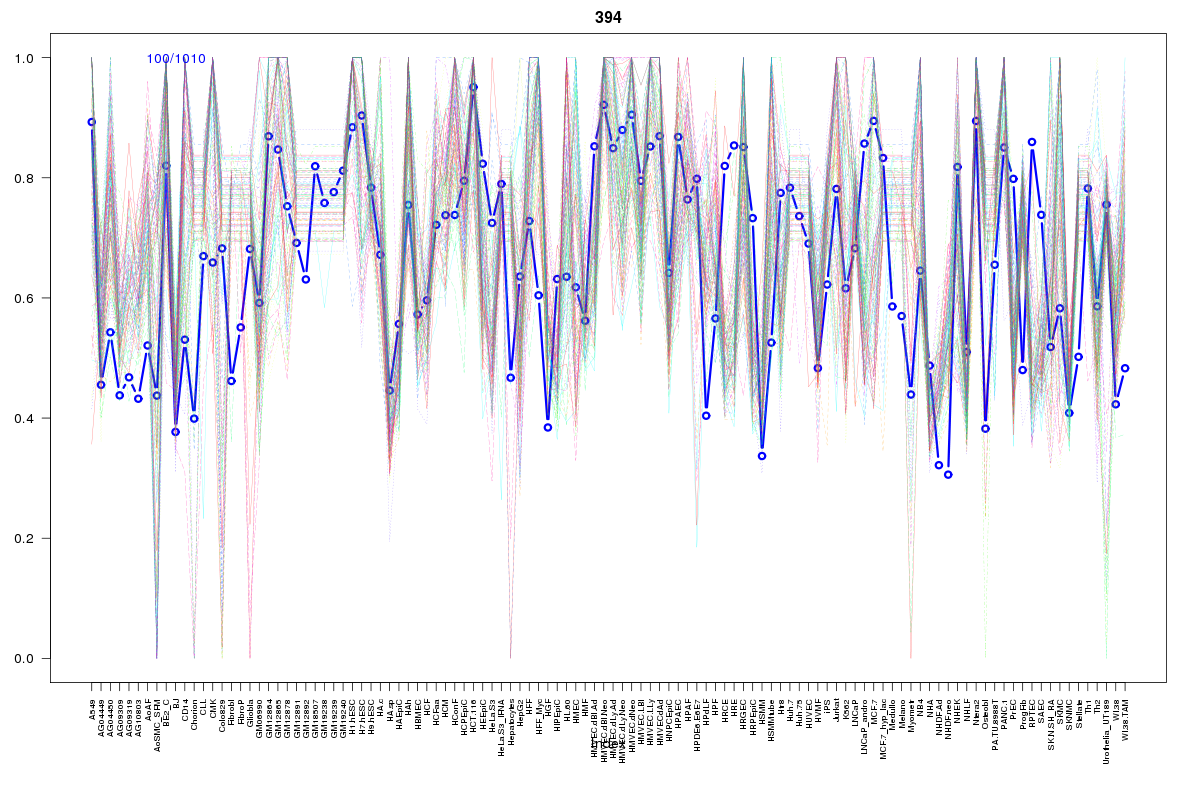
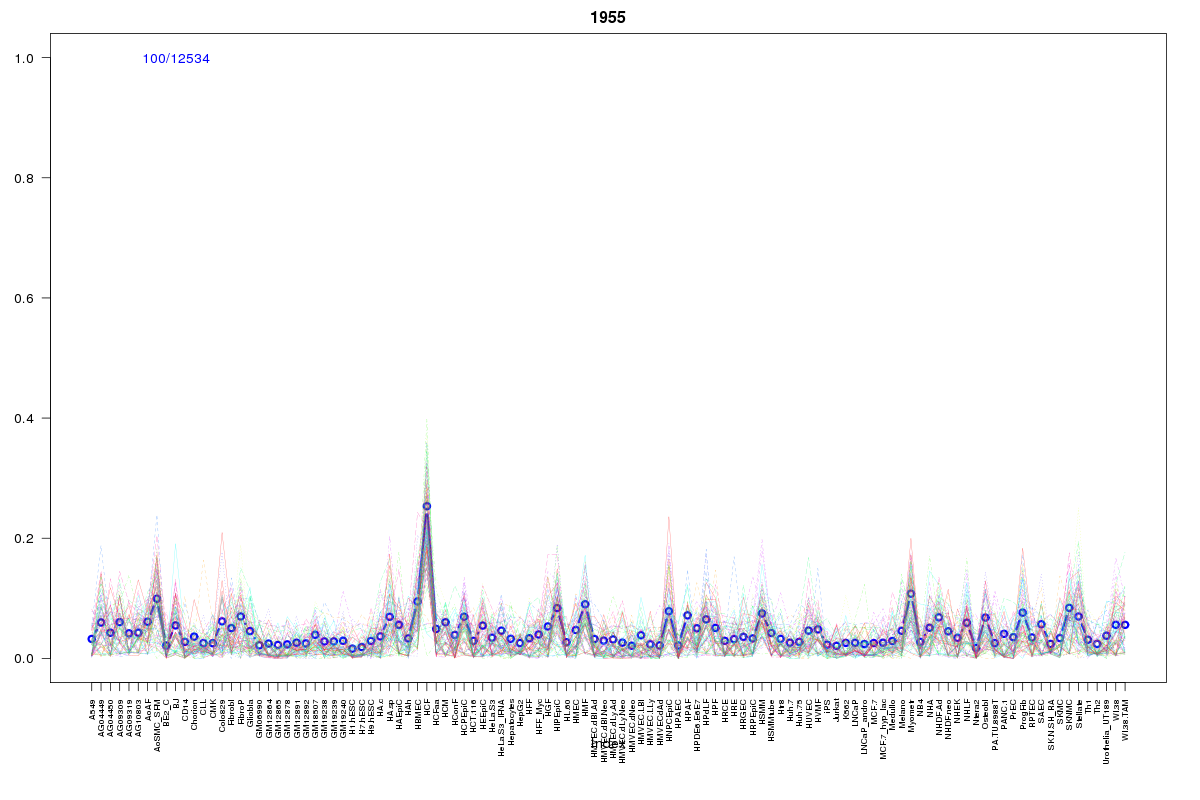
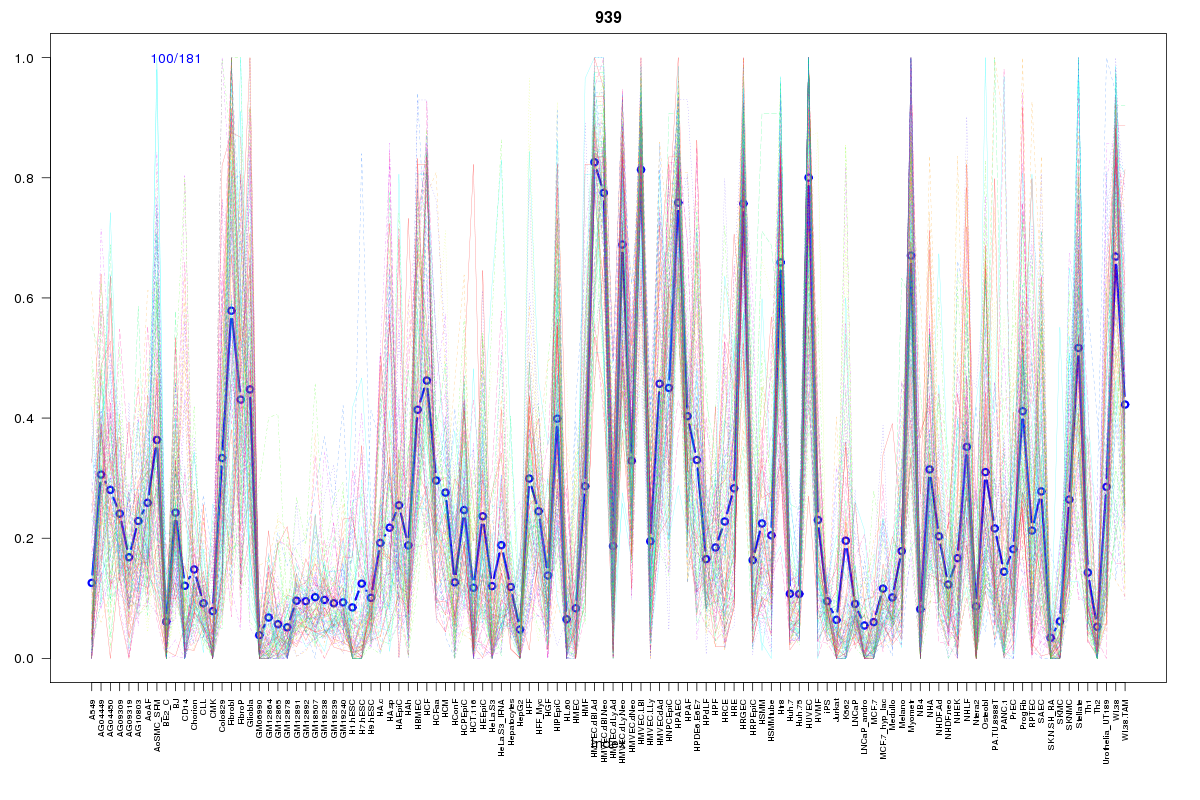
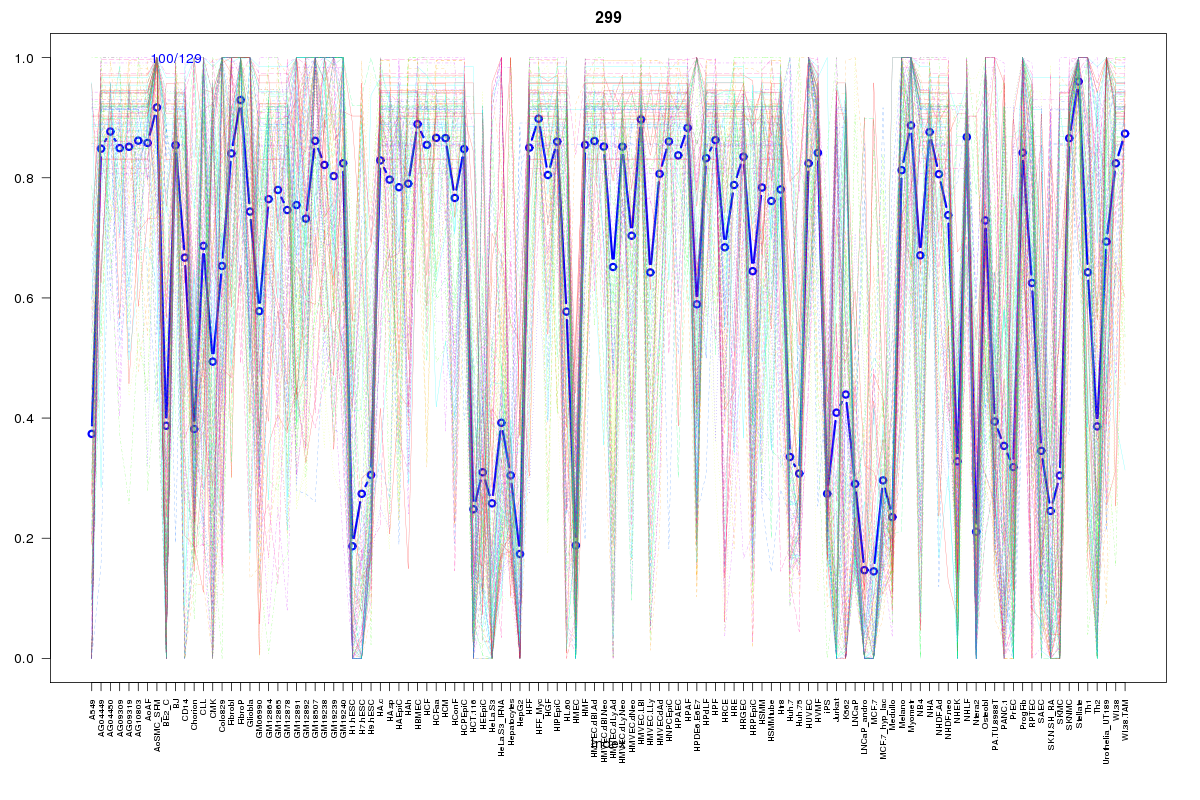
You may find it interesting if many of the connected DHS sites belong to the same cluster.| Cluster Profile | Cluster ID | Number of DHS sites in this cluster |
|---|---|---|
 | 881 | 28 |
 | 2175 | 15 |
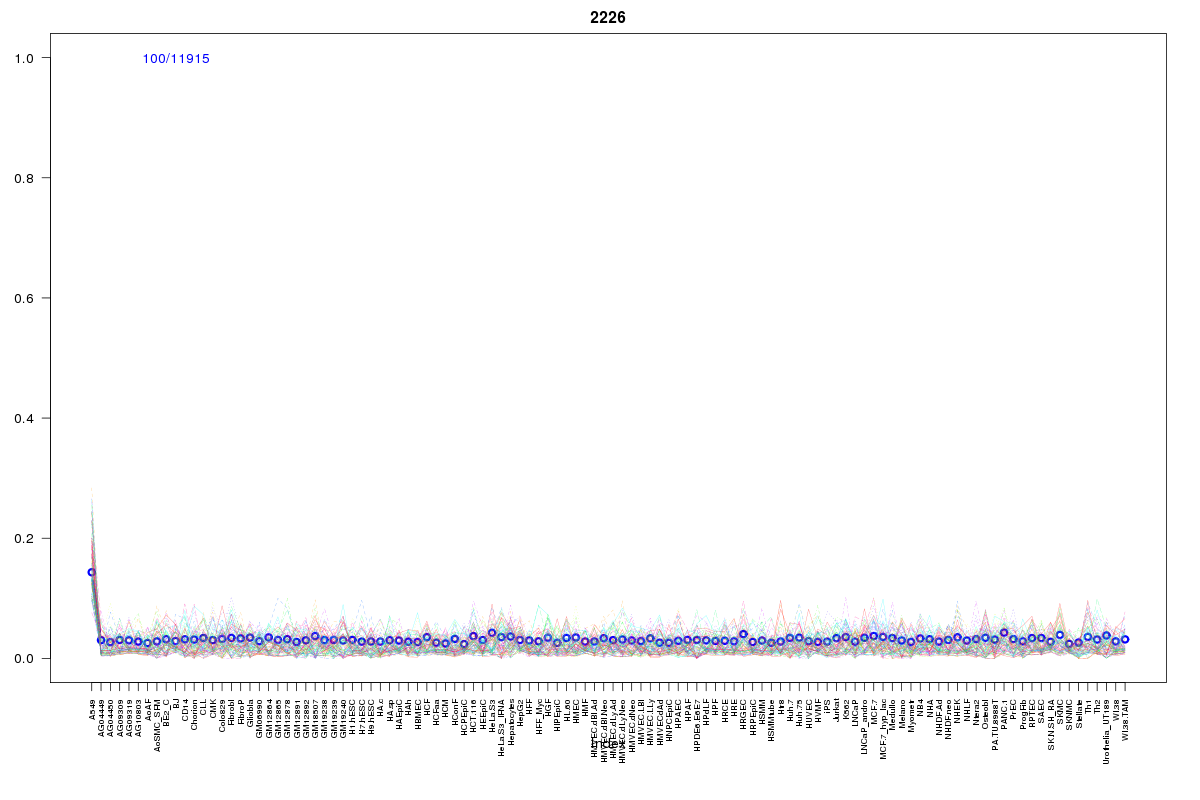 | 2226 | 12 |
 | 416 | 9 |
 | 2279 | 8 |
 | 862 | 7 |
 | 860 | 5 |
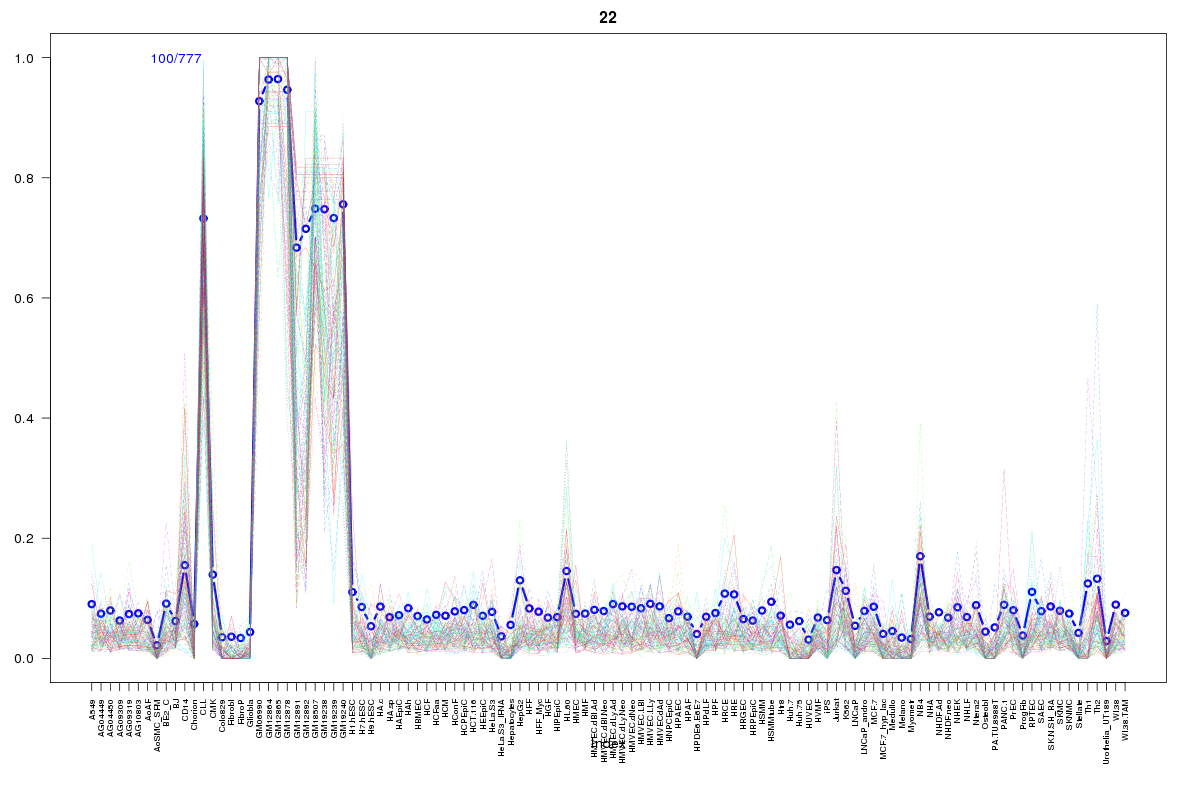 | 22 | 4 |
 | 655 | 4 |
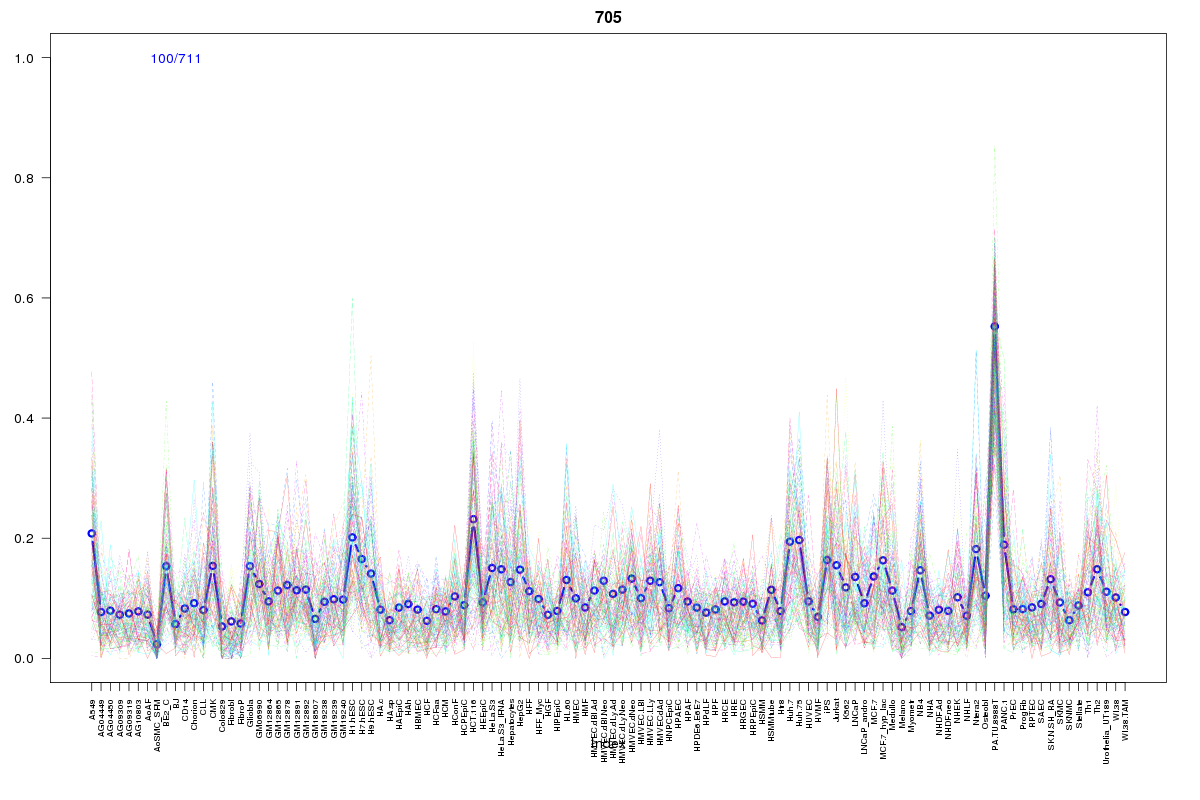 | 705 | 3 |
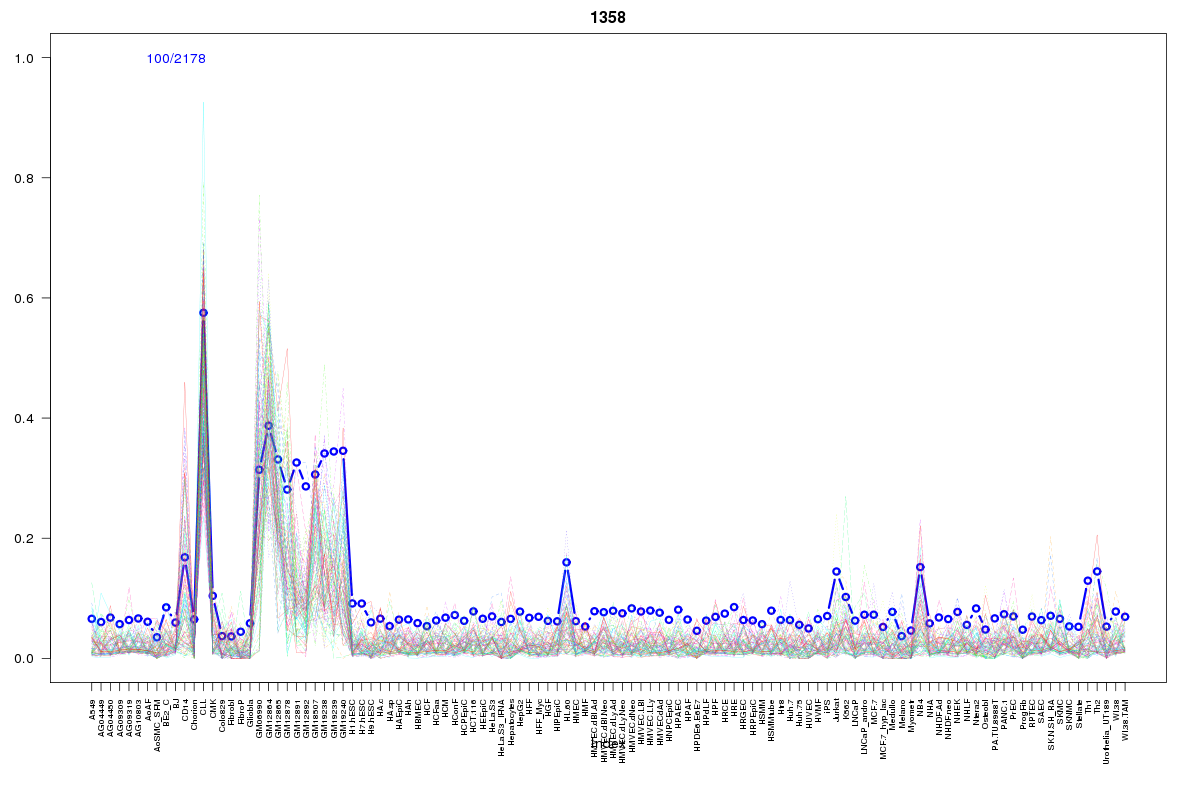 | 1358 | 3 |
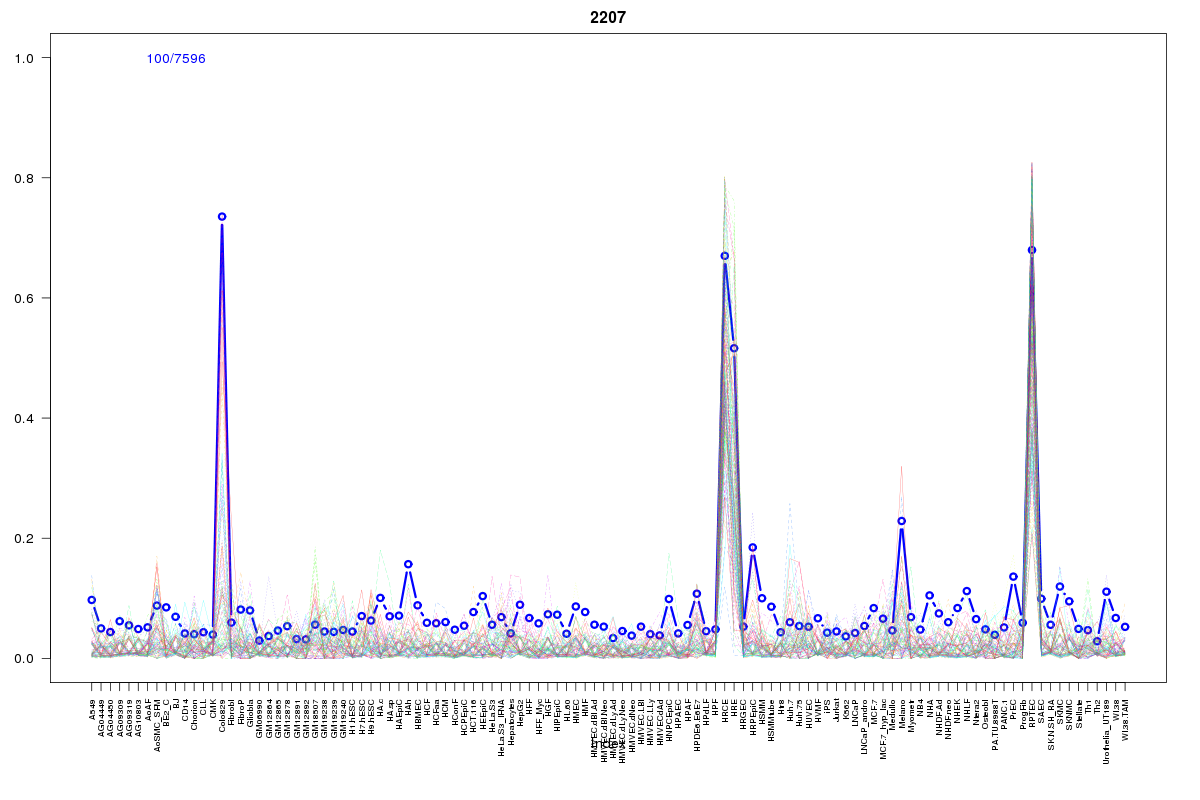 | 2207 | 3 |
 | 2055 | 3 |
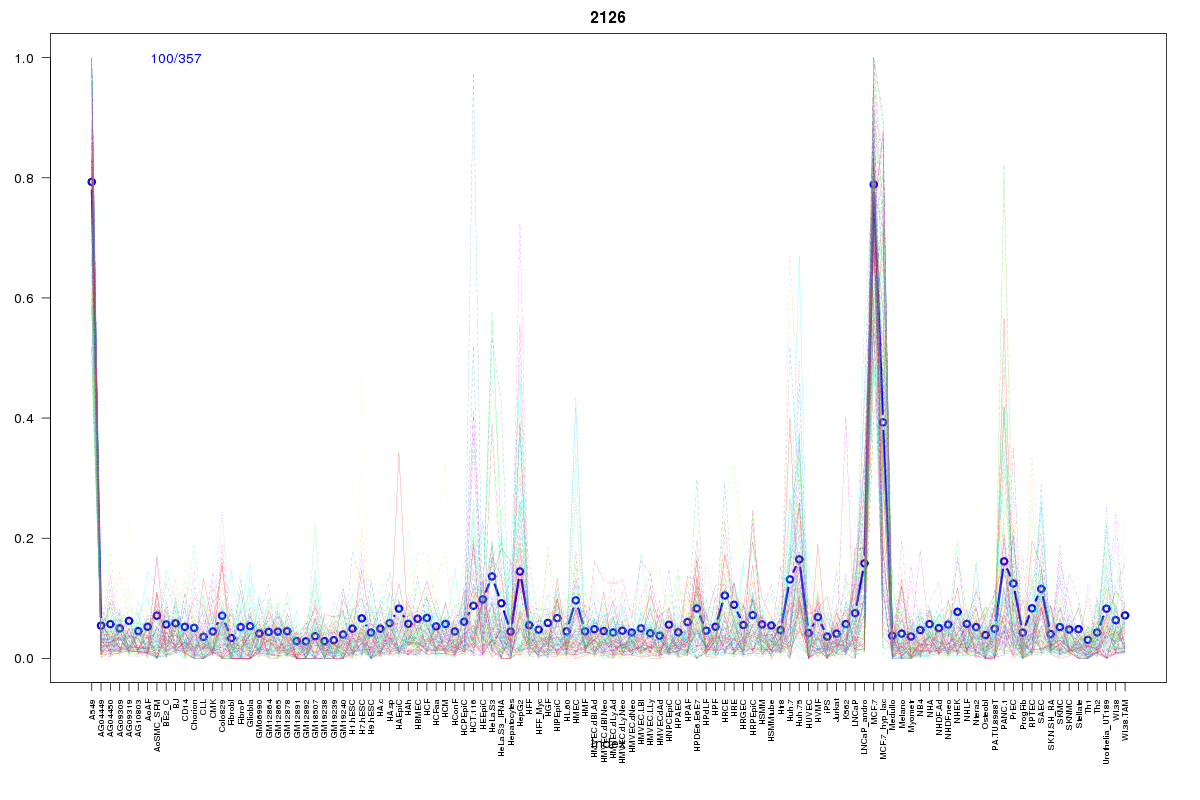 | 2126 | 2 |
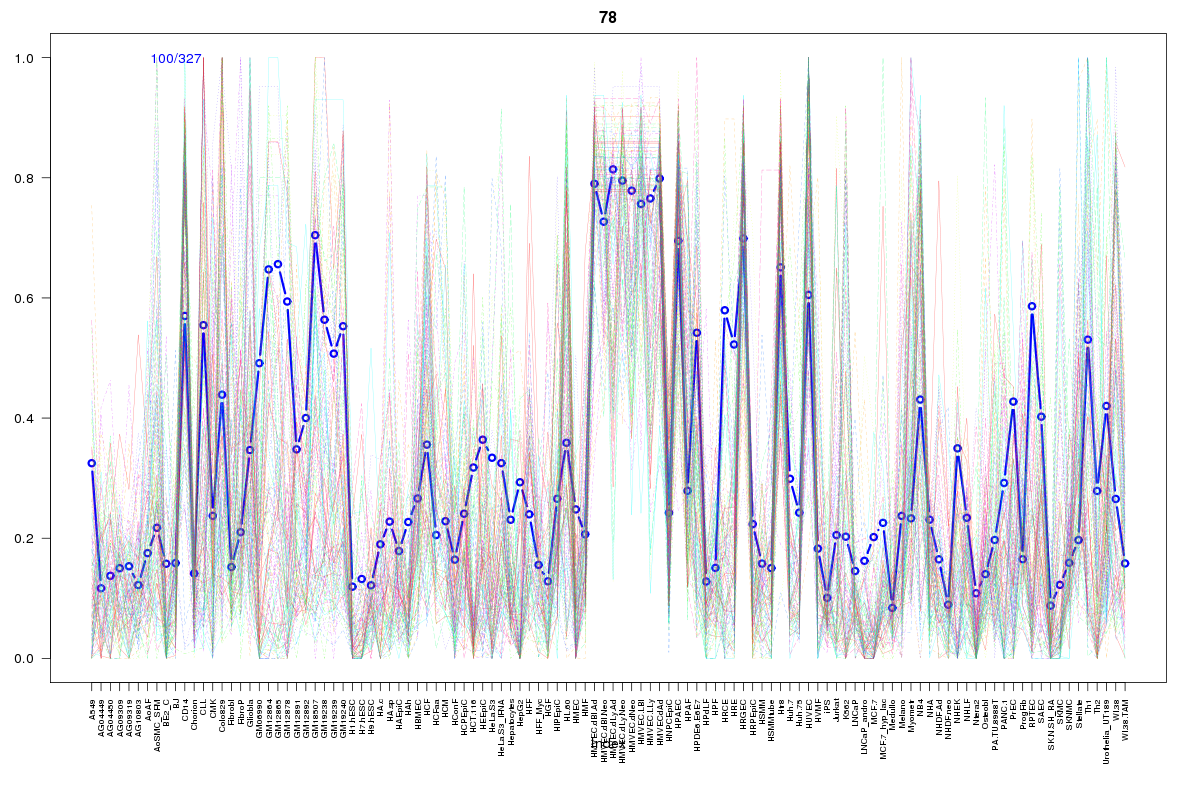 | 78 | 2 |
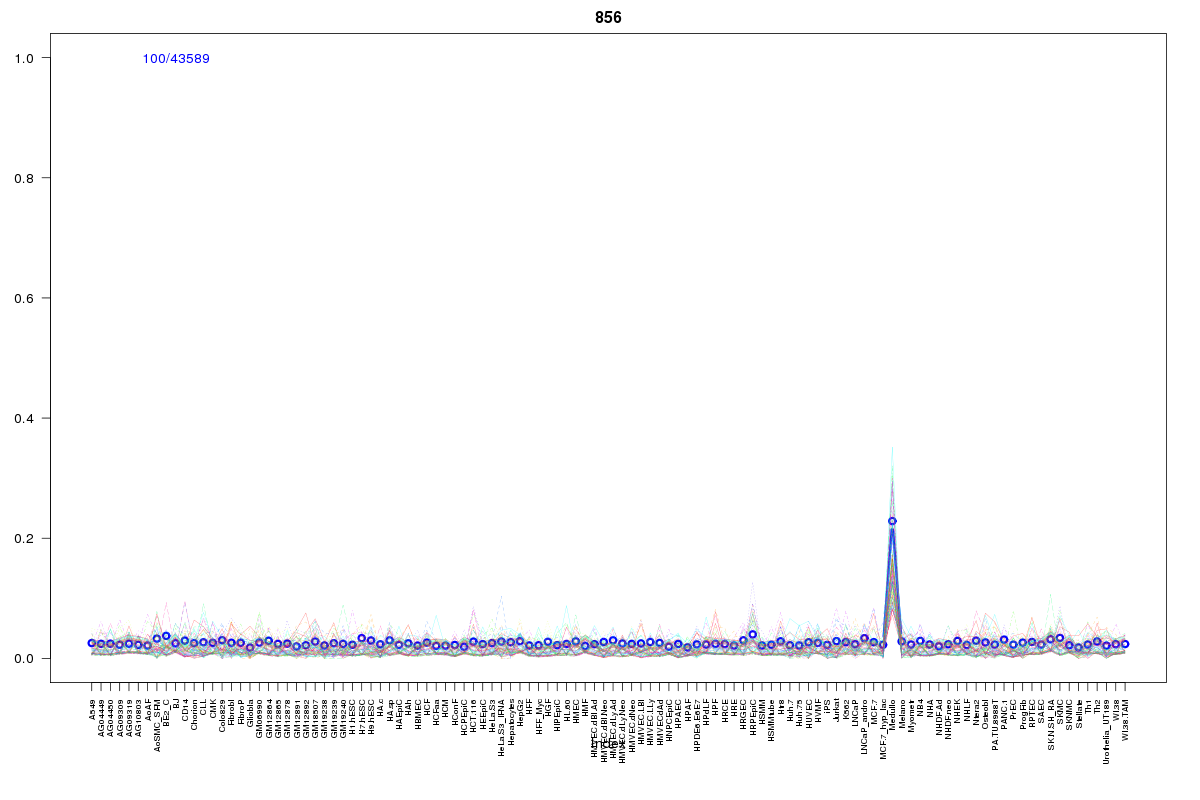 | 856 | 2 |
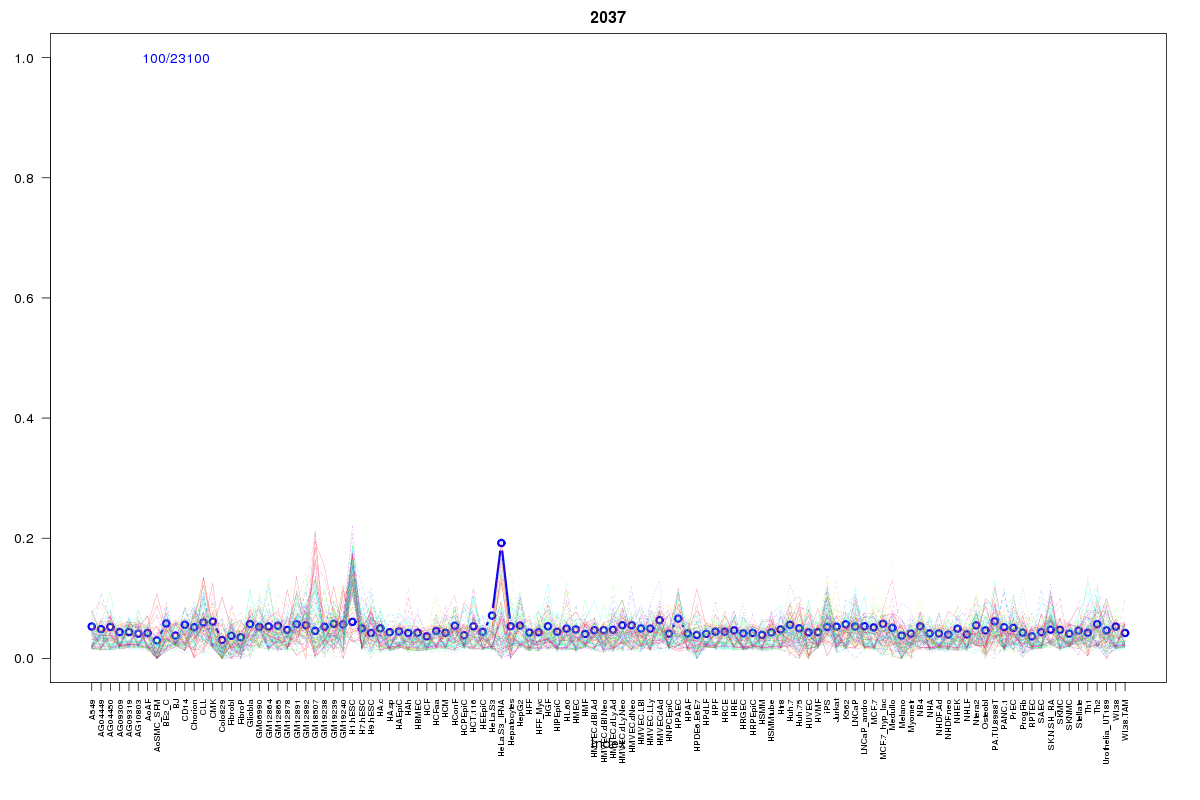 | 2037 | 2 |
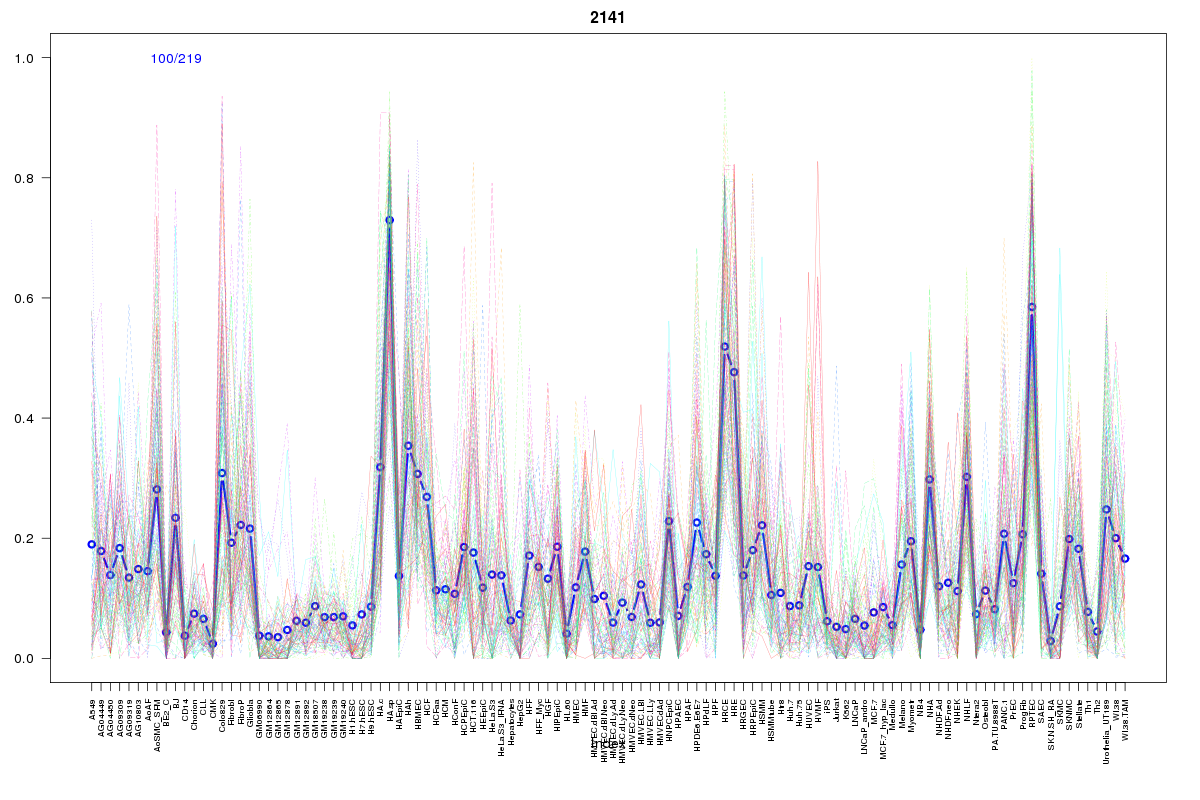 | 2141 | 2 |
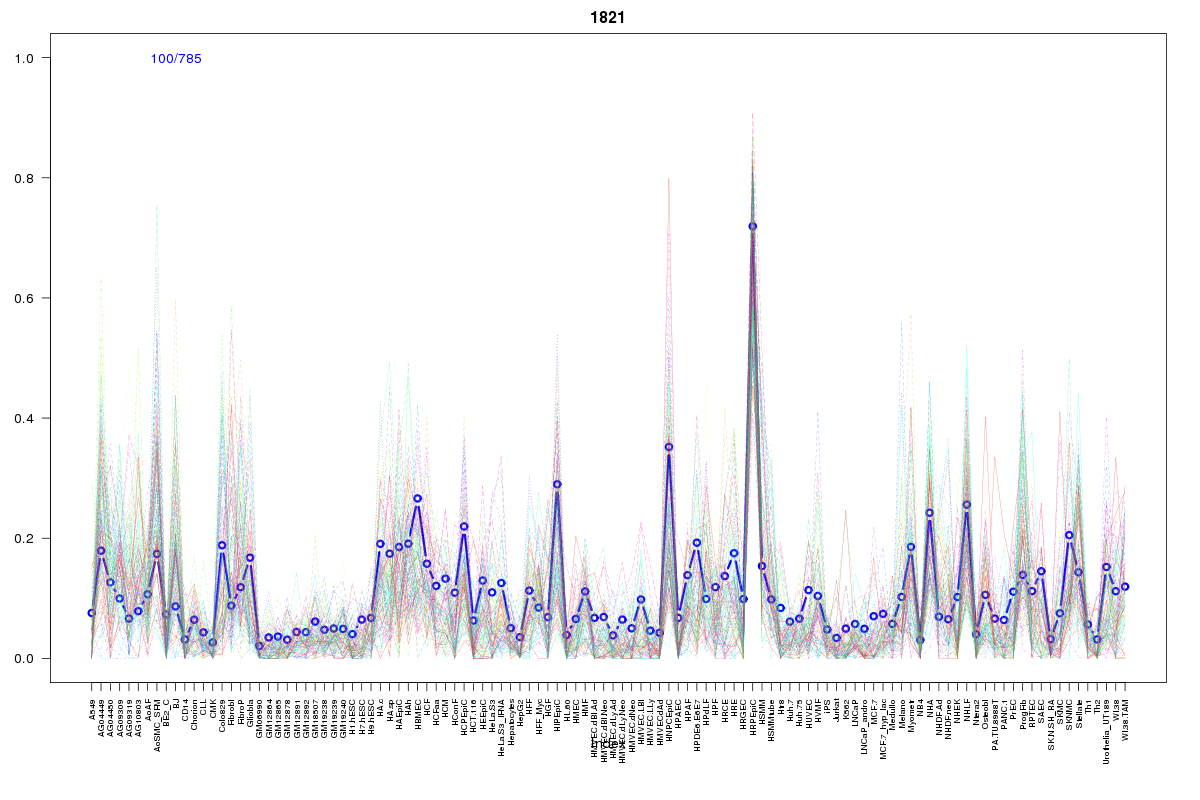 | 1821 | 2 |
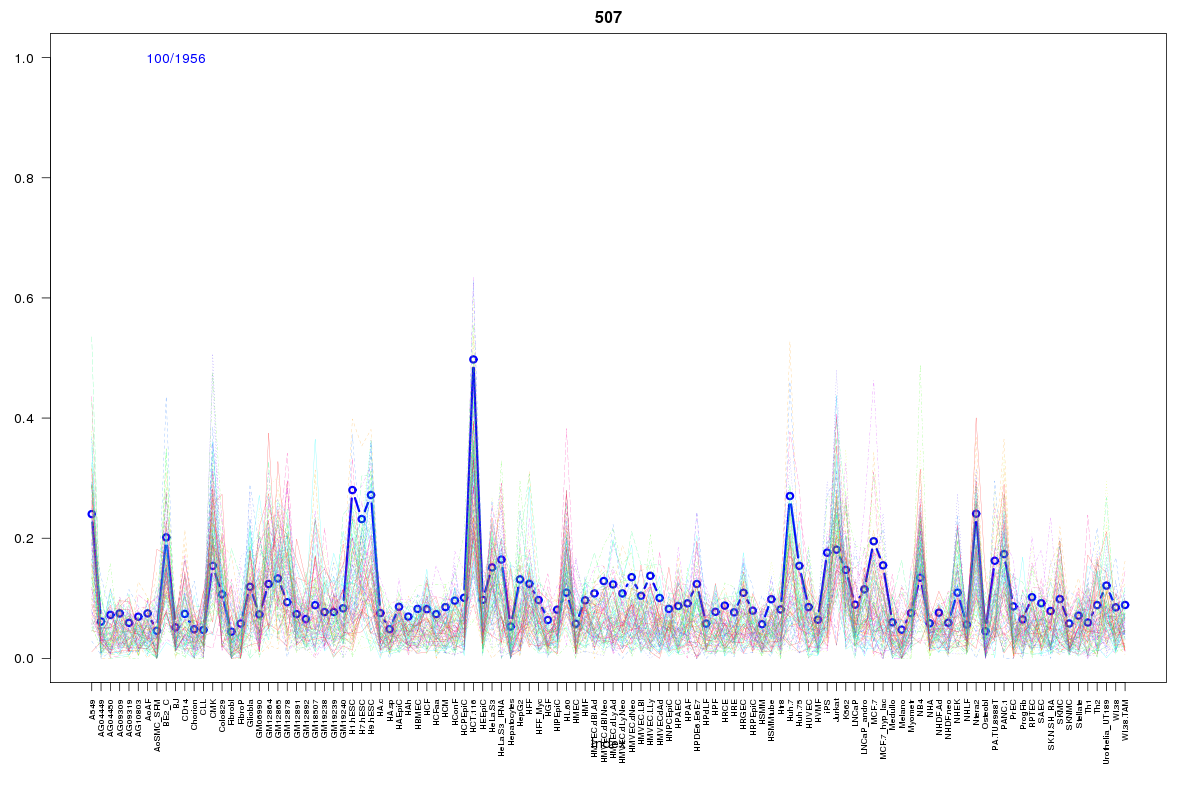 | 507 | 2 |
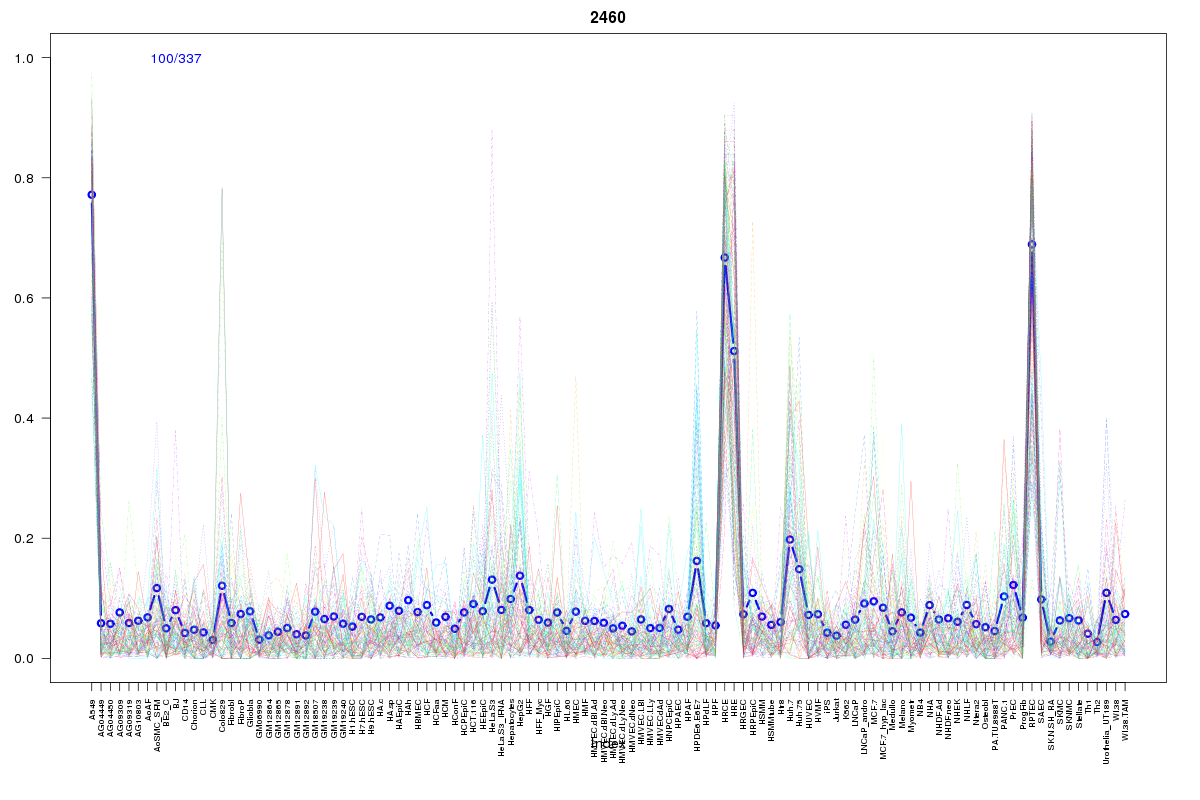 | 2460 | 2 |
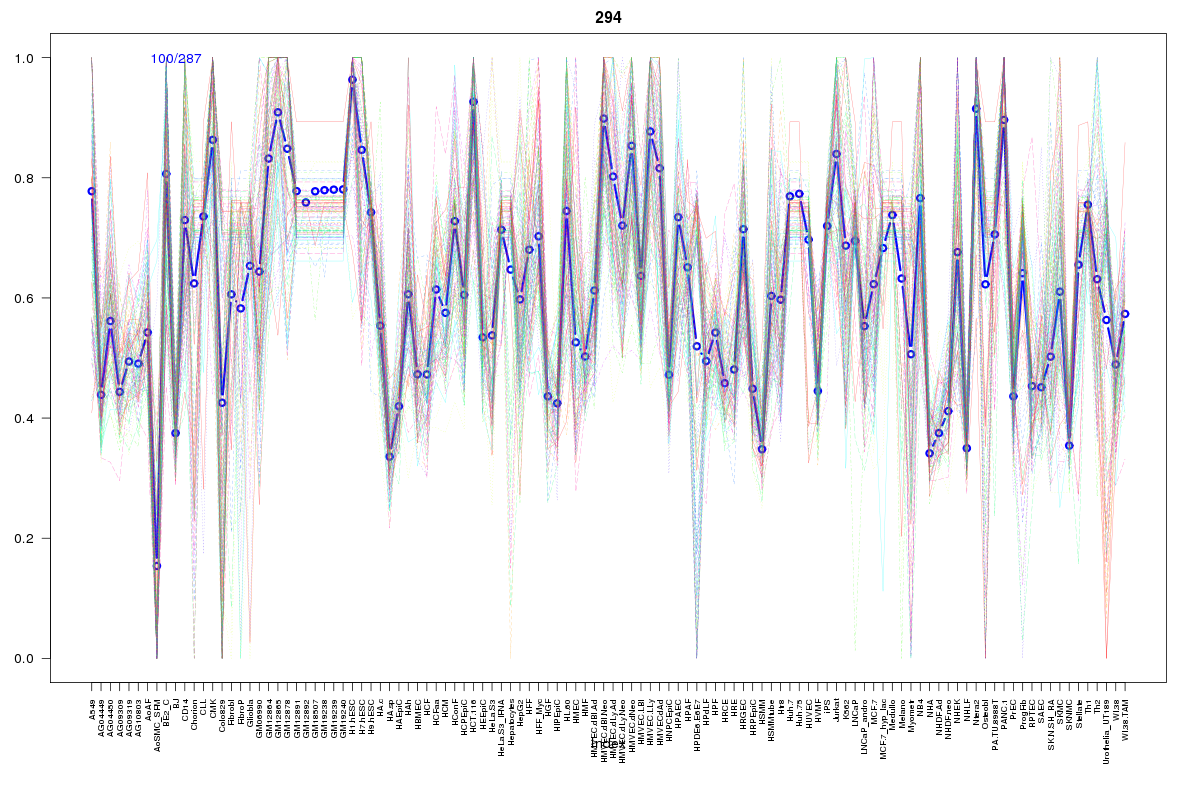 | 294 | 2 |
 | 1016 | 2 |
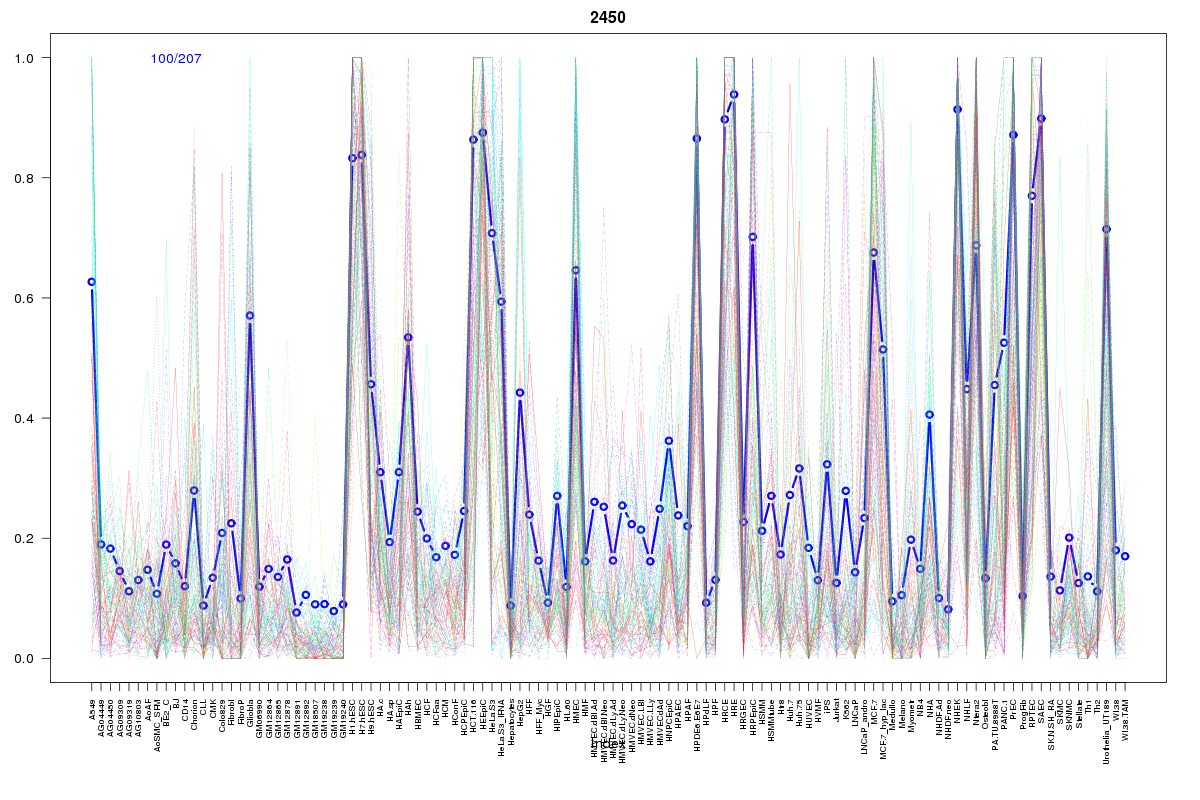 | 2450 | 2 |
 | 994 | 2 |
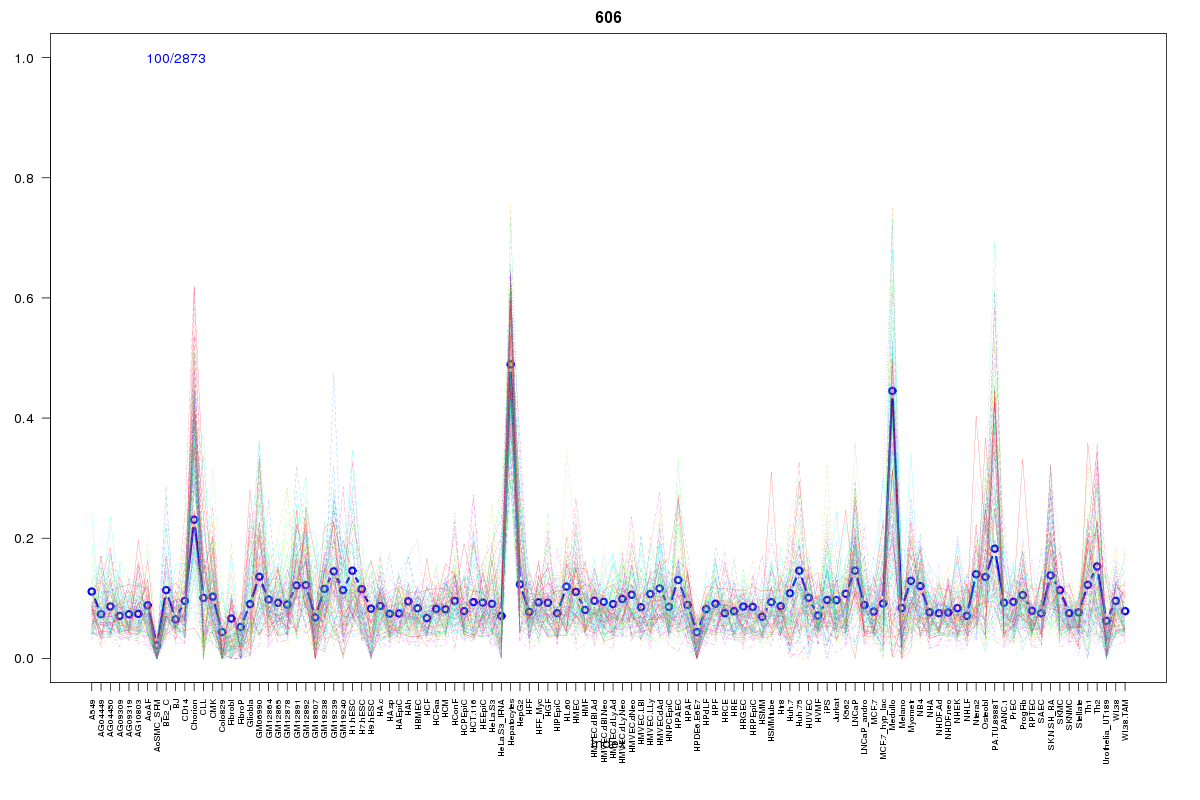 | 606 | 2 |
 | 979 | 2 |
 | 103 | 2 |
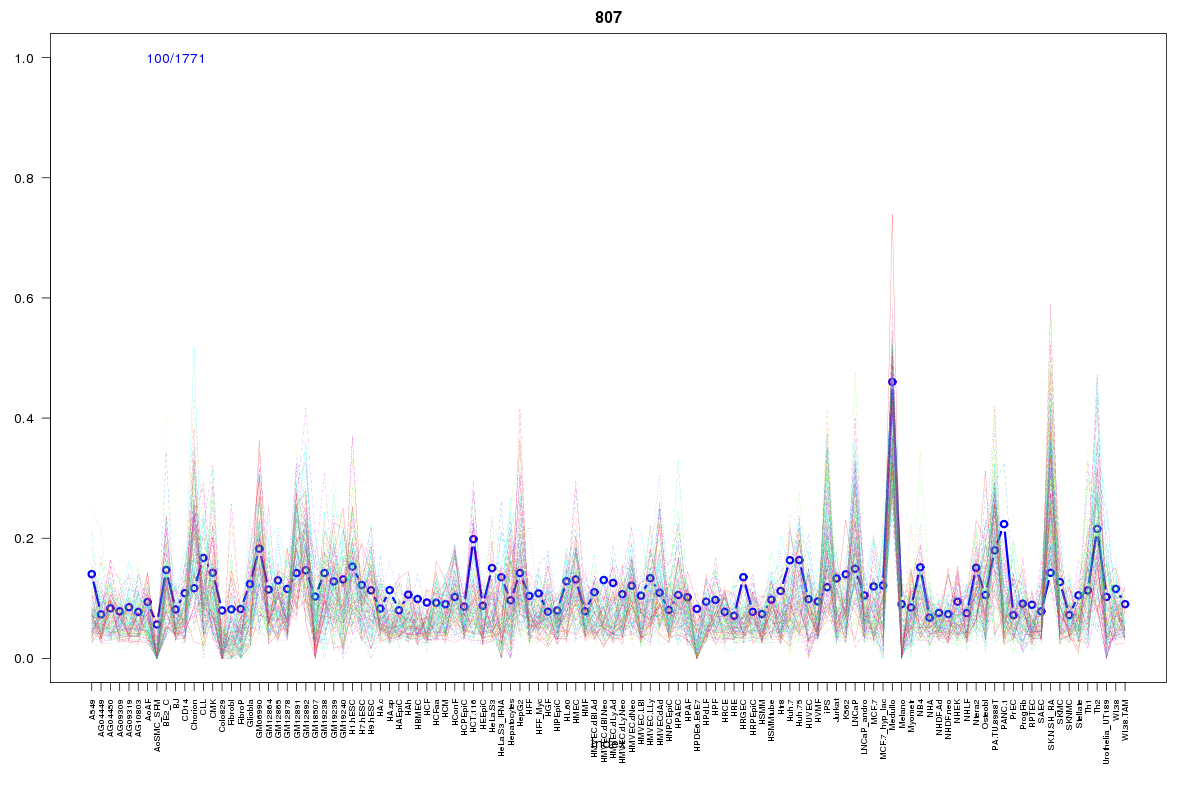 | 807 | 1 |
 | 608 | 1 |
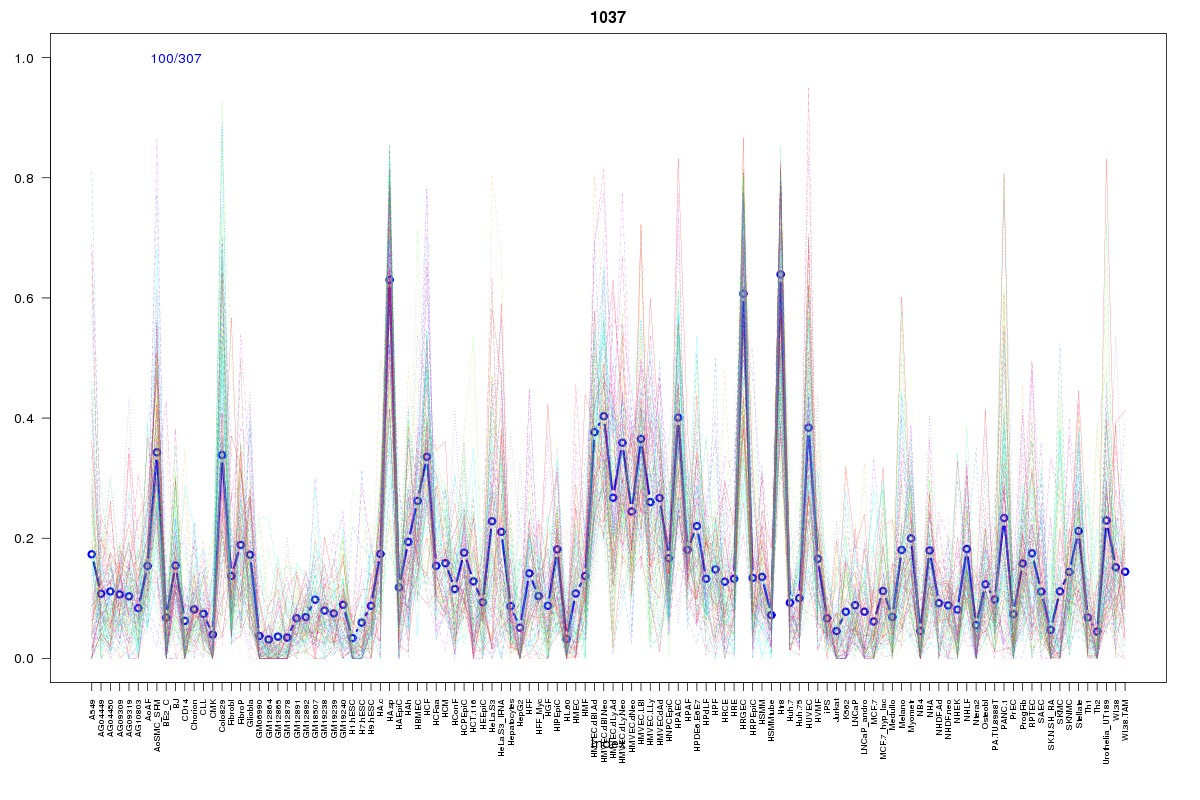 | 1037 | 1 |
 | 775 | 1 |
 | 1079 | 1 |
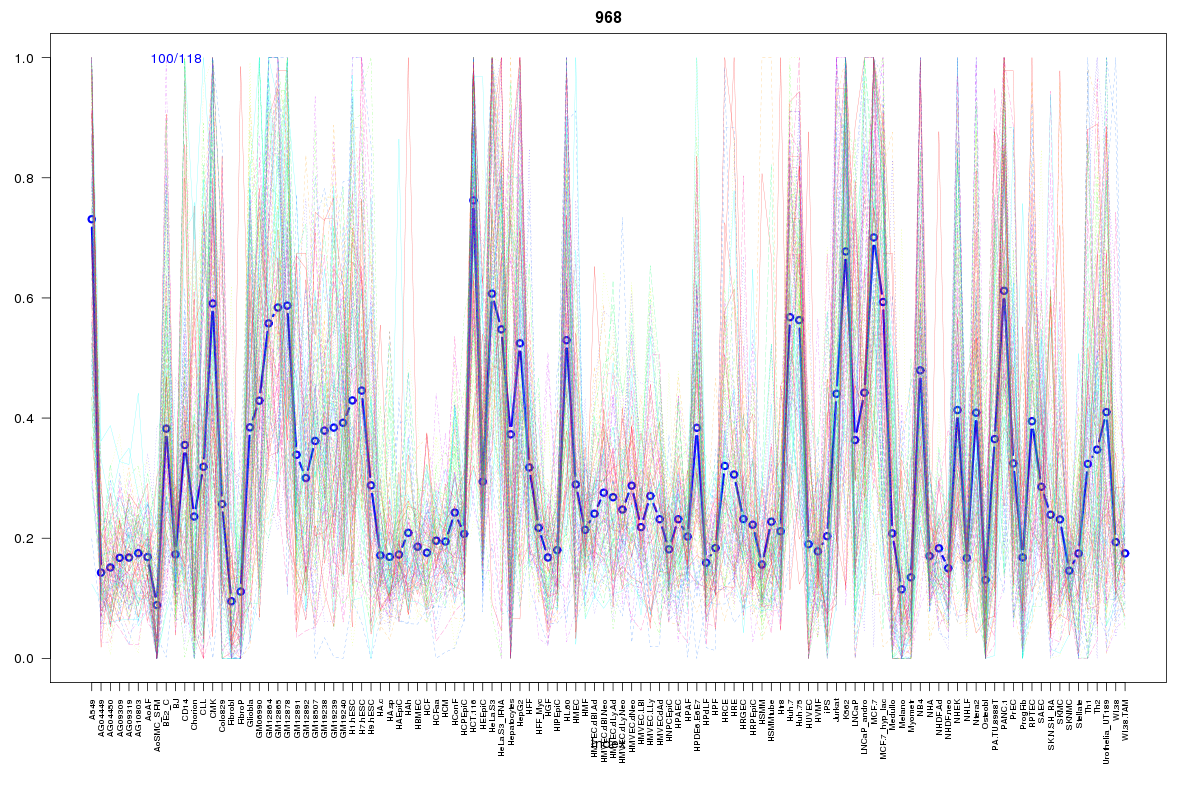 | 968 | 1 |
 | 569 | 1 |
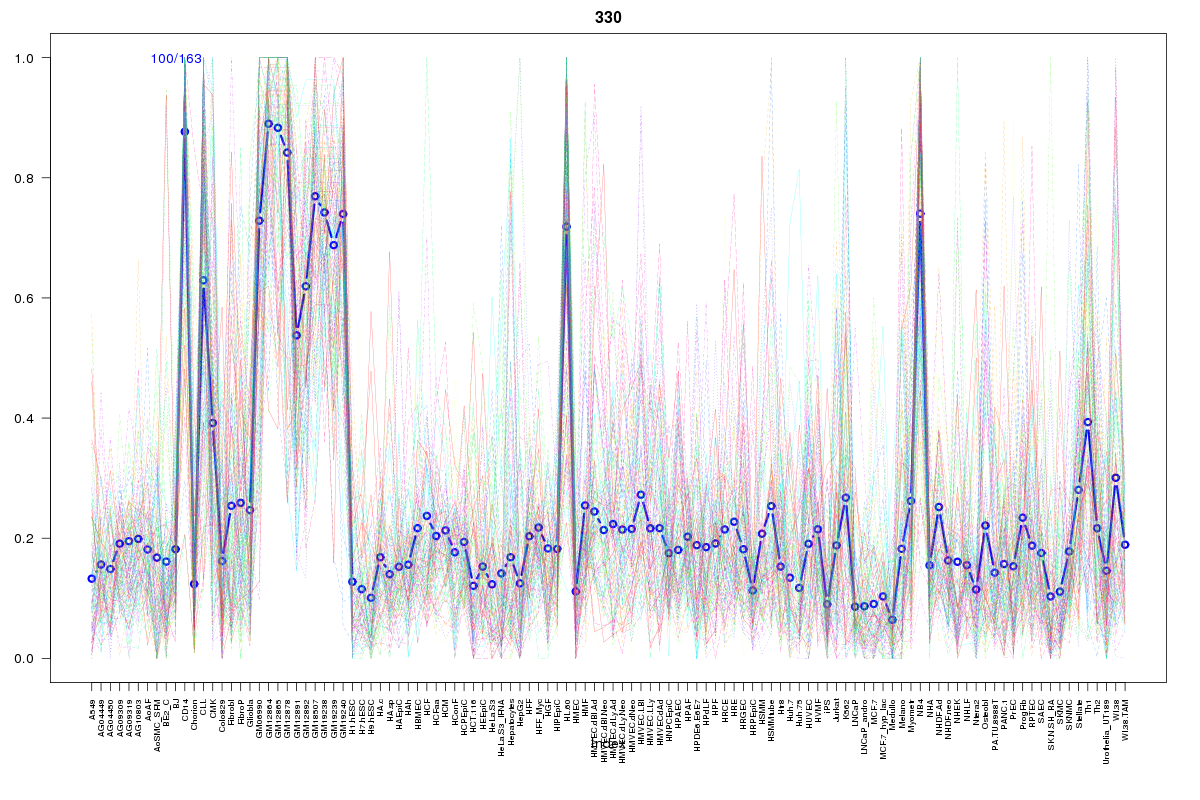 | 330 | 1 |
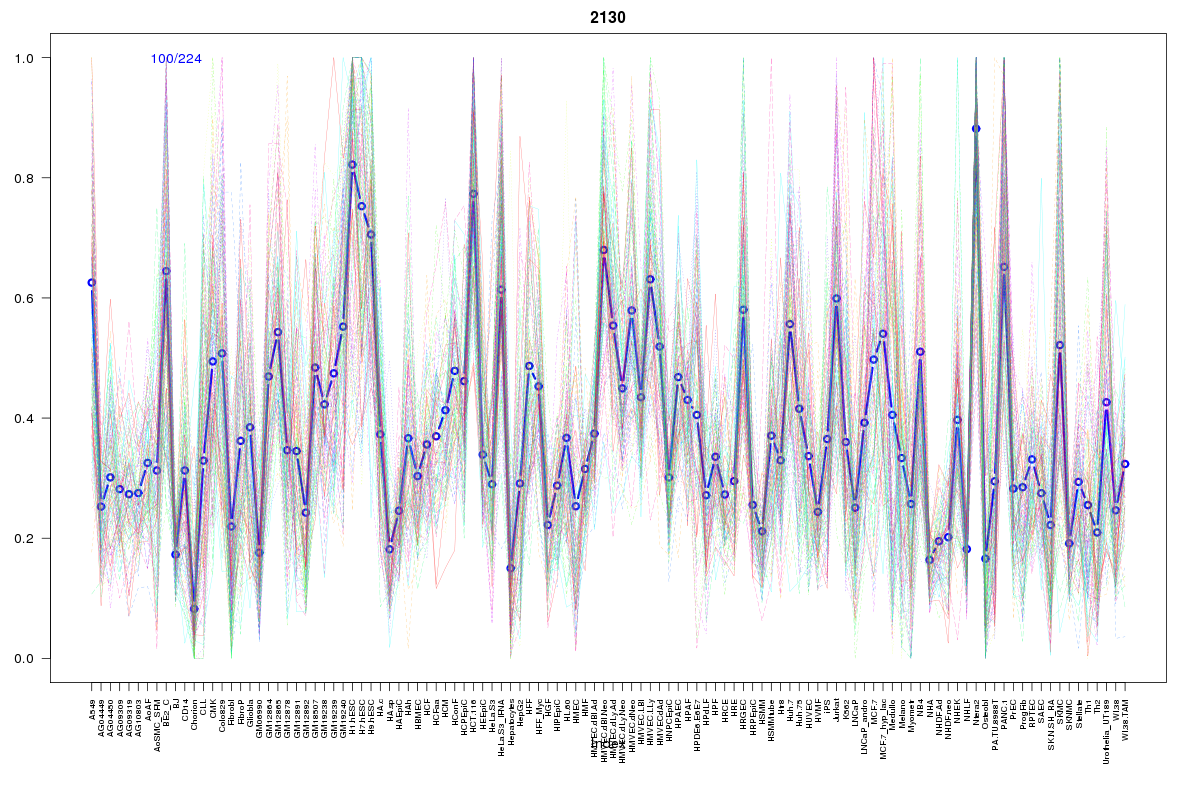 | 2130 | 1 |
 | 1974 | 1 |
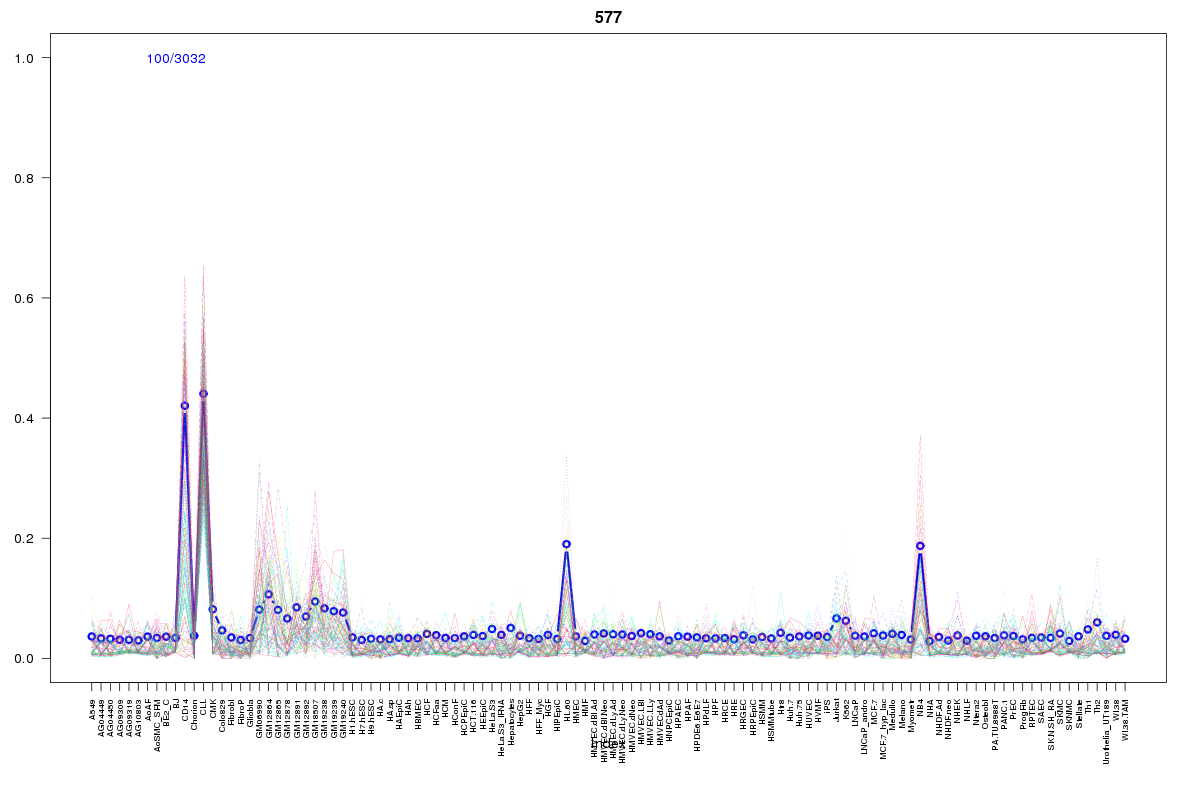 | 577 | 1 |
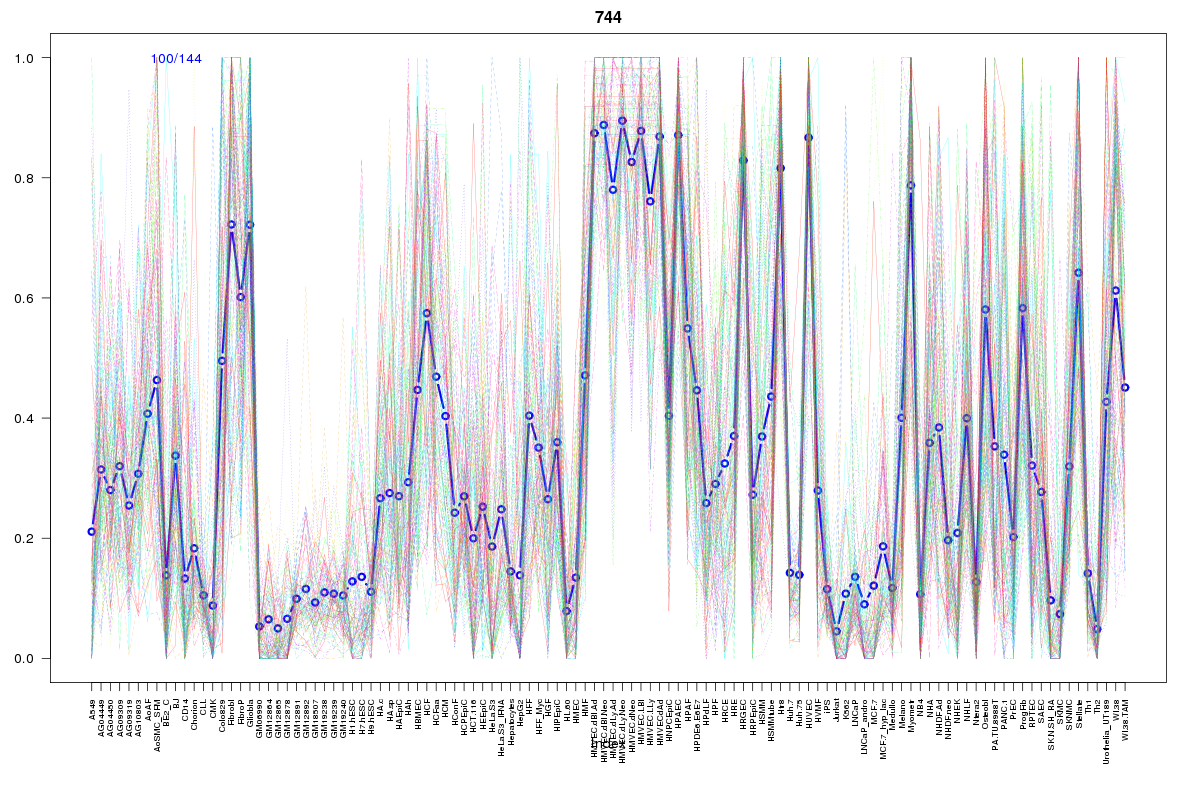 | 744 | 1 |
 | 15 | 1 |
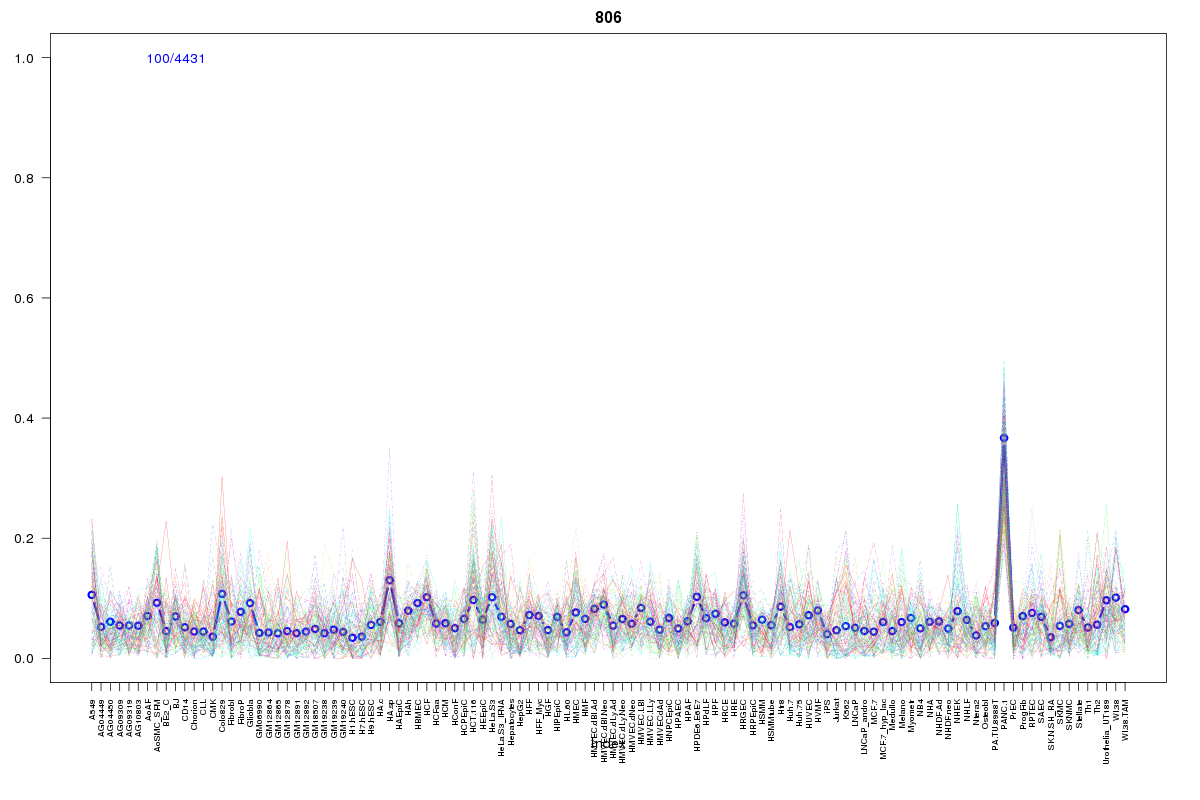 | 806 | 1 |
 | 882 | 1 |
 | 1095 | 1 |
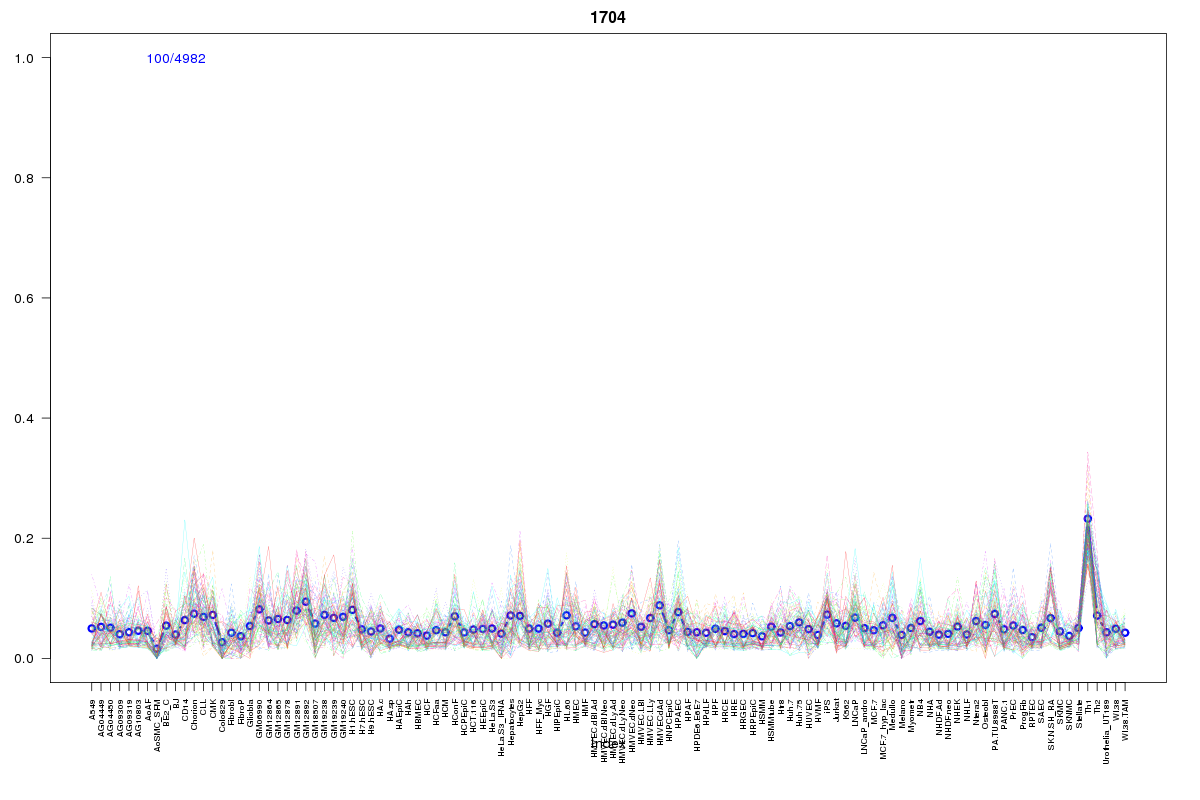 | 1704 | 1 |
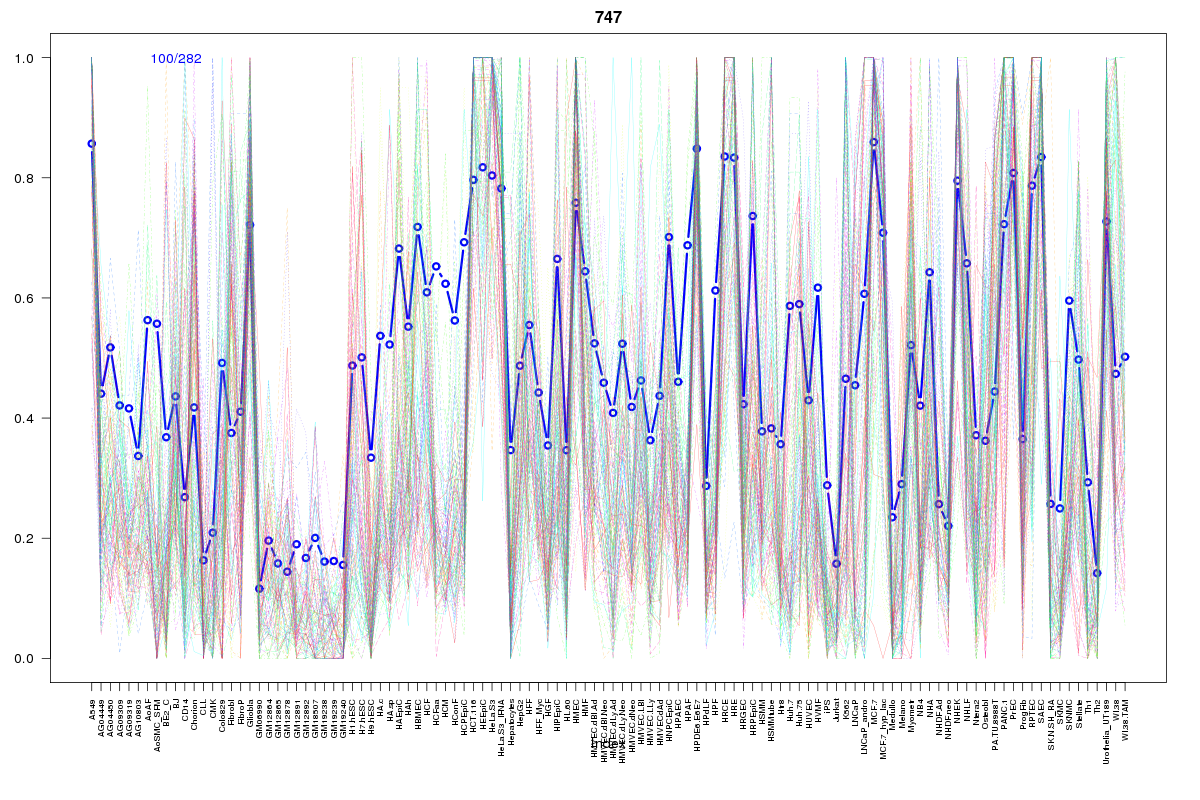 | 747 | 1 |
 | 2211 | 1 |
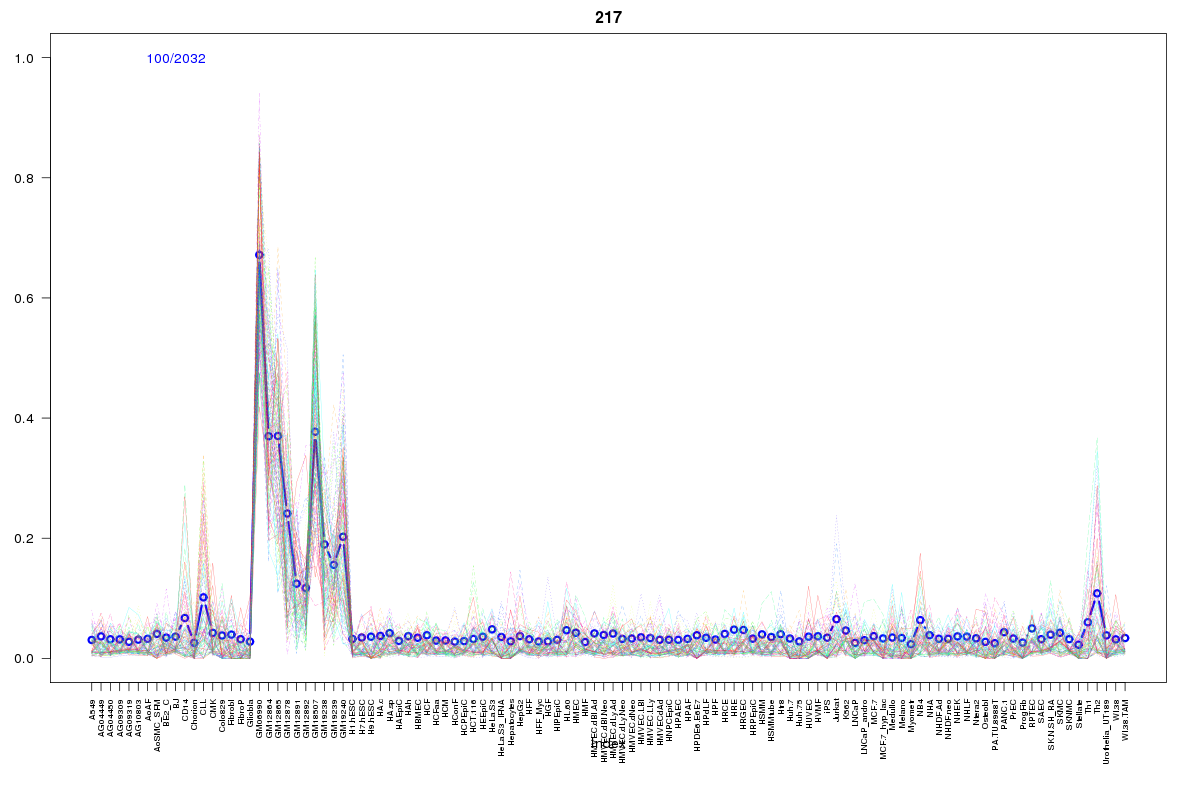 | 217 | 1 |
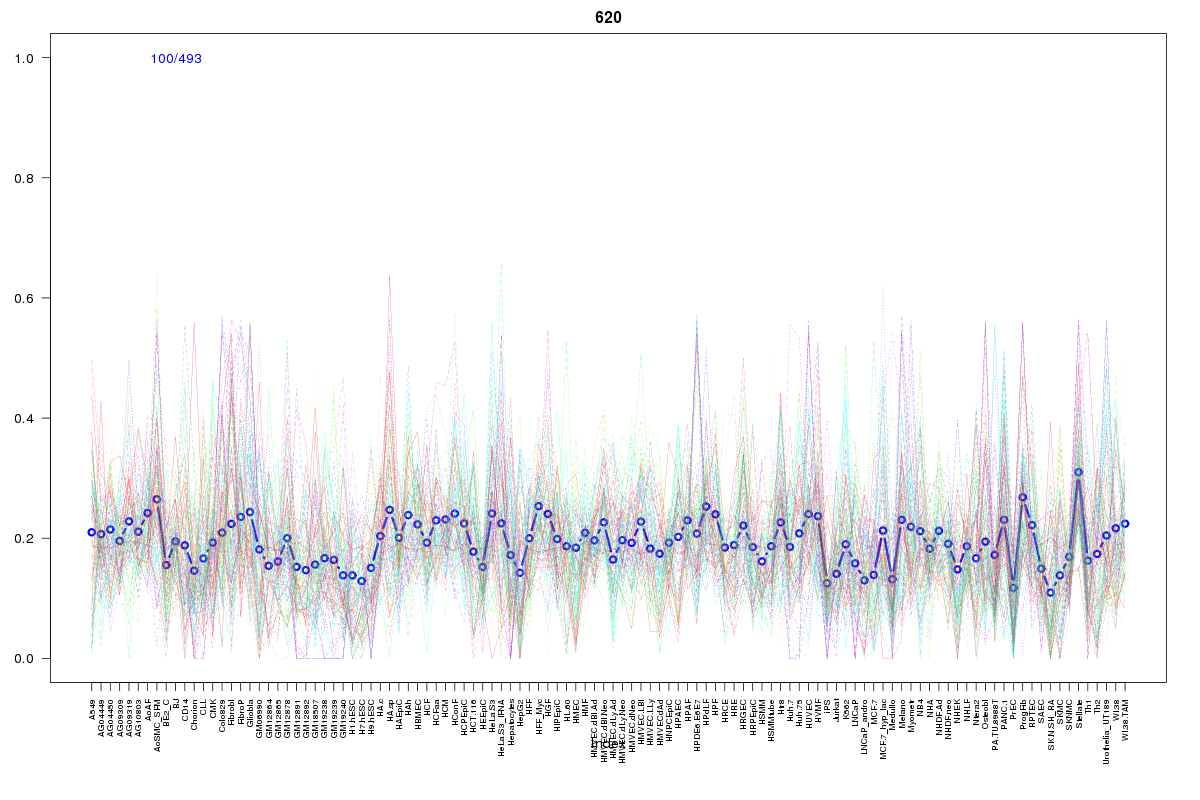 | 620 | 1 |
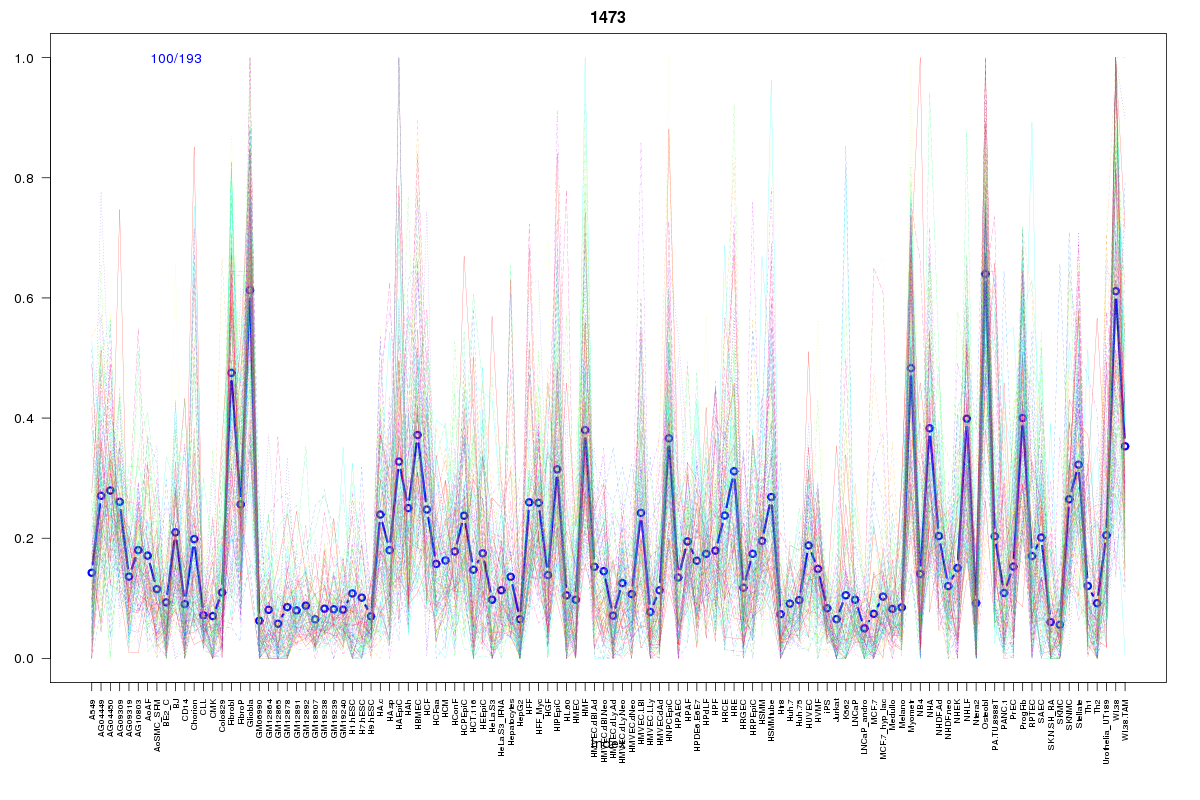 | 1473 | 1 |
 | 1923 | 1 |
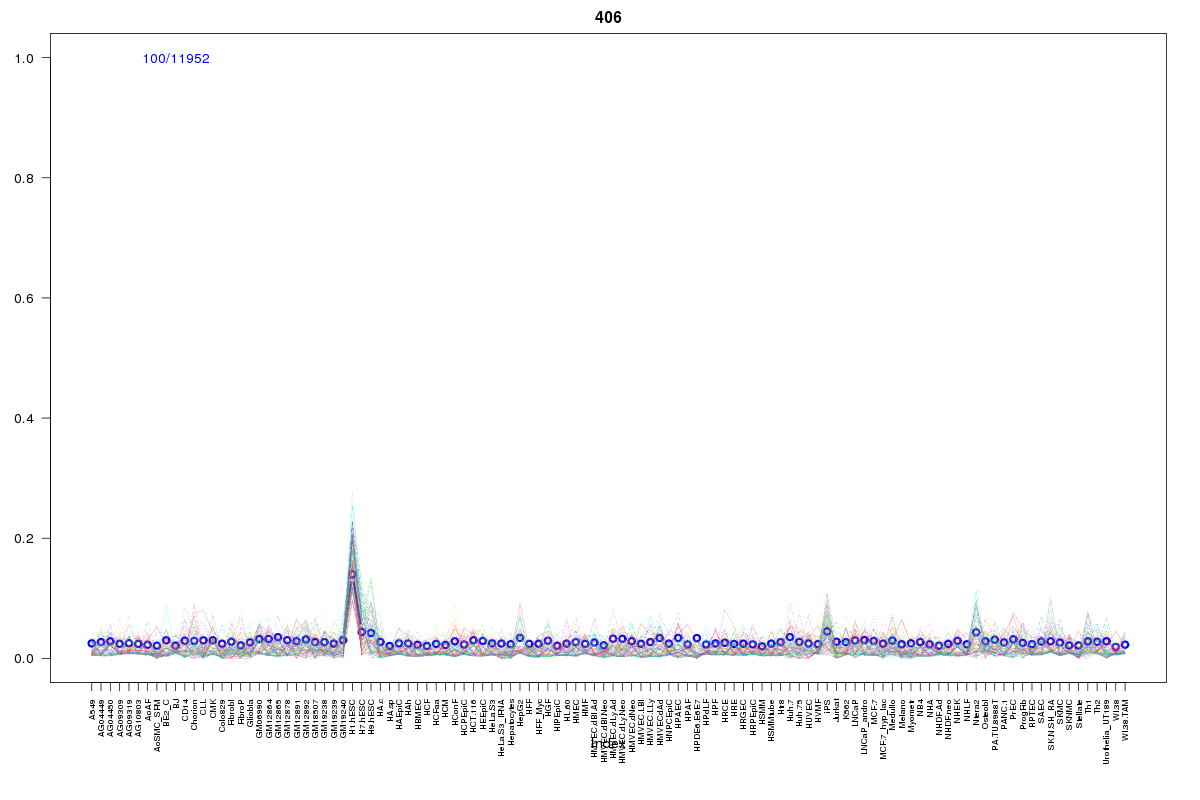 | 406 | 1 |
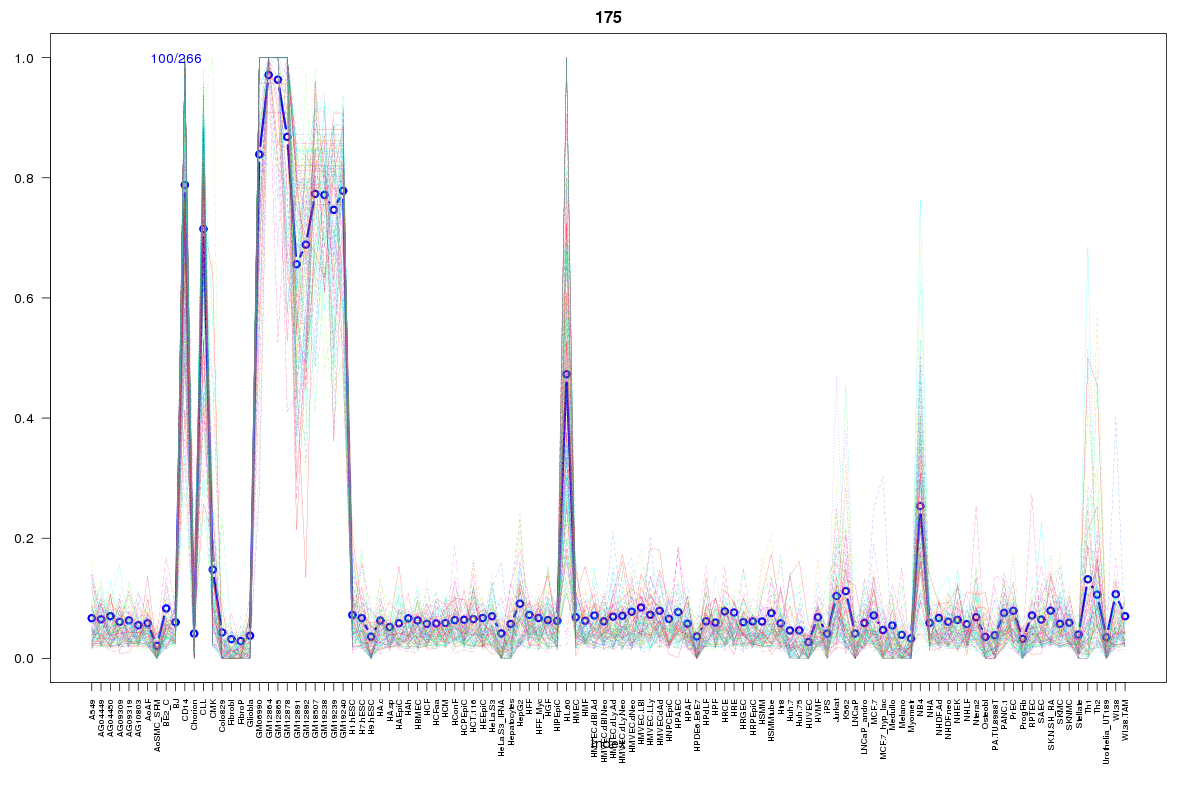 | 175 | 1 |
 | 687 | 1 |
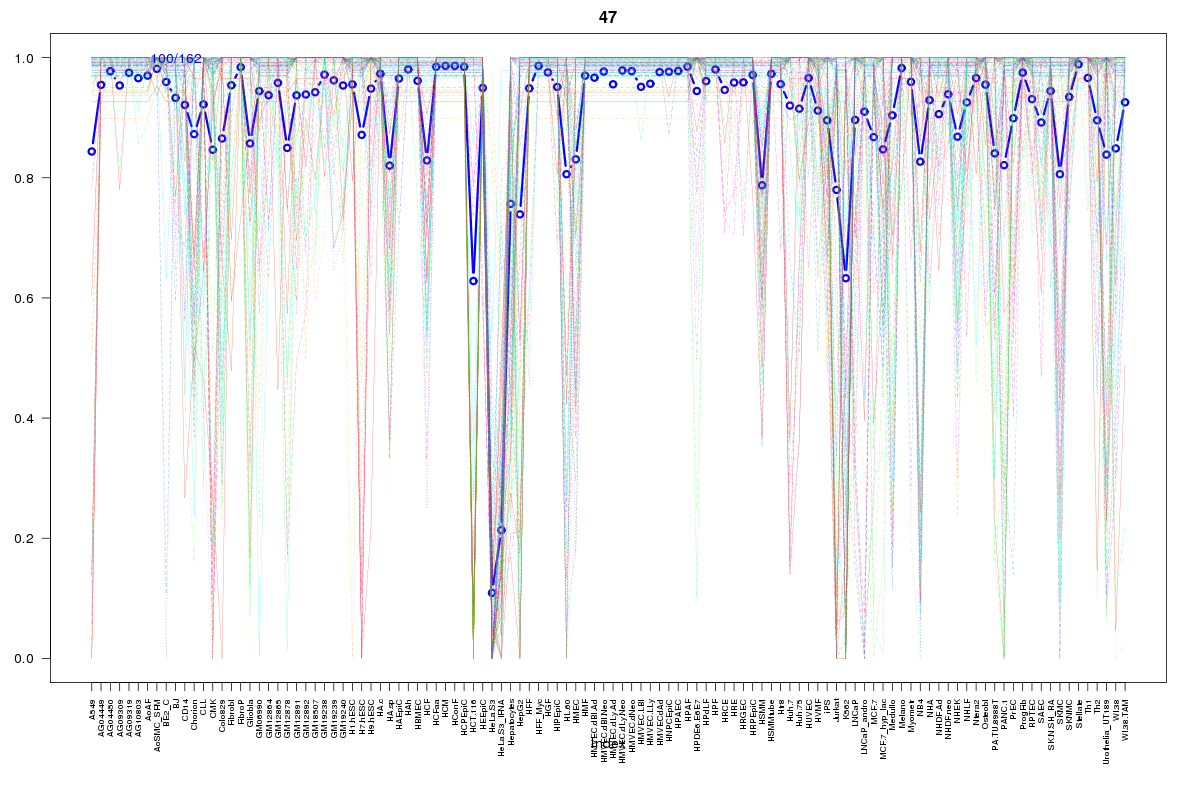 | 47 | 1 |
 | 2452 | 1 |
 | 2052 | 1 |
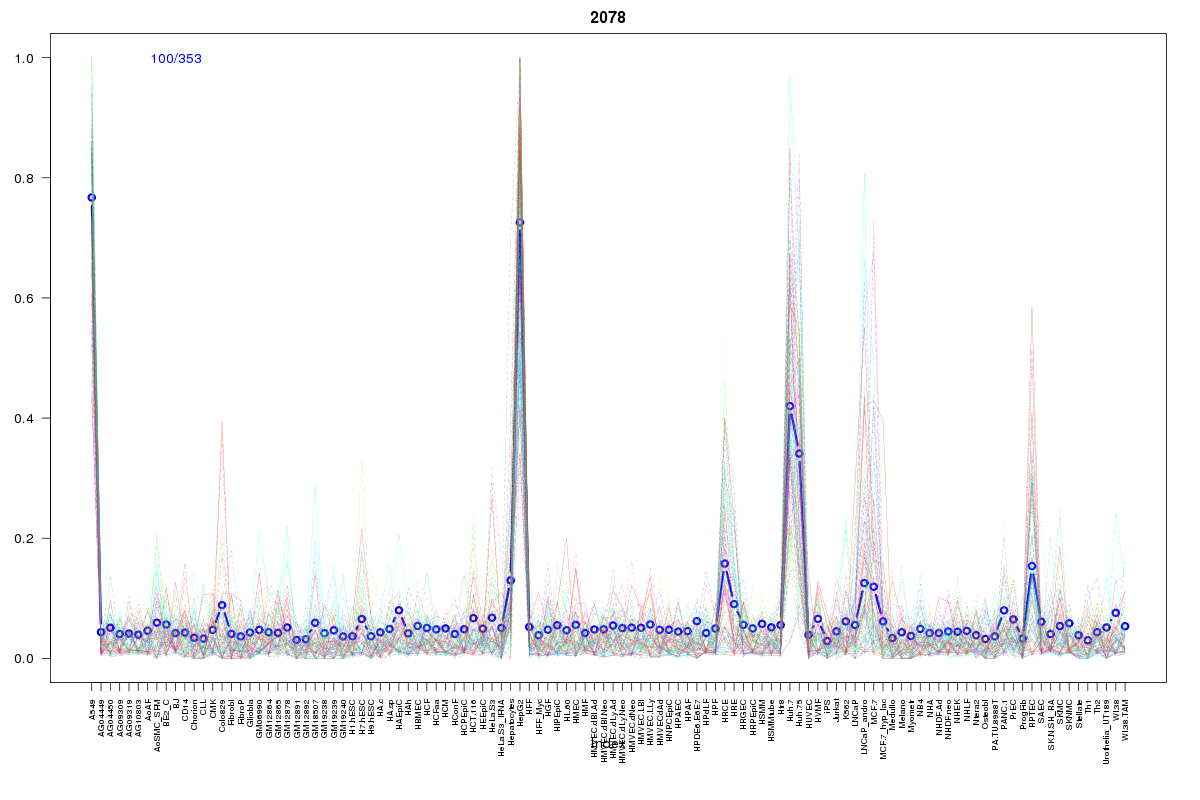 | 2078 | 1 |
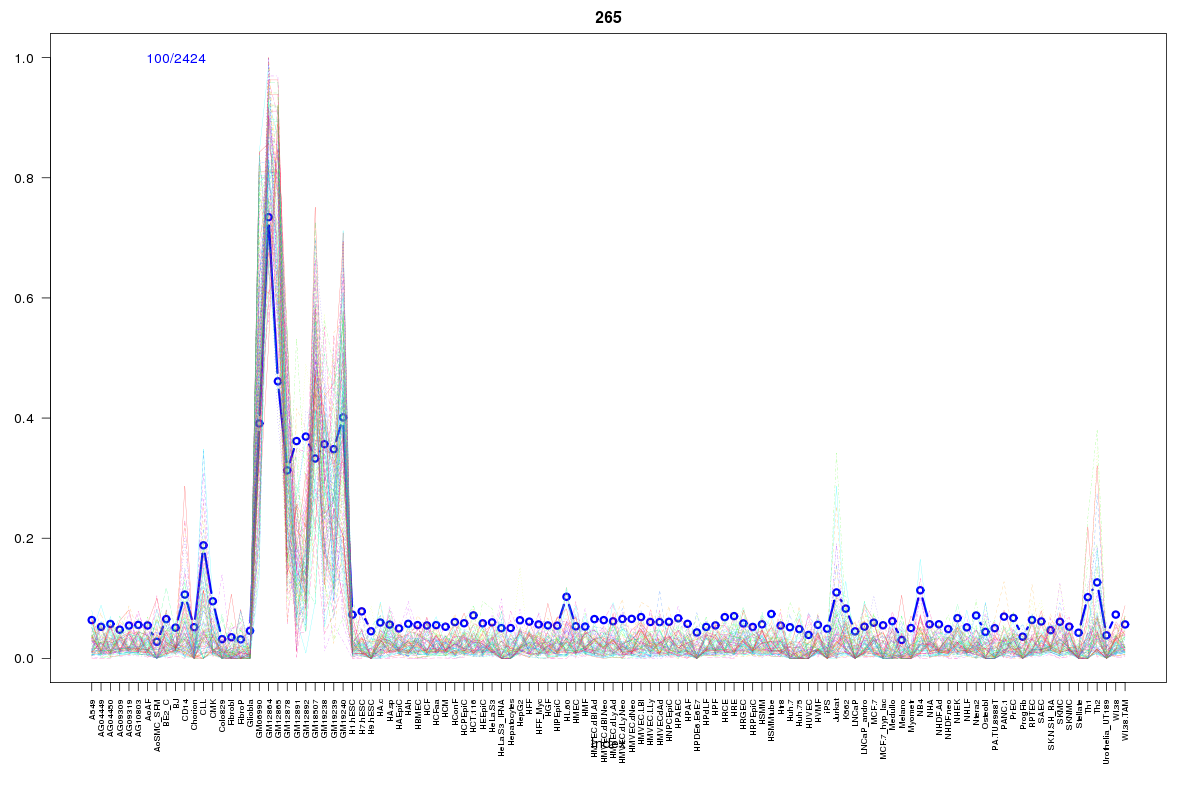 | 265 | 1 |
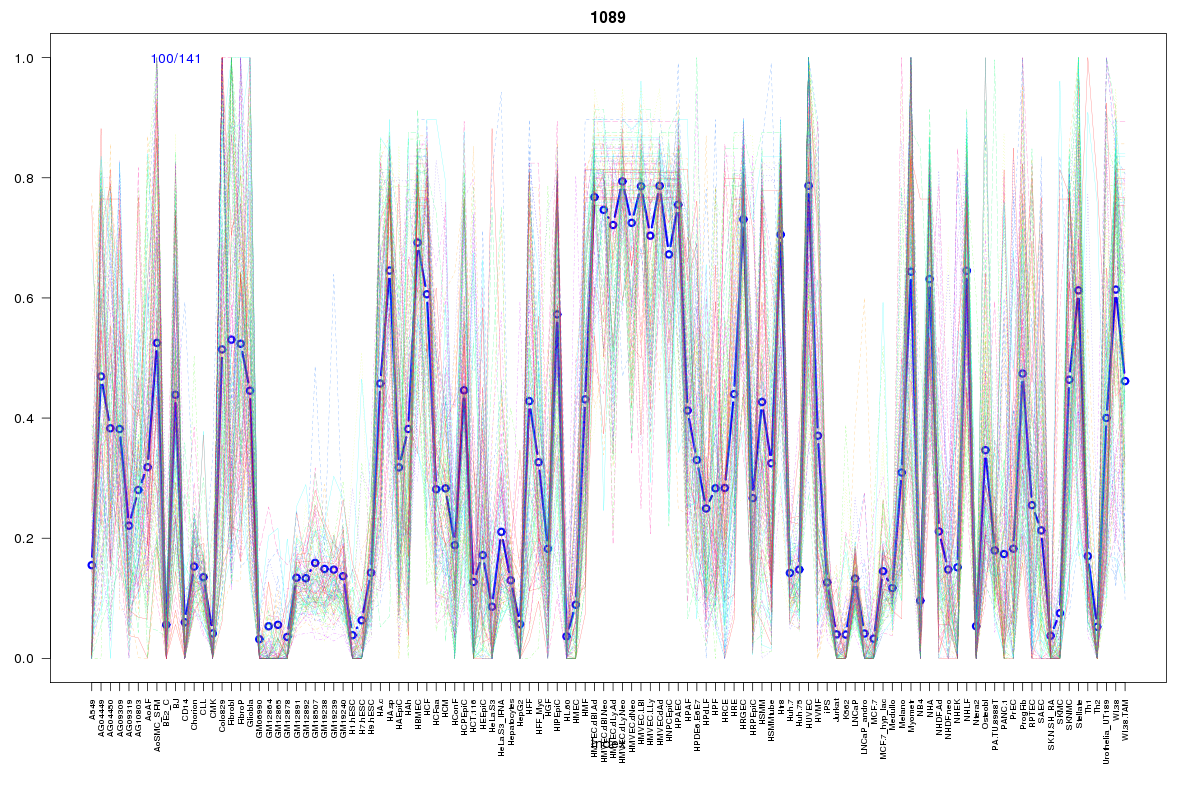 | 1089 | 1 |
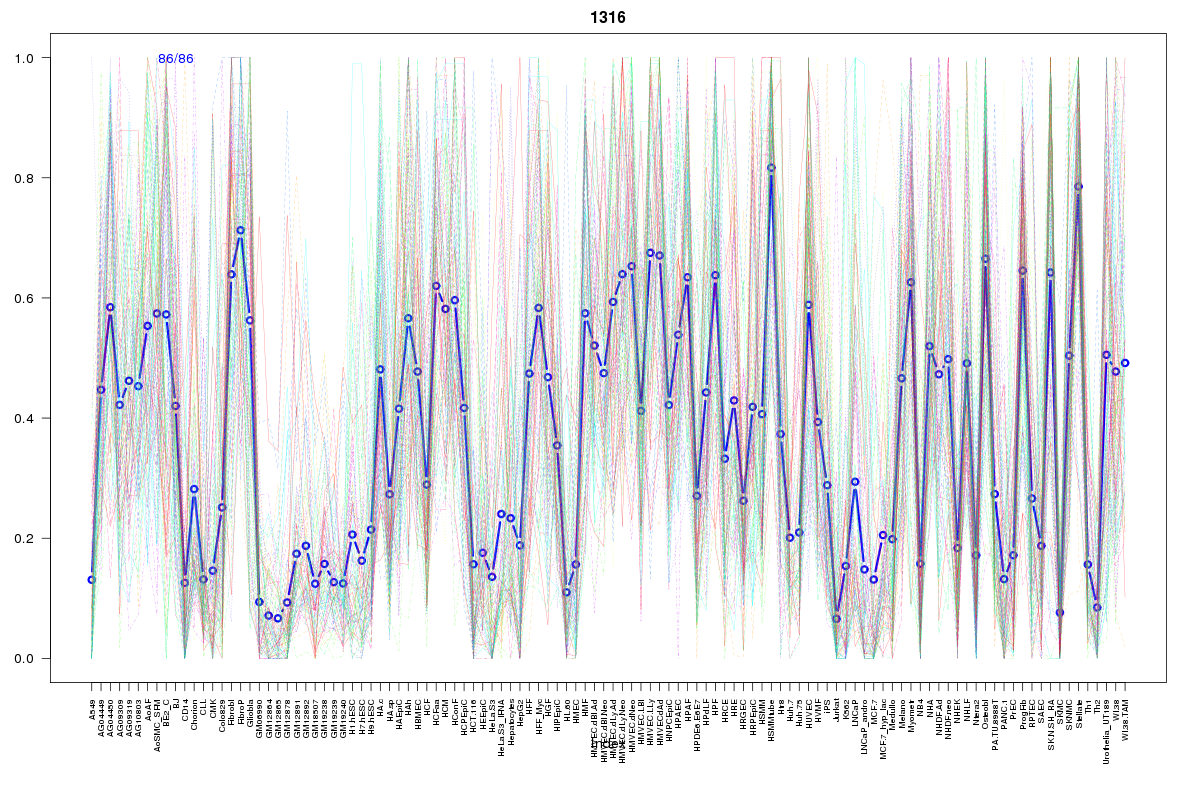 | 1316 | 1 |
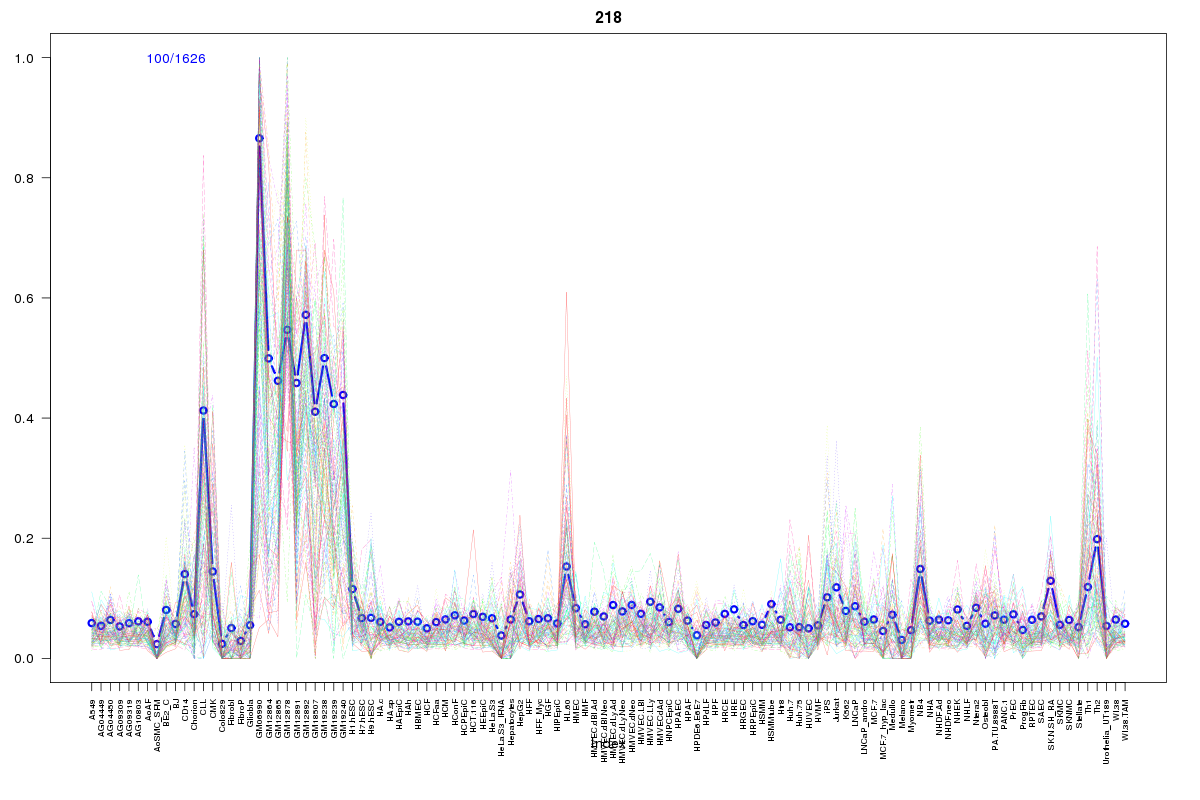 | 218 | 1 |
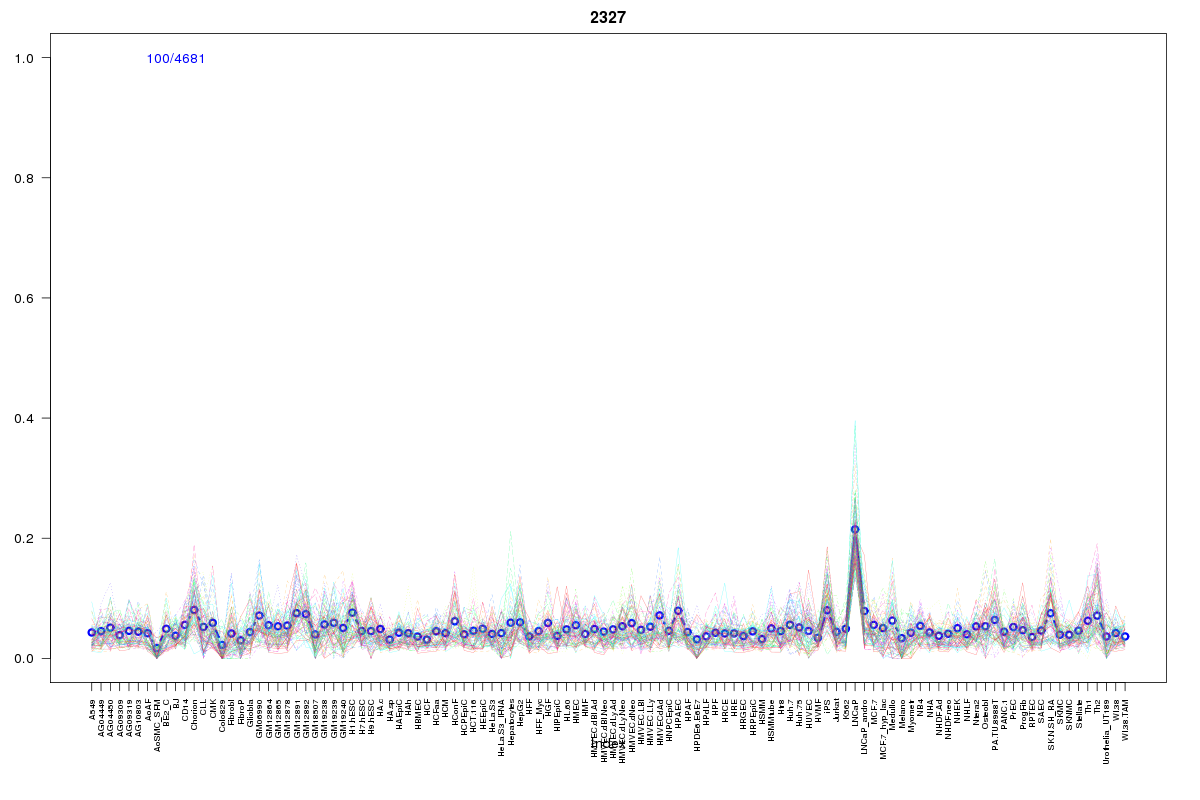 | 2327 | 1 |
 | 110 | 1 |
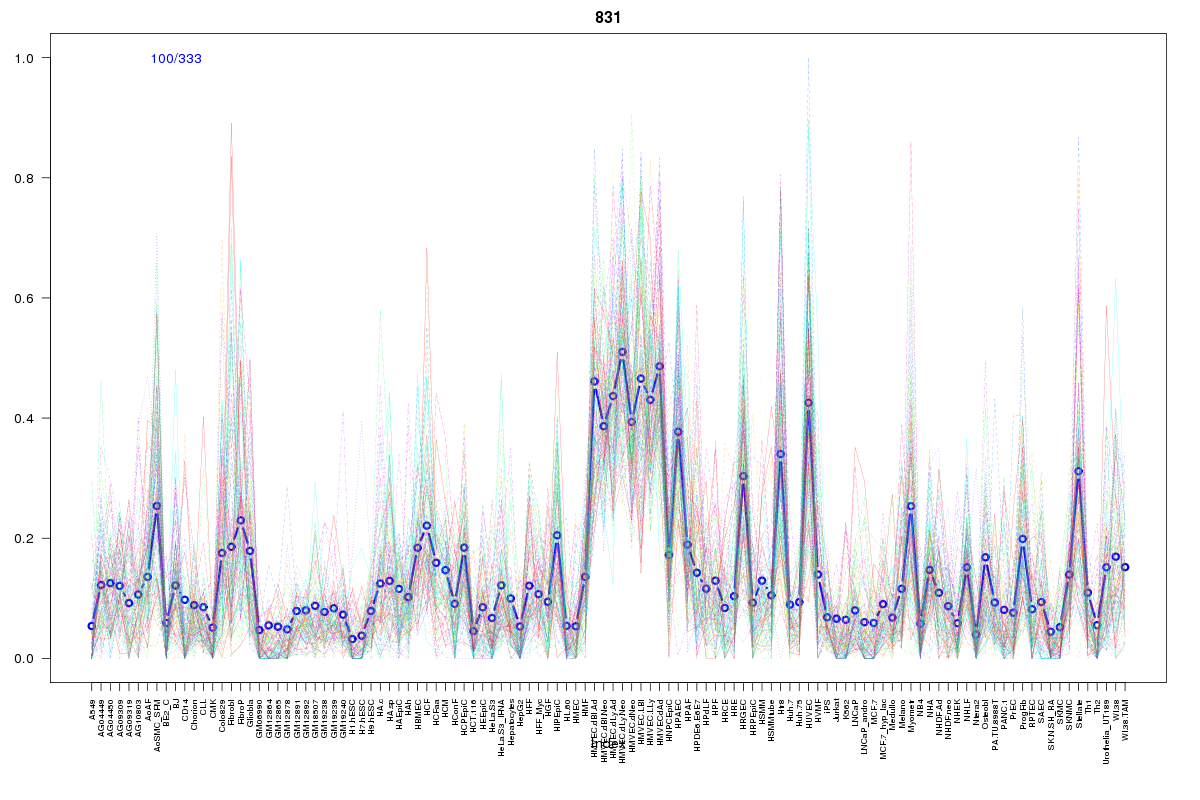 | 831 | 1 |
 | 77 | 1 |
 | 1605 | 1 |
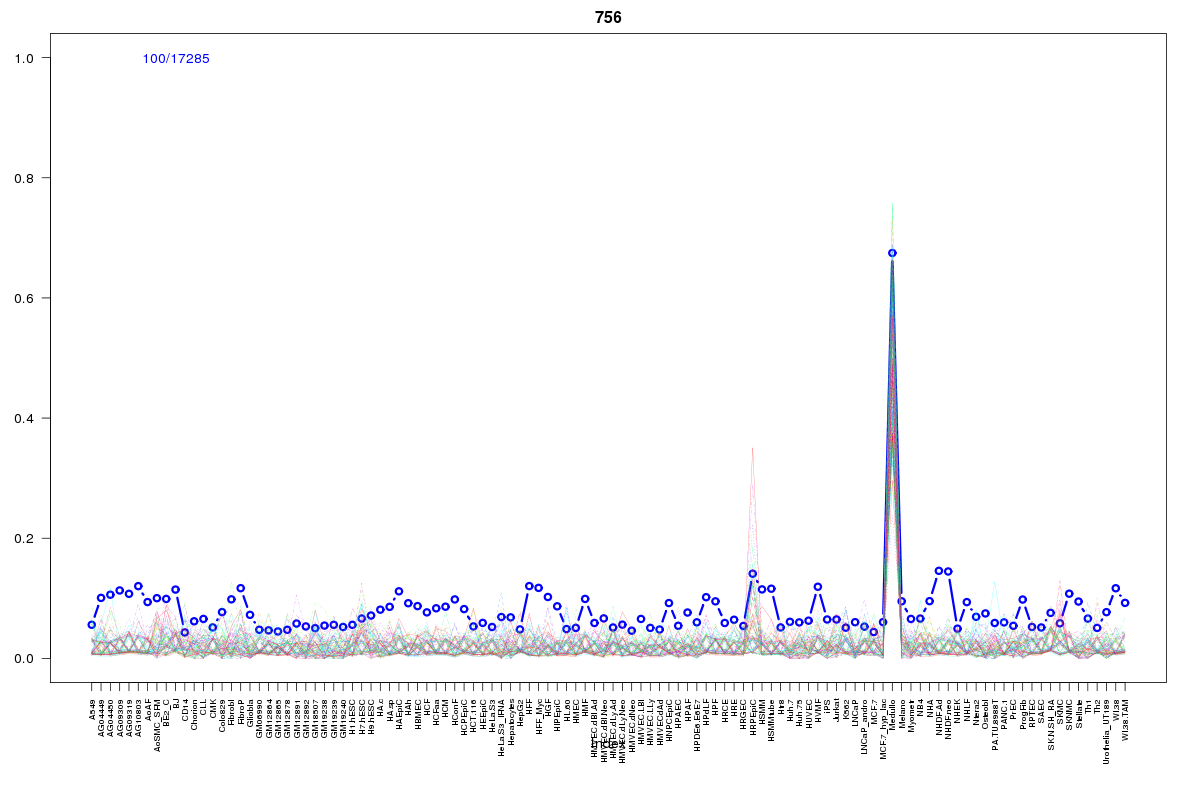 | 756 | 1 |
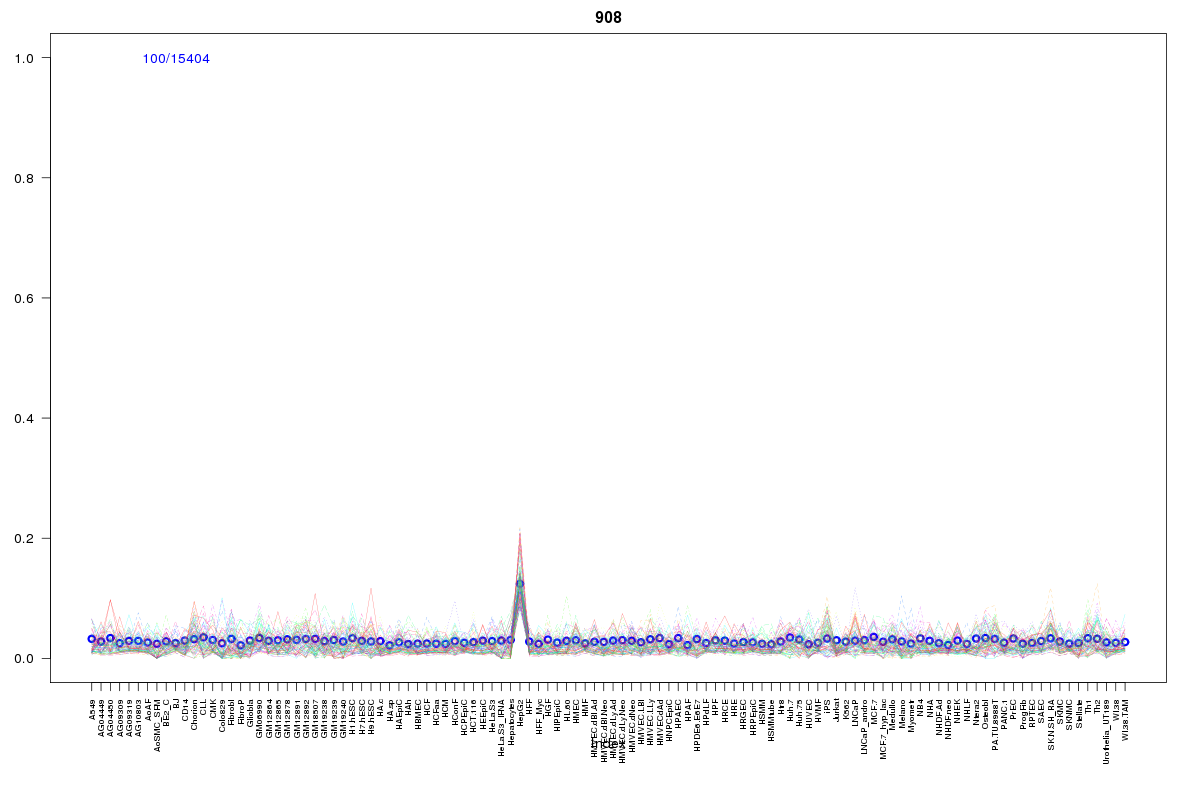 | 908 | 1 |
 | 66 | 1 |
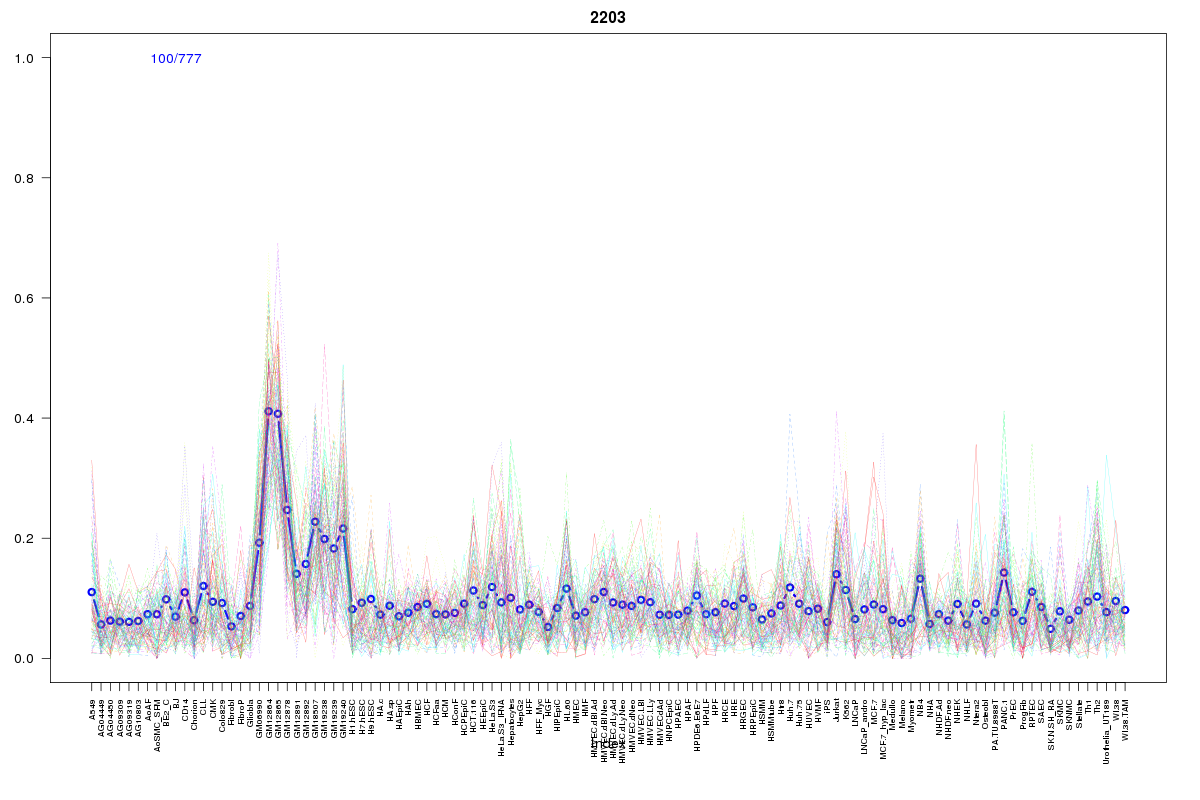 | 2203 | 1 |
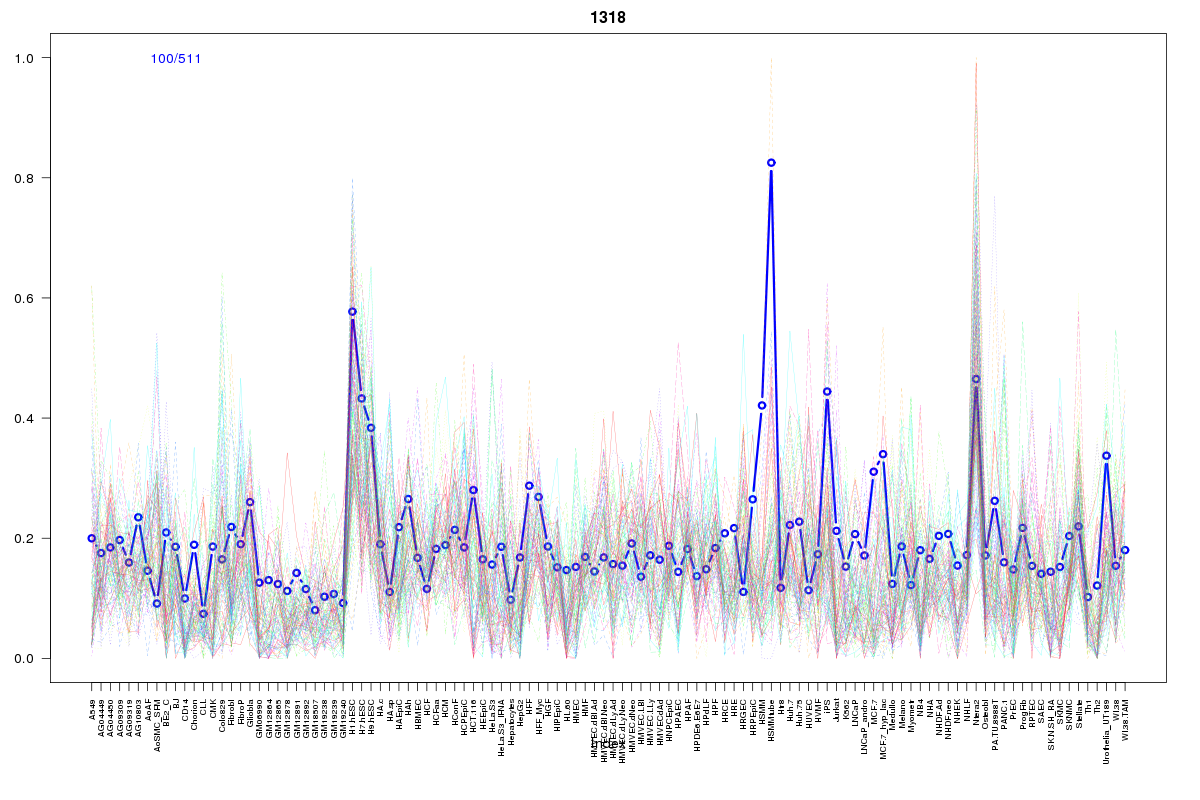 | 1318 | 1 |
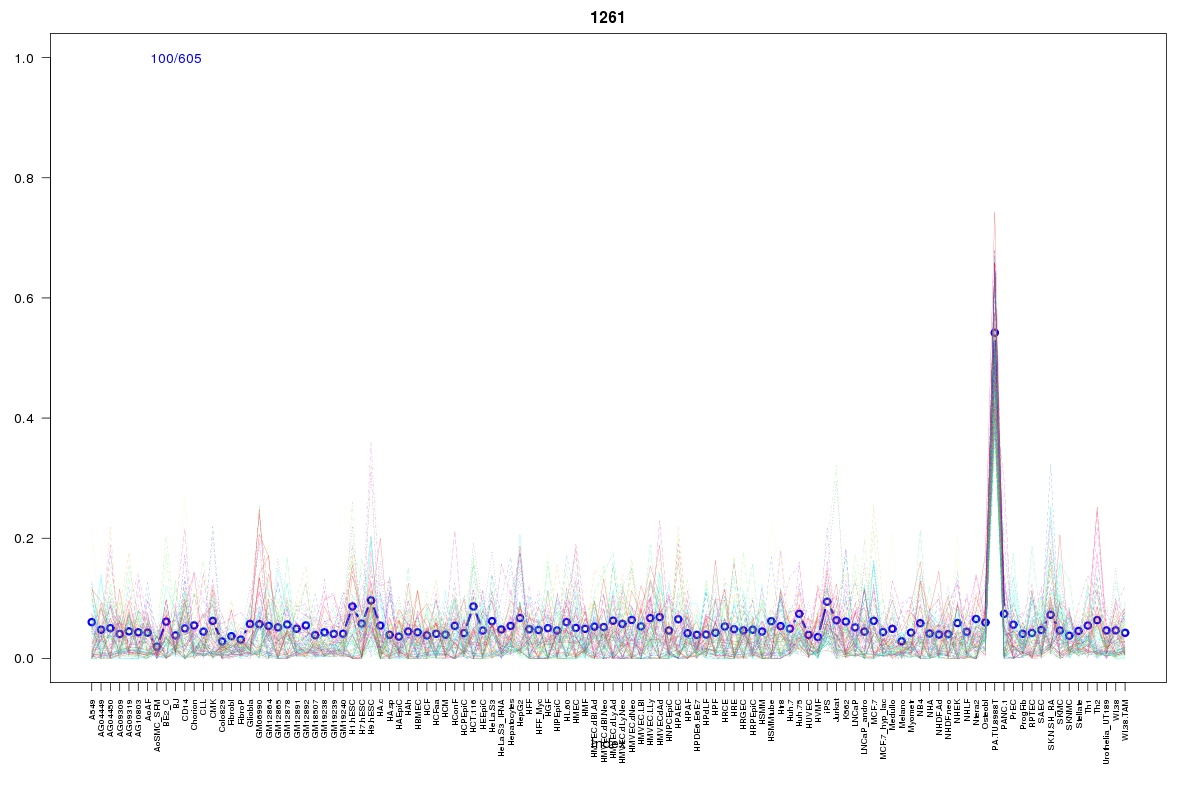 | 1261 | 1 |
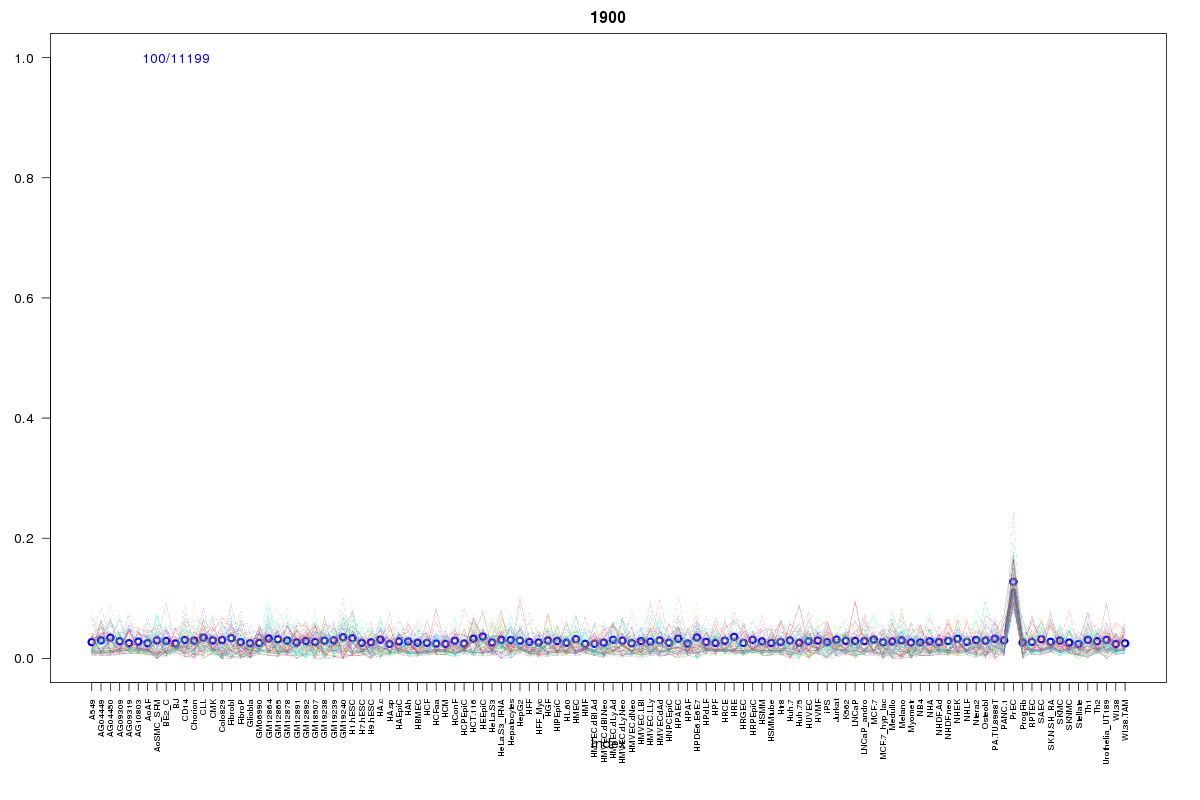 | 1900 | 1 |
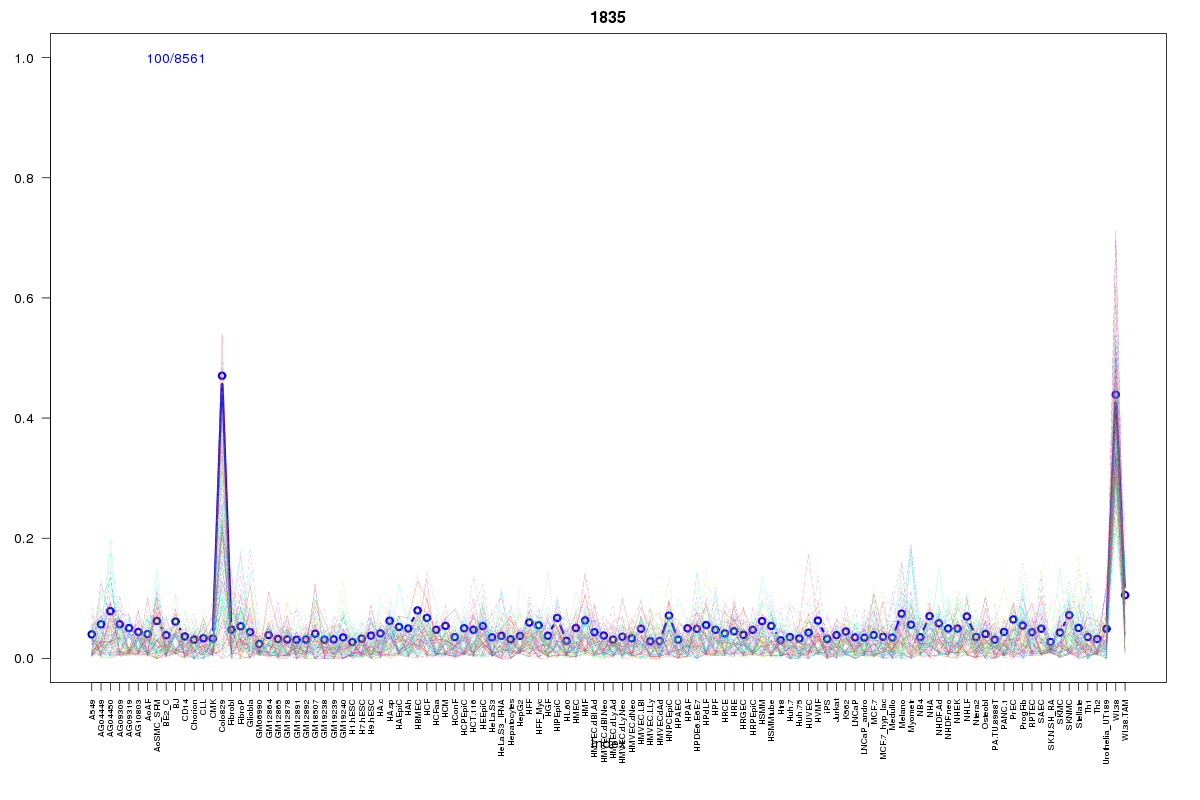 | 1835 | 1 |
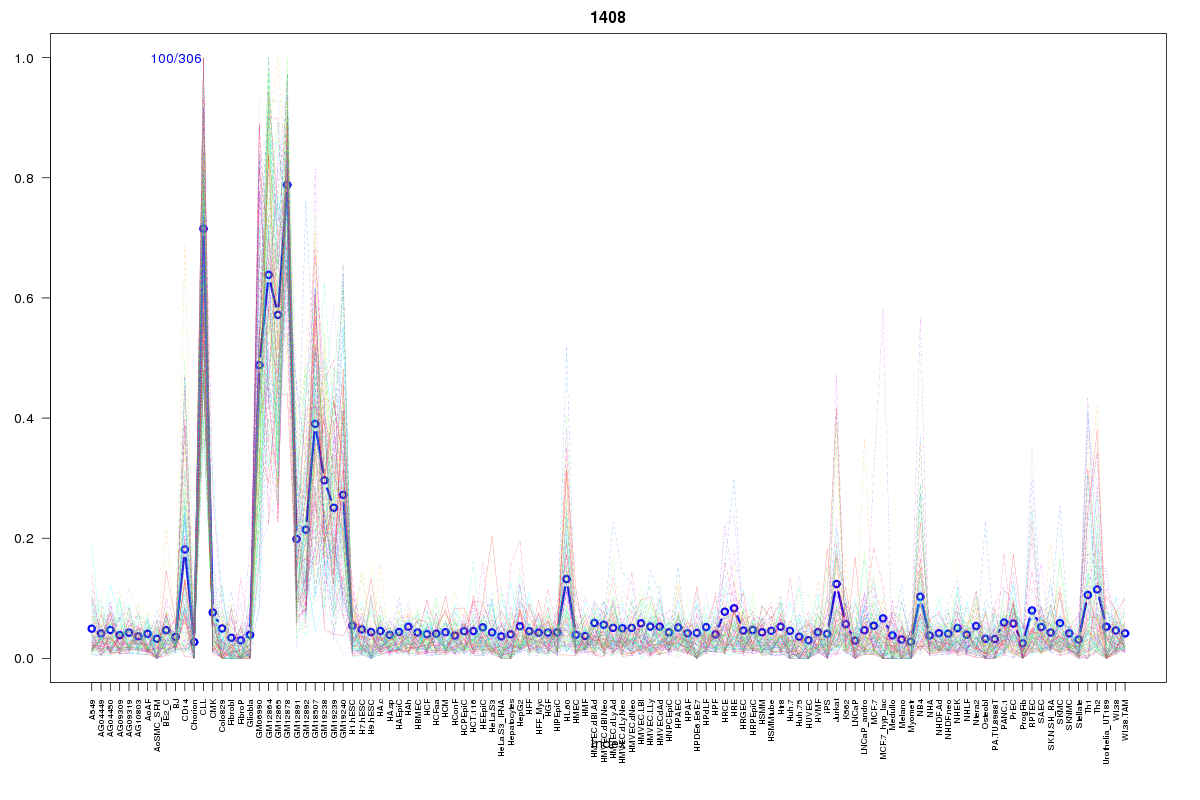 | 1408 | 1 |
 | 1927 | 1 |
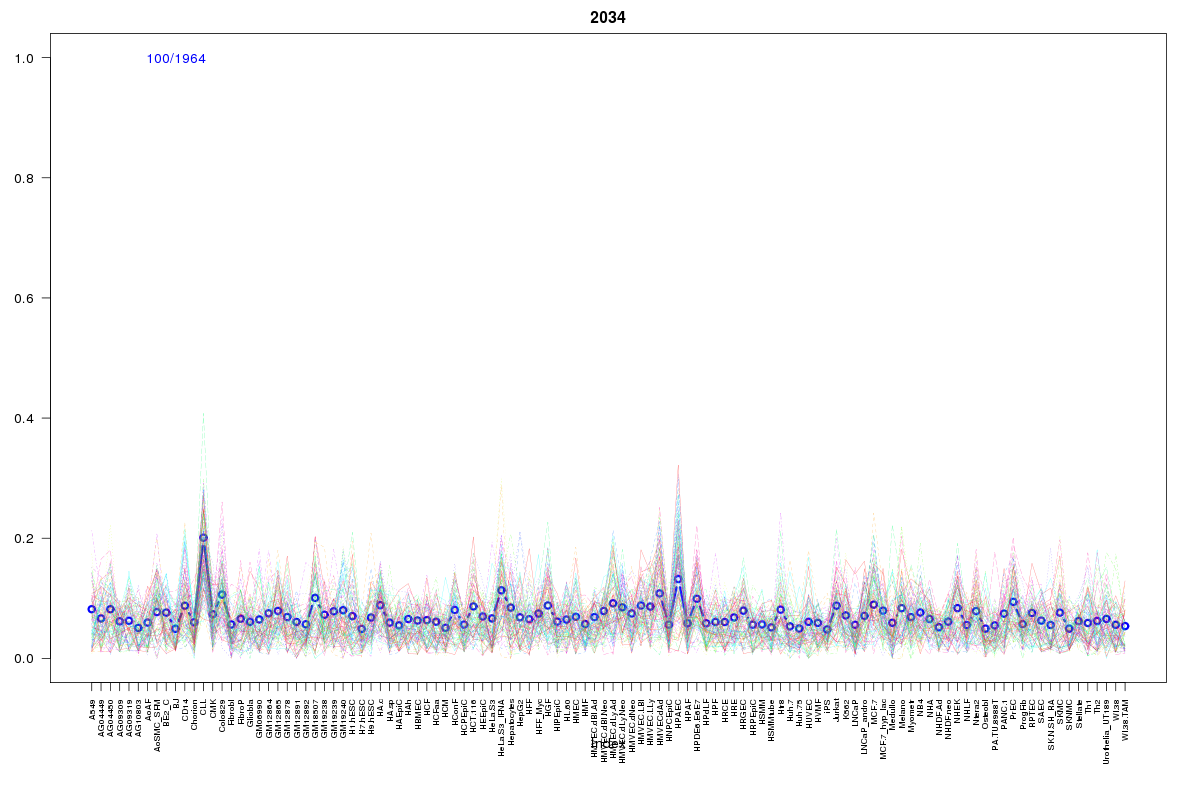 | 2034 | 1 |
 | 2237 | 1 |
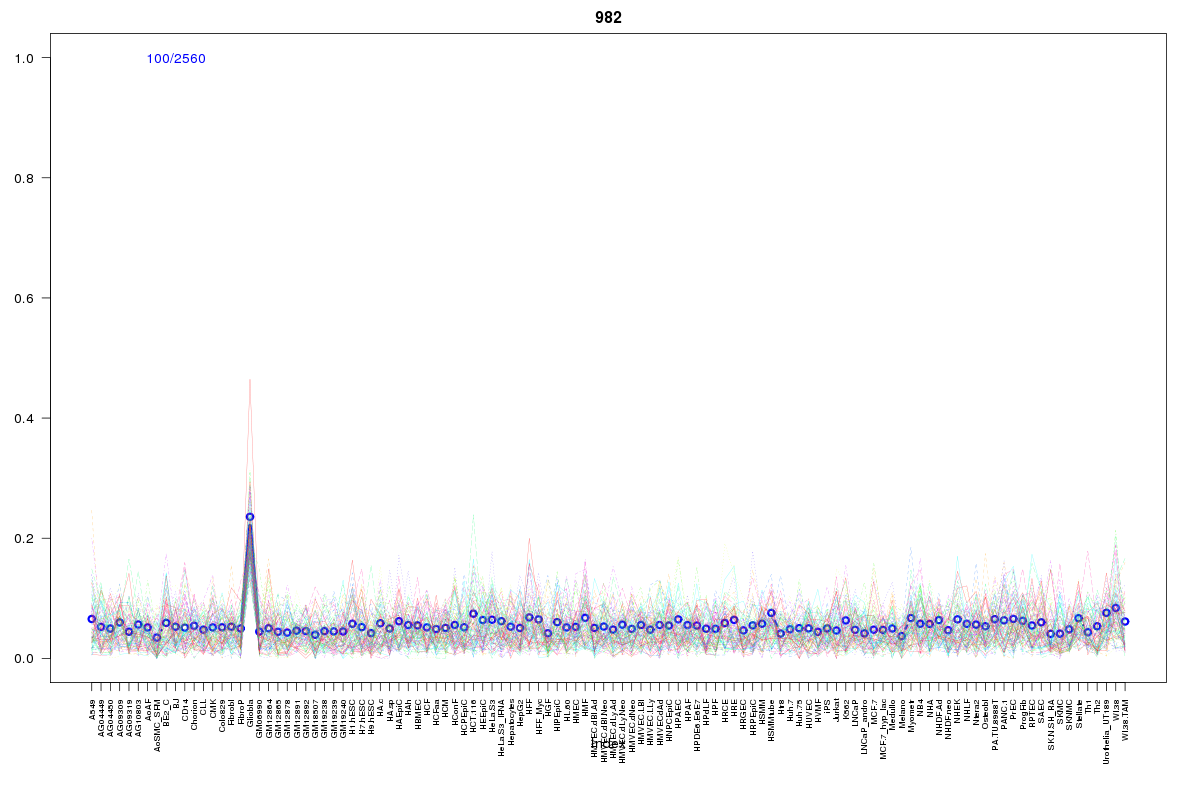 | 982 | 1 |
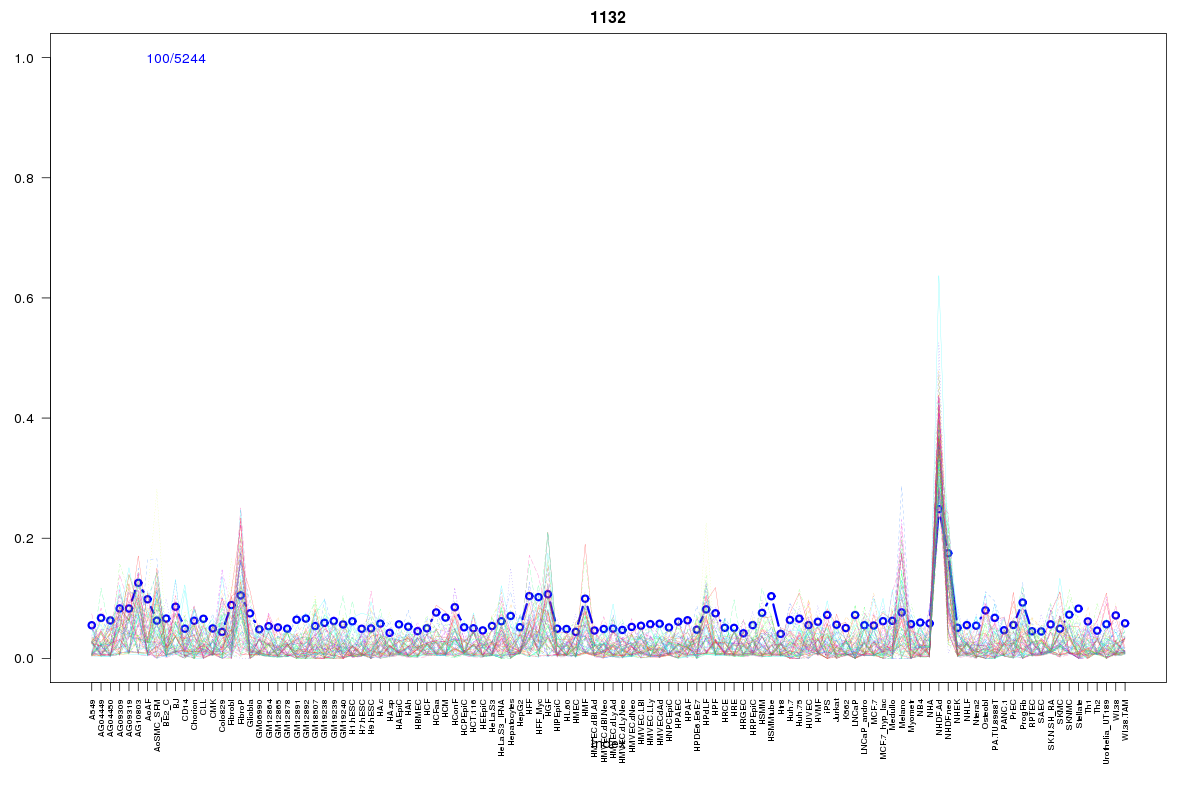 | 1132 | 1 |
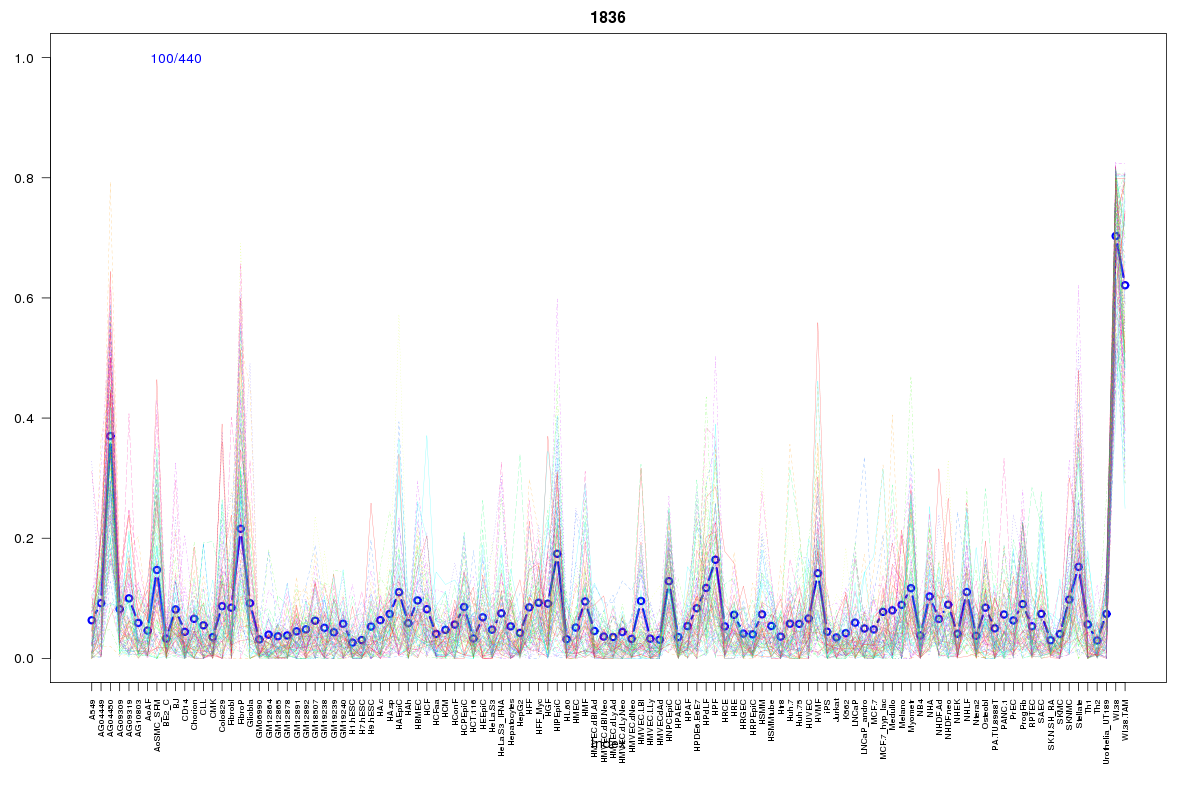 | 1836 | 1 |
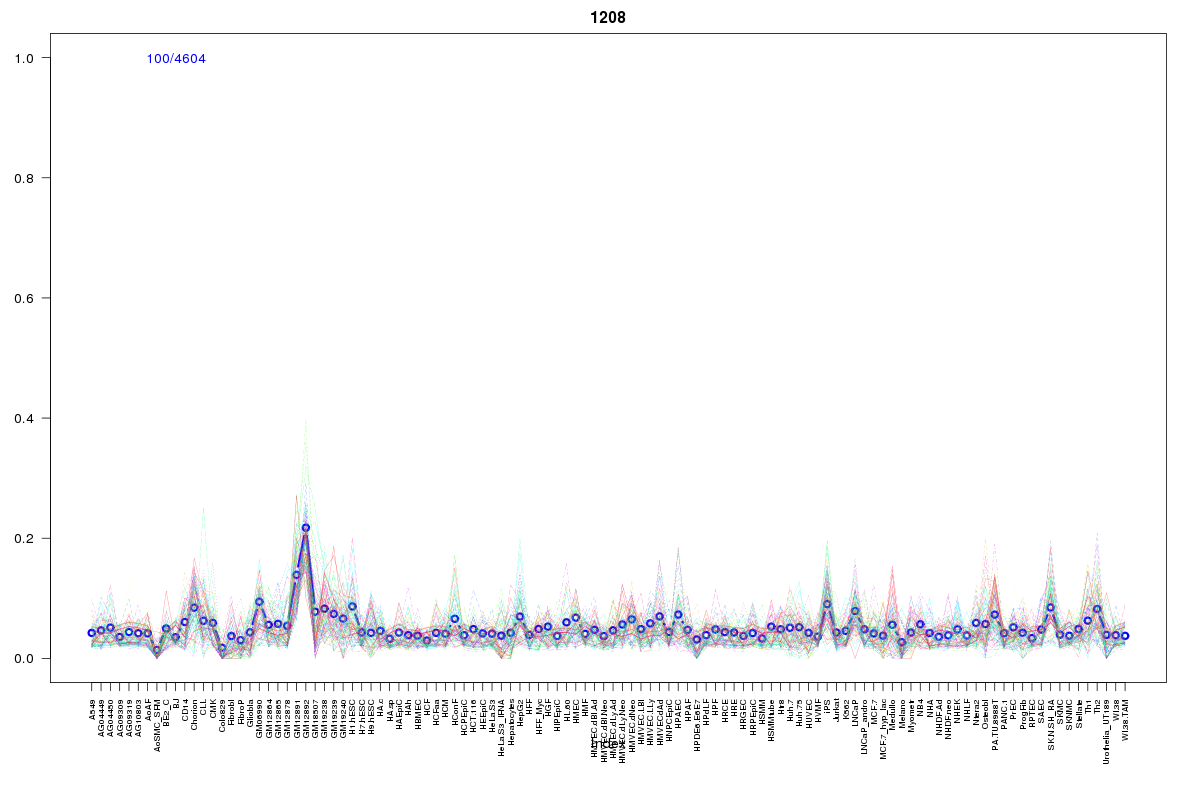 | 1208 | 1 |
 | 2449 | 1 |
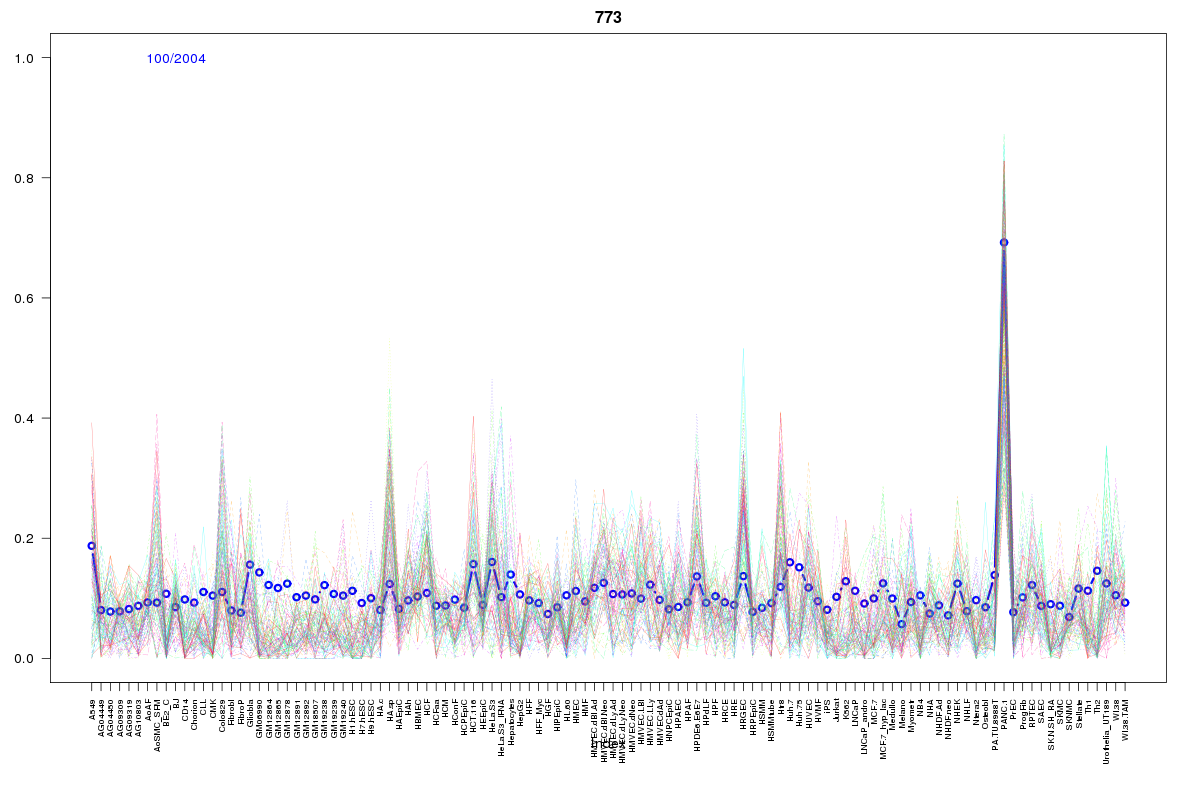 | 773 | 1 |
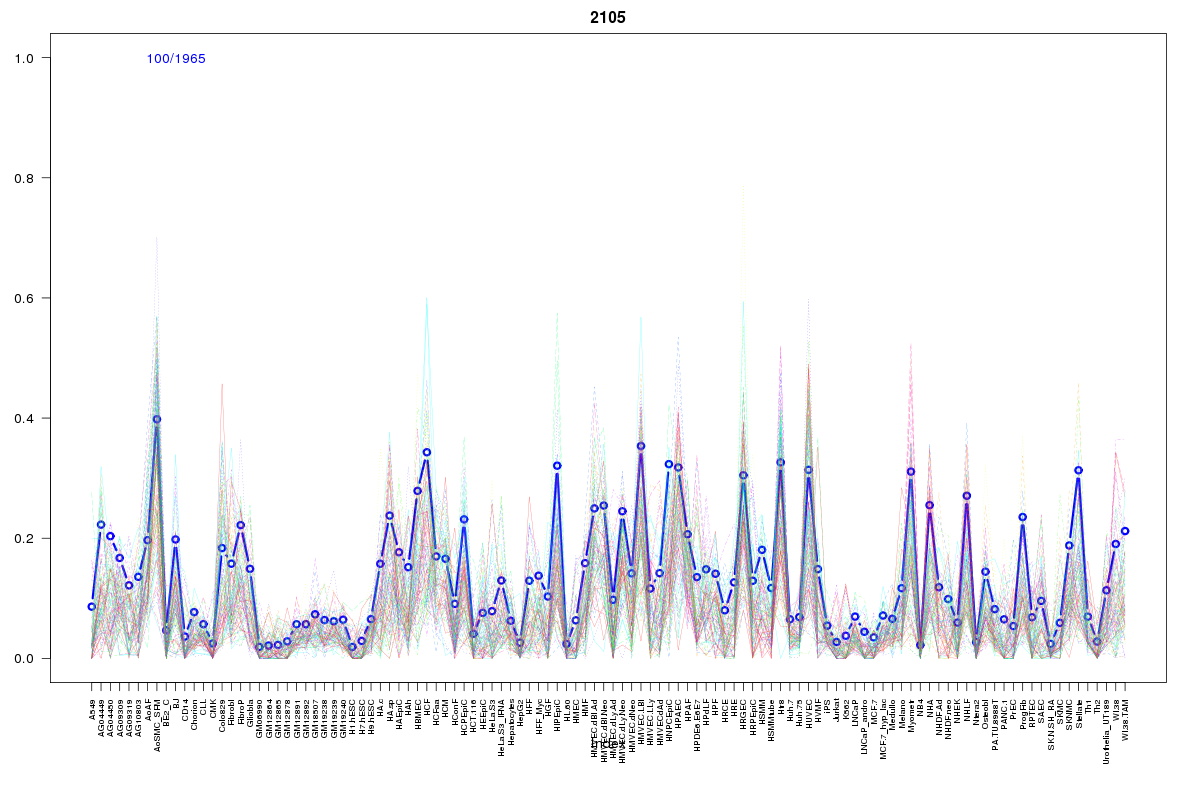 | 2105 | 1 |
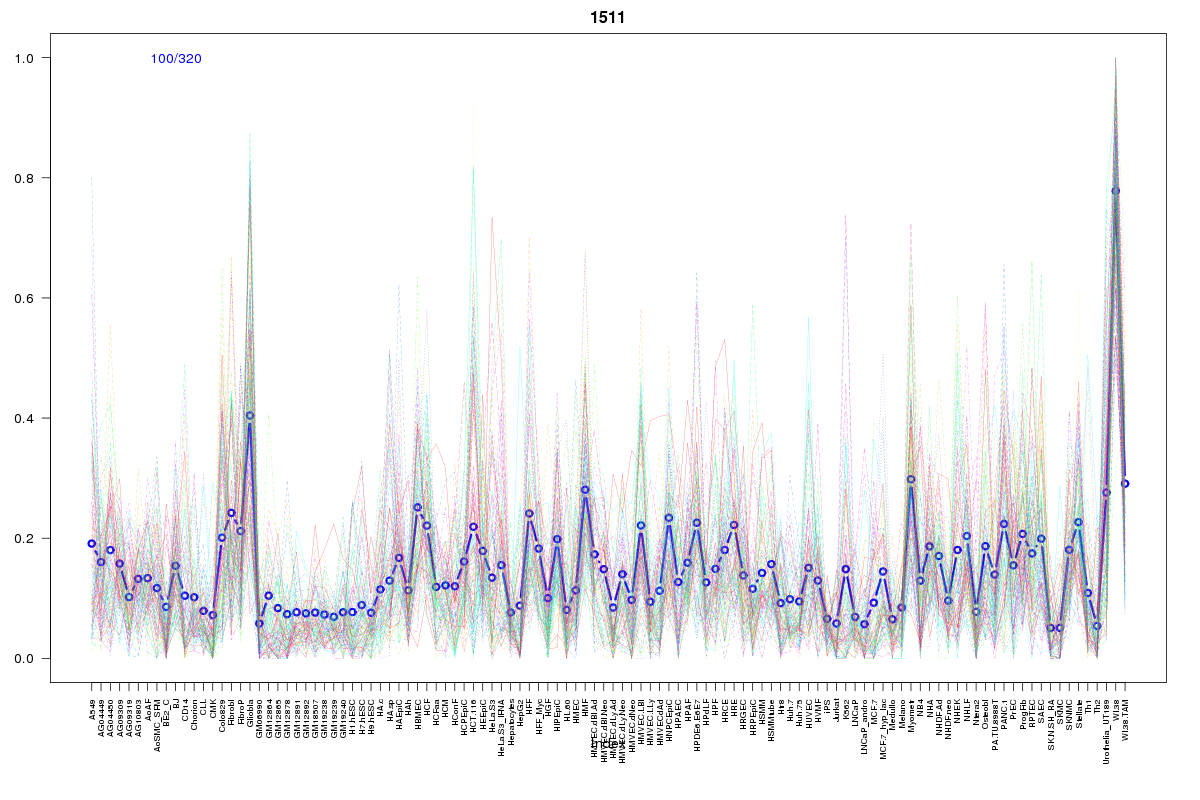 | 1511 | 1 |
 | 1008 | 1 |
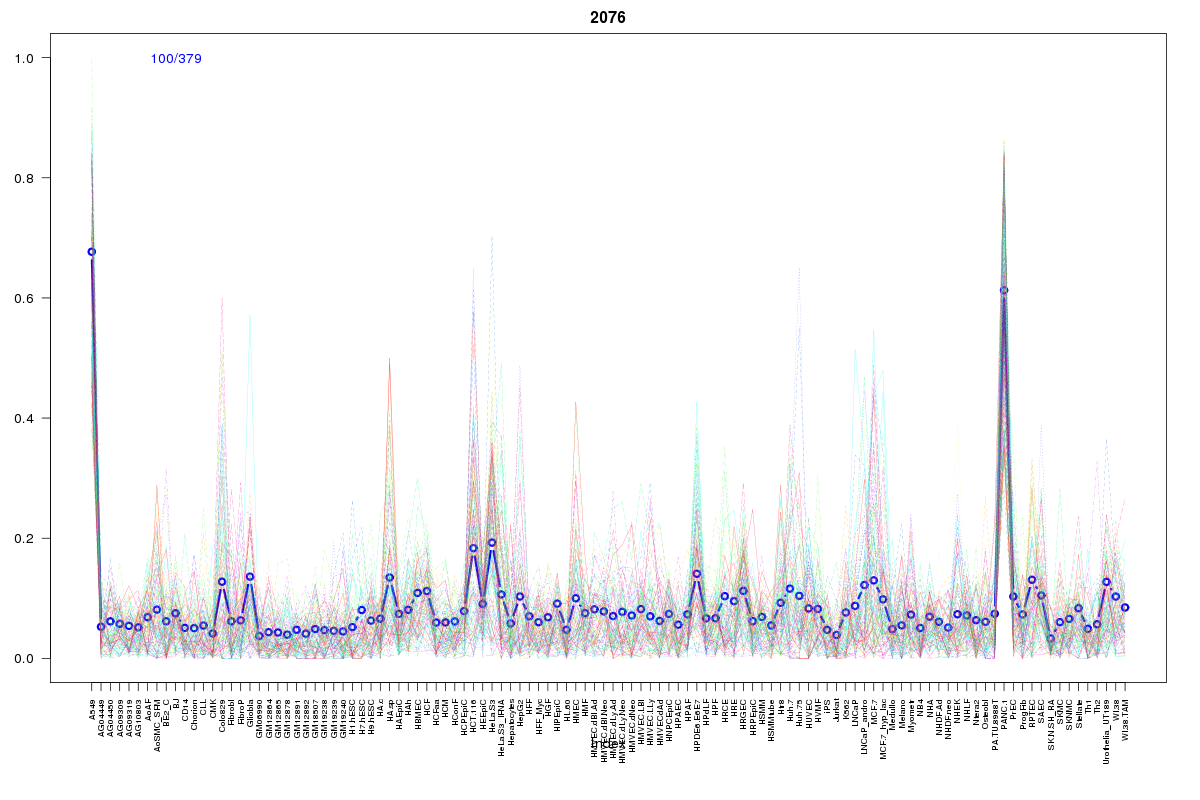 | 2076 | 1 |
 | 394 | 1 |
 | 1955 | 1 |
 | 939 | 1 |
 | 299 | 1 |
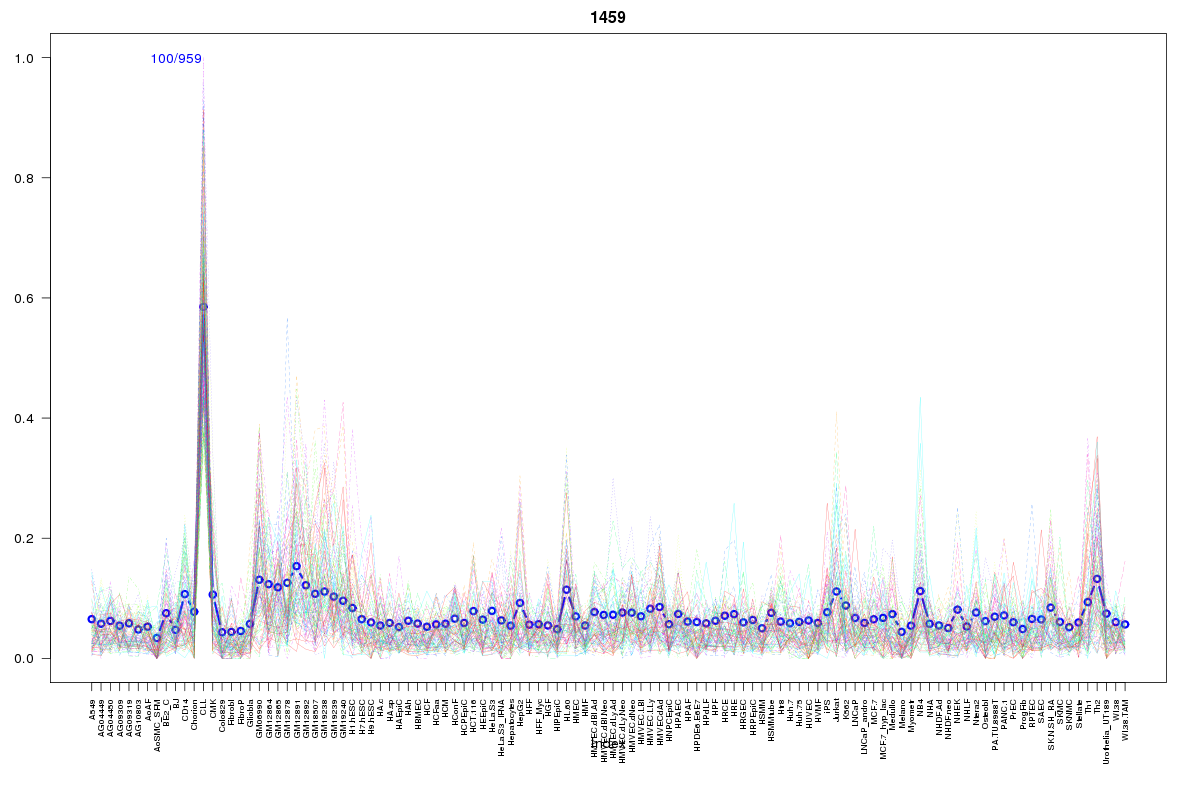 | 1459 | 1 |
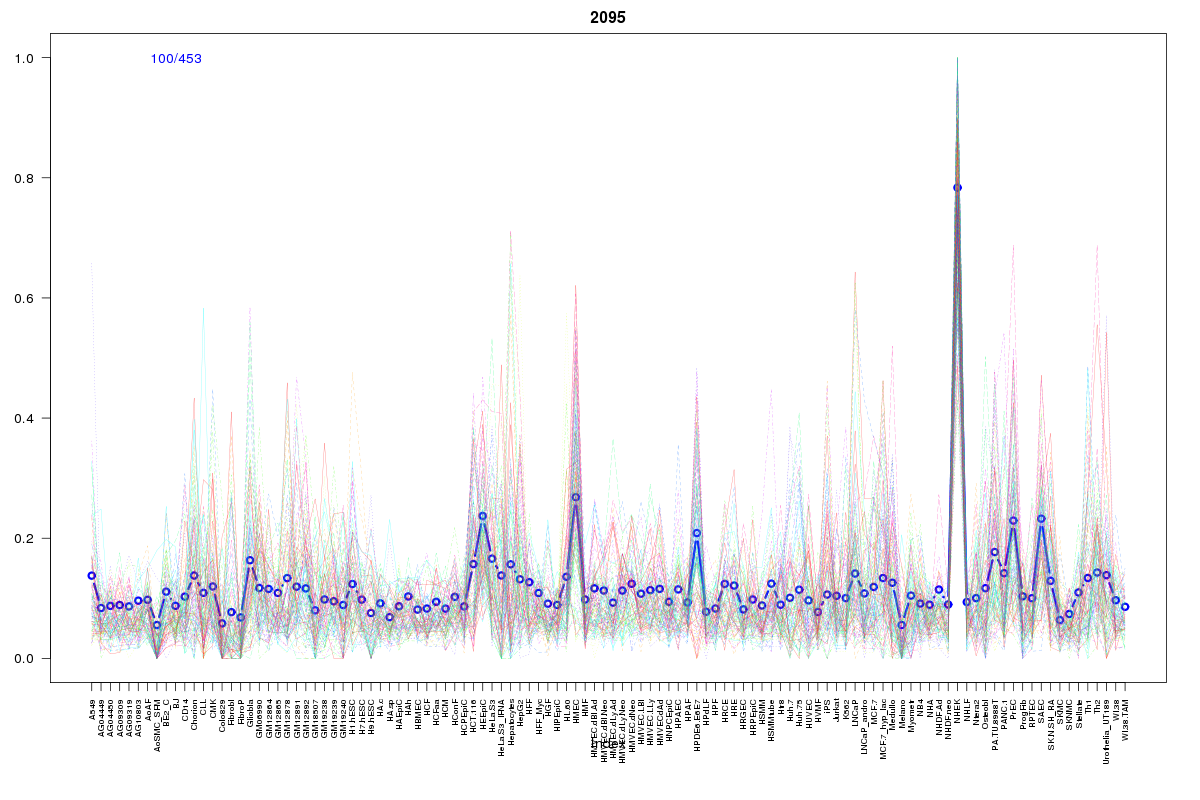 | 2095 | 1 |
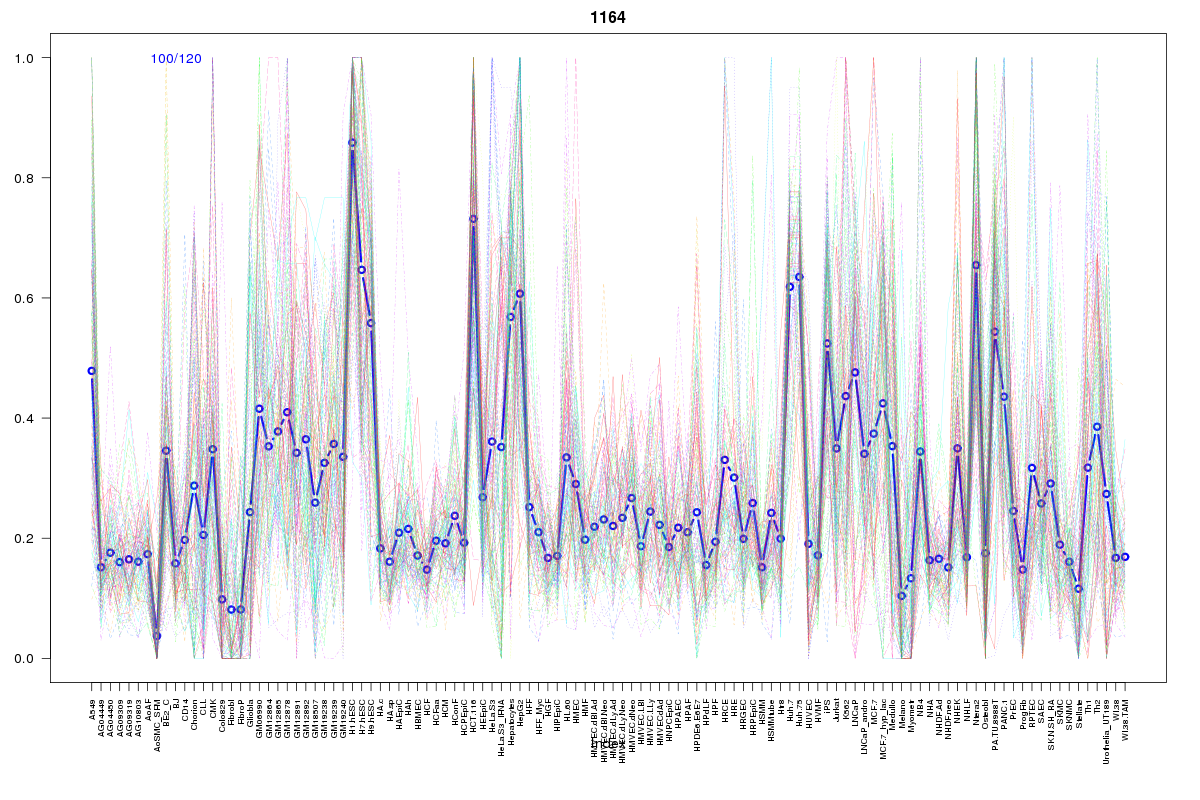 | 1164 | 1 |
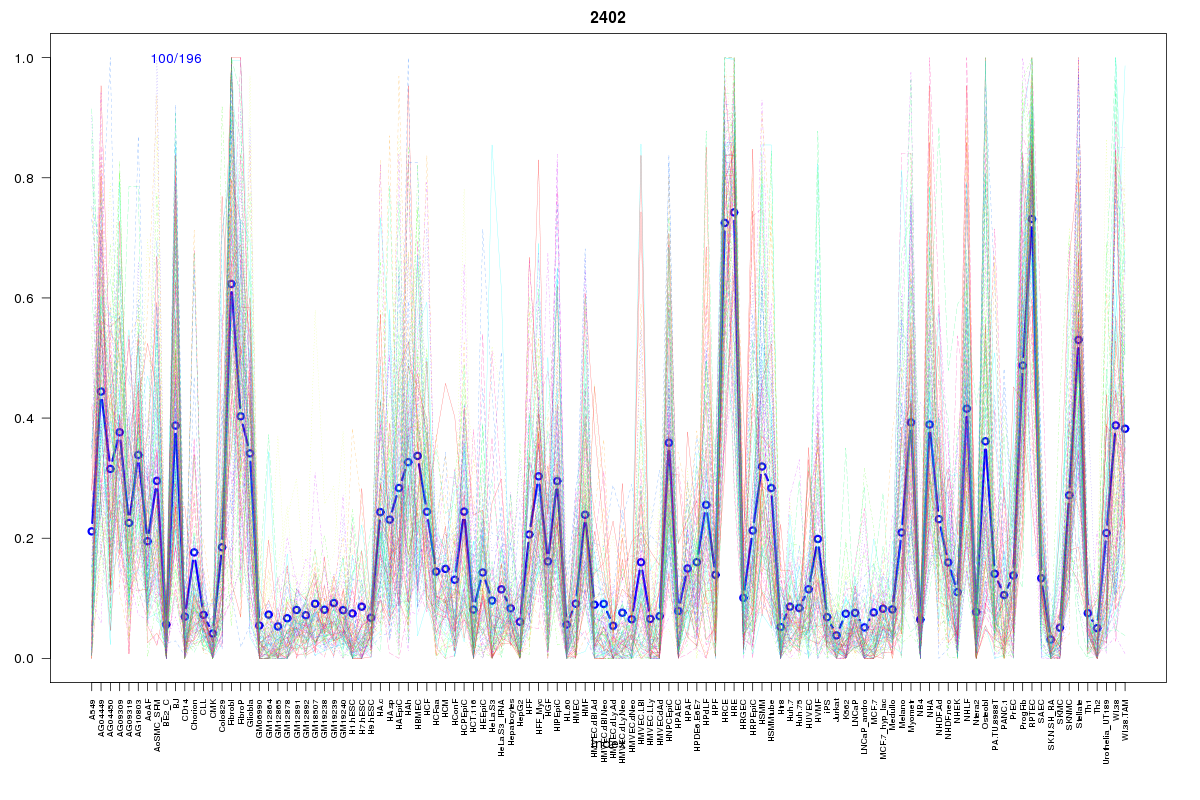 | 2402 | 1 |
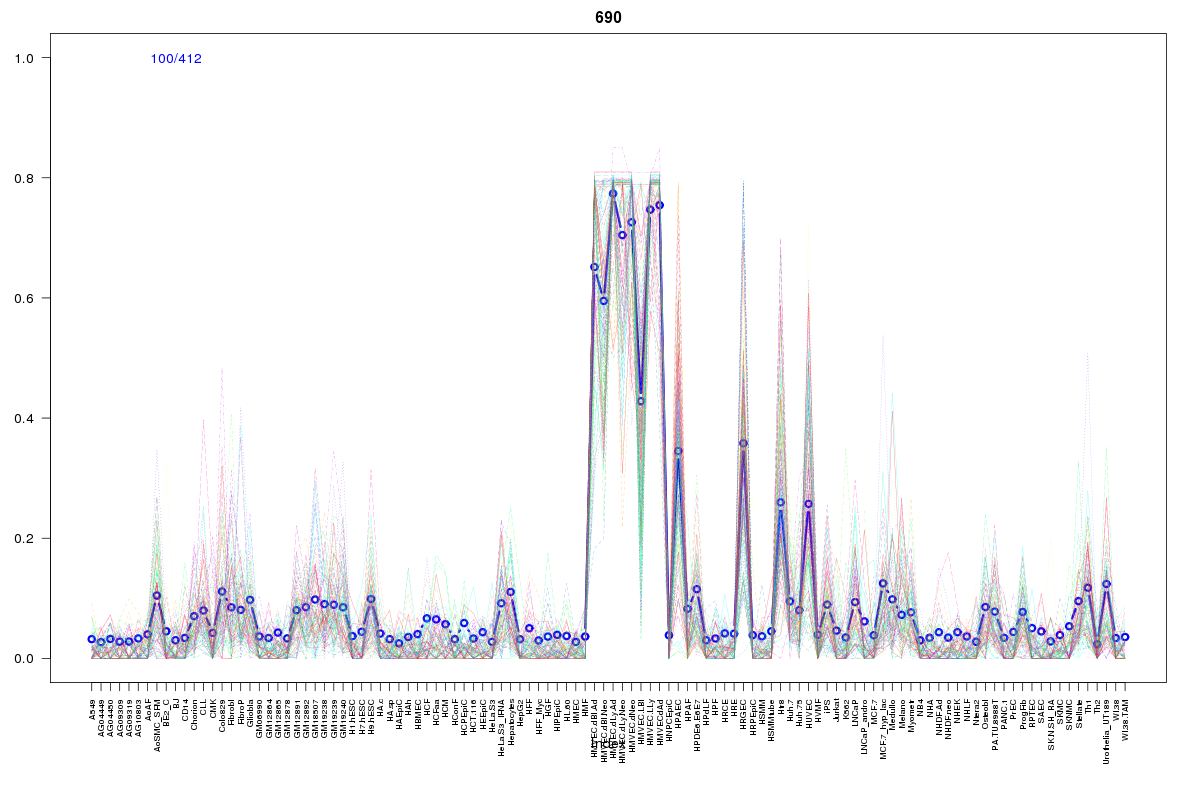 | 690 | 1 |
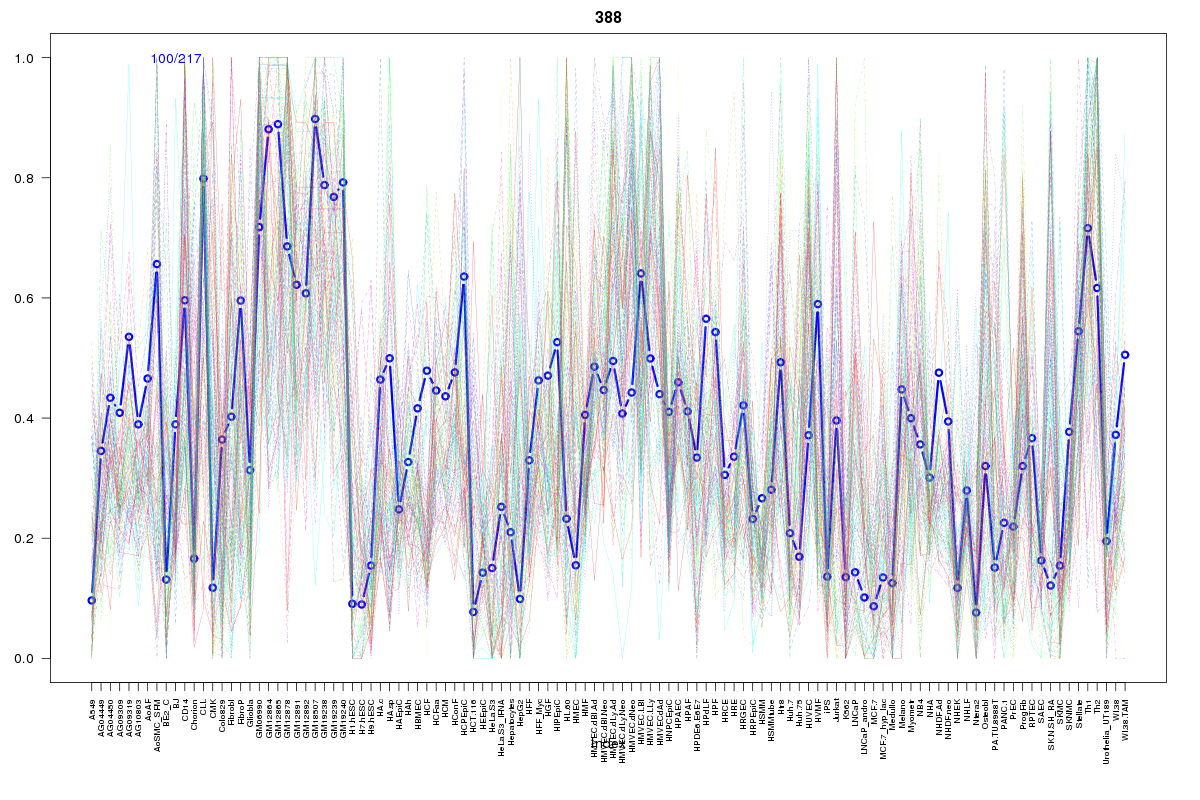 | 388 | 1 |
 | 272 | 1 |
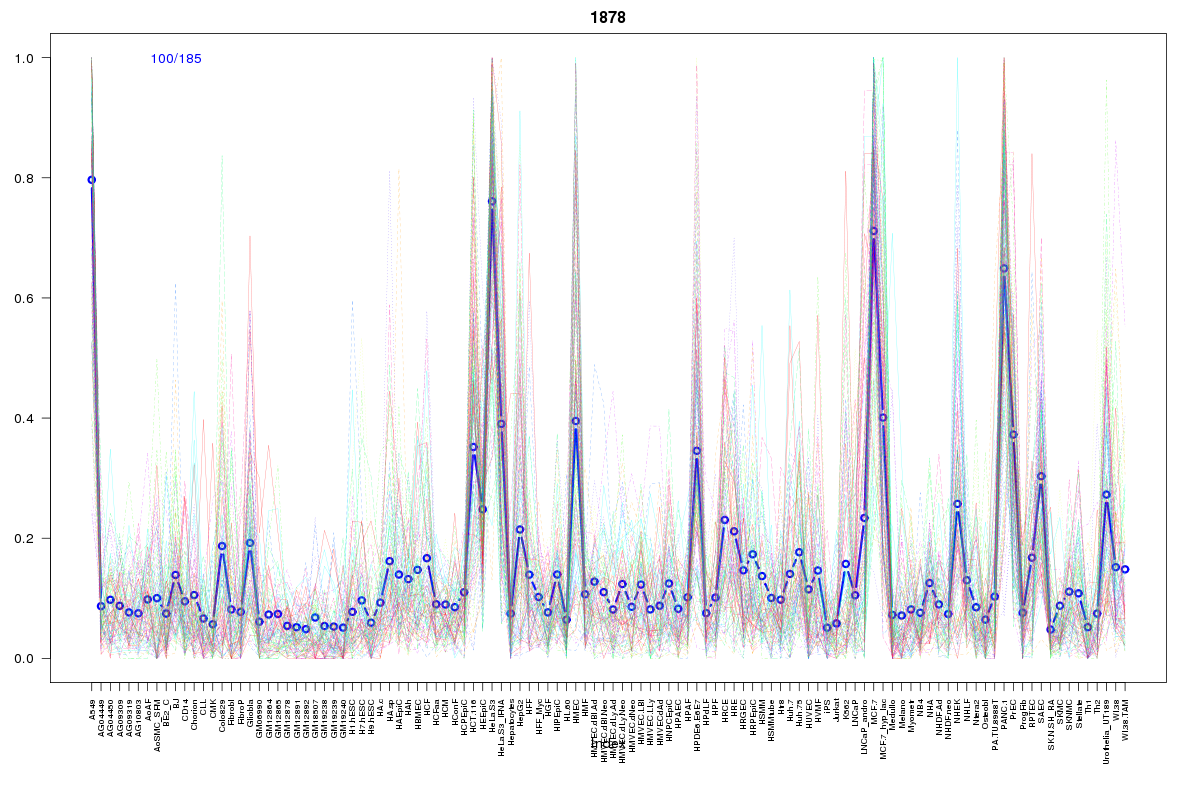 | 1878 | 1 |
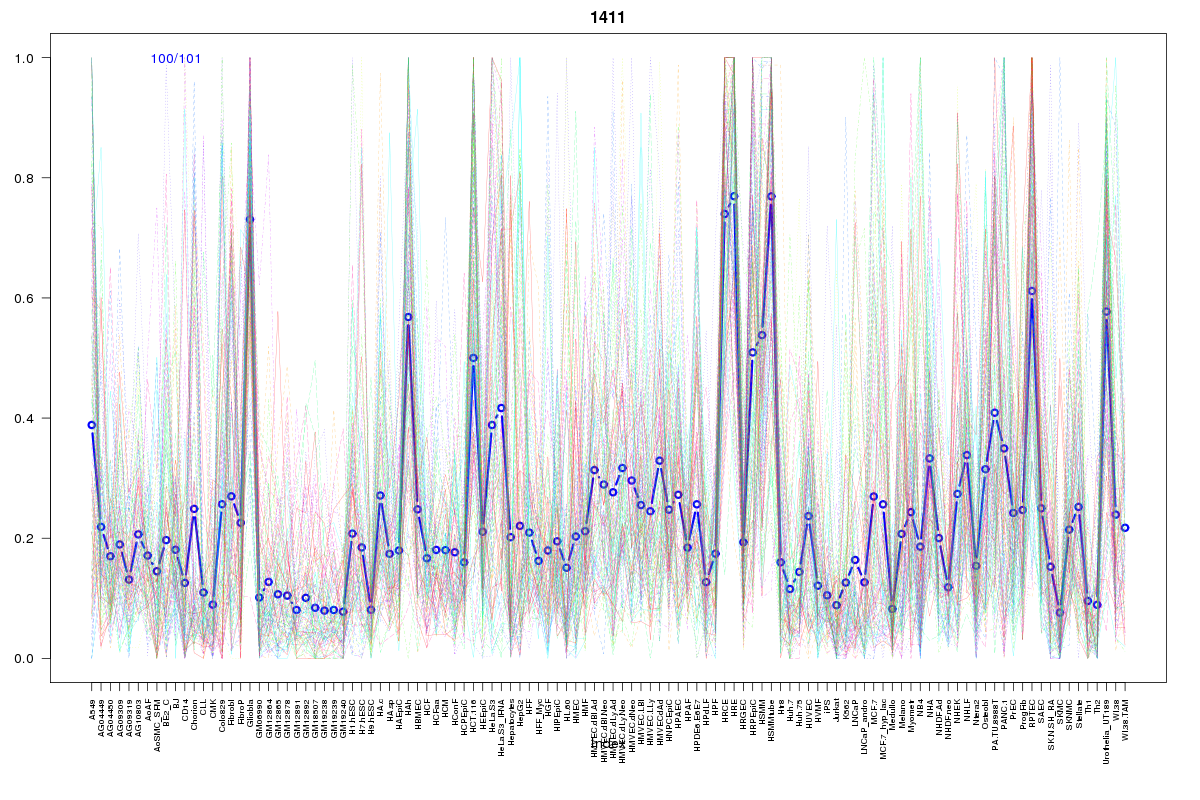 | 1411 | 1 |
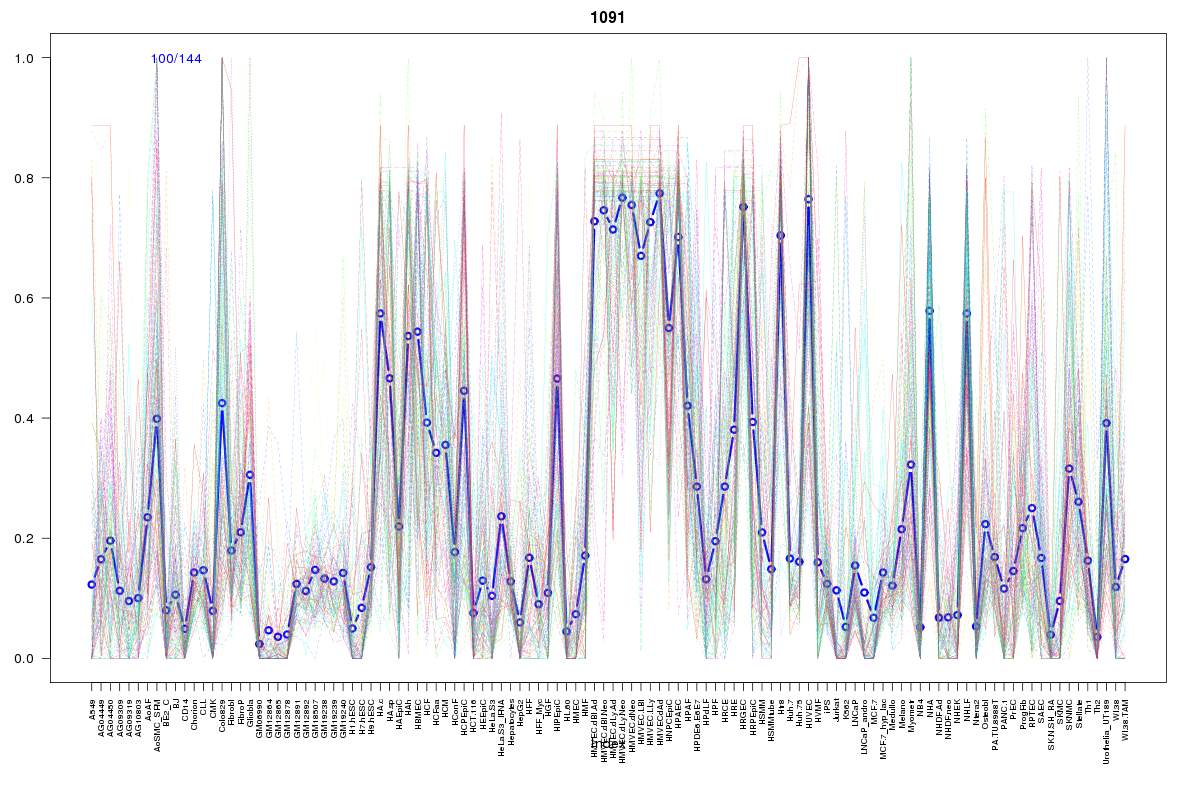 | 1091 | 1 |
 | 1075 | 1 |
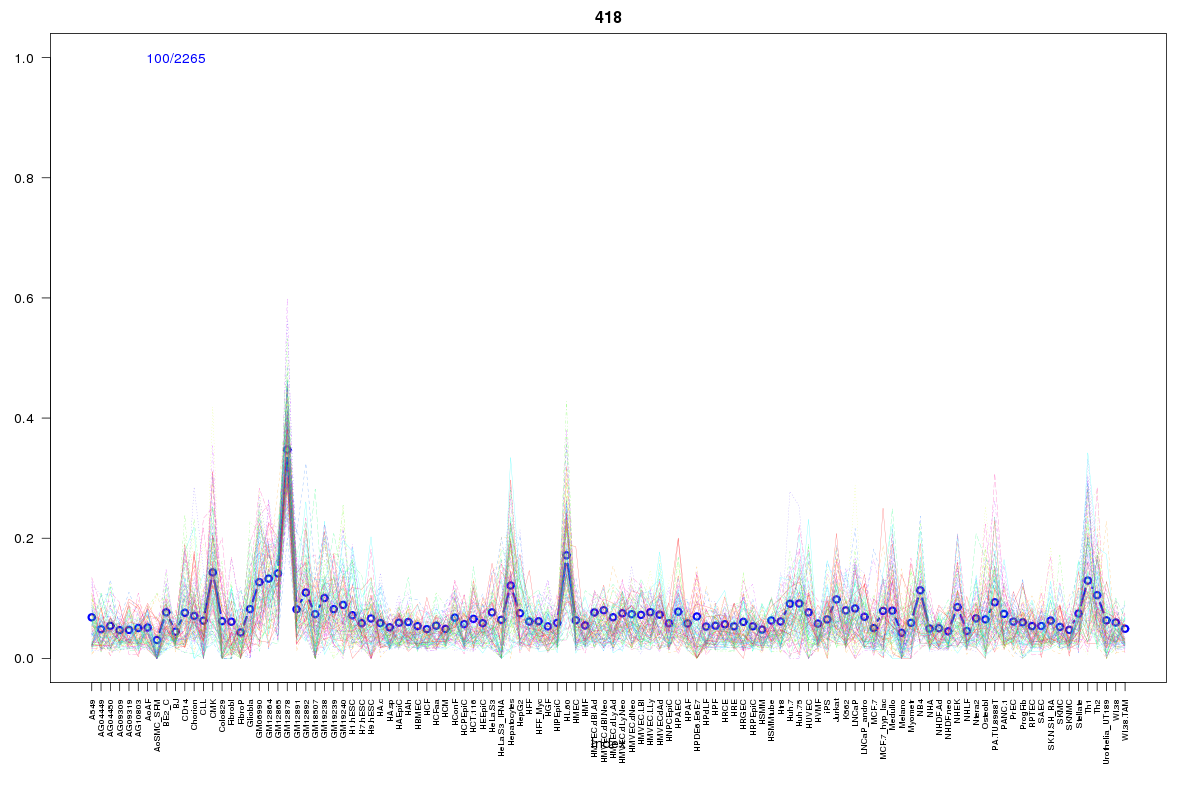 | 418 | 1 |
 | 934 | 1 |
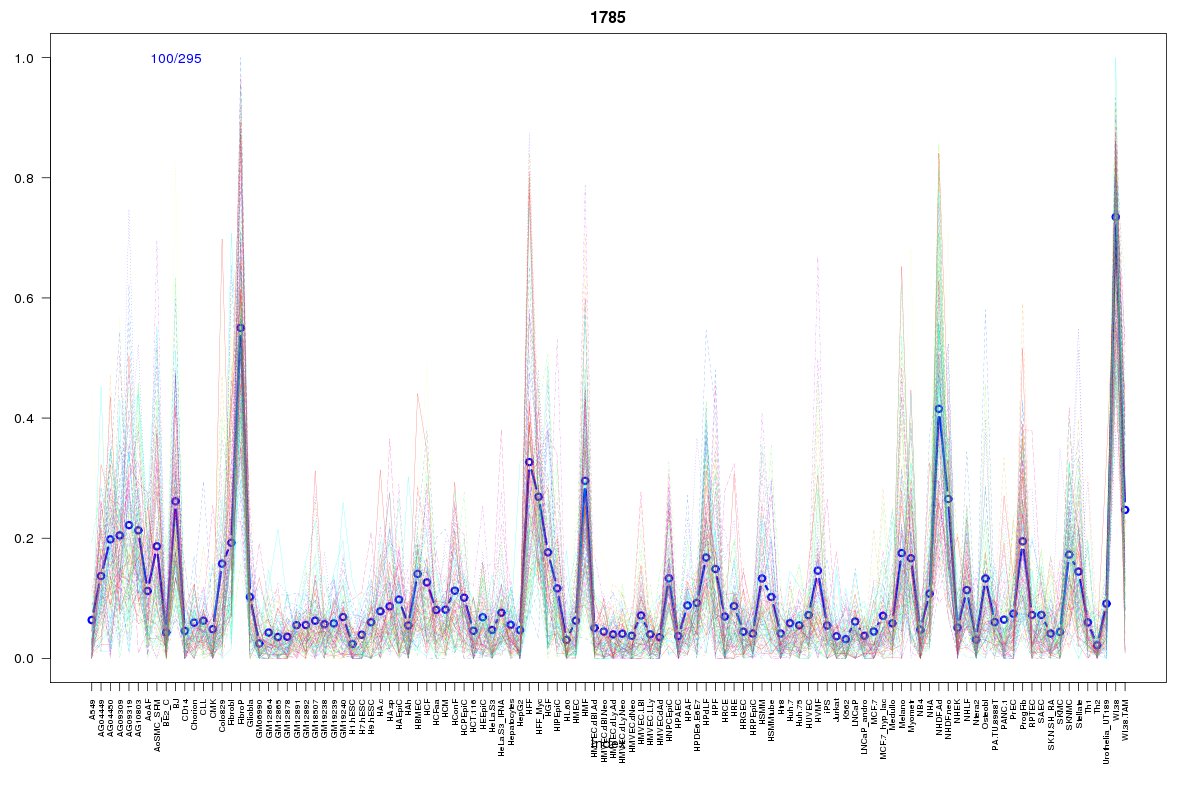 | 1785 | 1 |
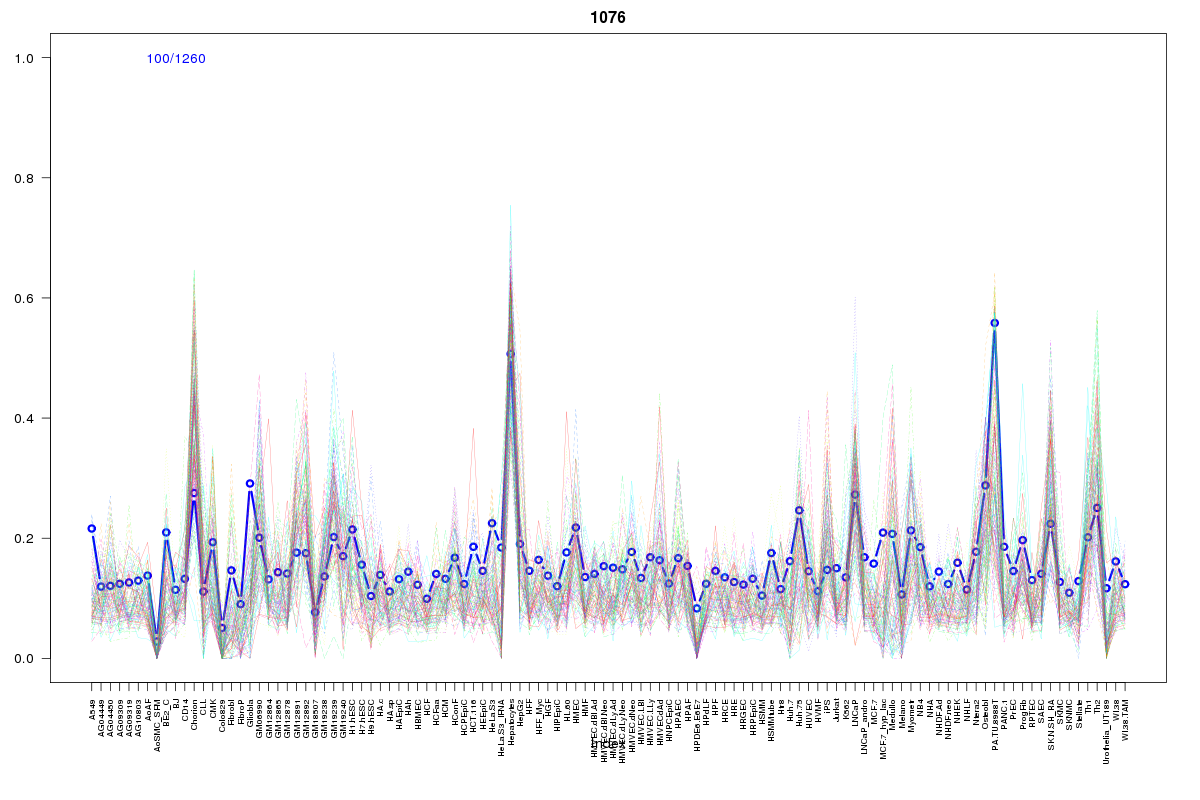 | 1076 | 1 |
Resources
BED file downloads
Connects to 214 DHS sitesTop 10 Correlated DHS Sites
p-values indiciate significant higher or lower correlationExternal Databases
UCSCEnsembl (ENSG00000105738)