Gene: KCTD9
chr8: 25285365-25315983Expression Profile
(log scale)
Graphical Connections
Distribution of linked clusters:
You may find it interesting if many of the connected DHS sites belong to the same cluster.| Cluster Profile | Cluster ID | Number of DHS sites in this cluster |
|---|---|---|
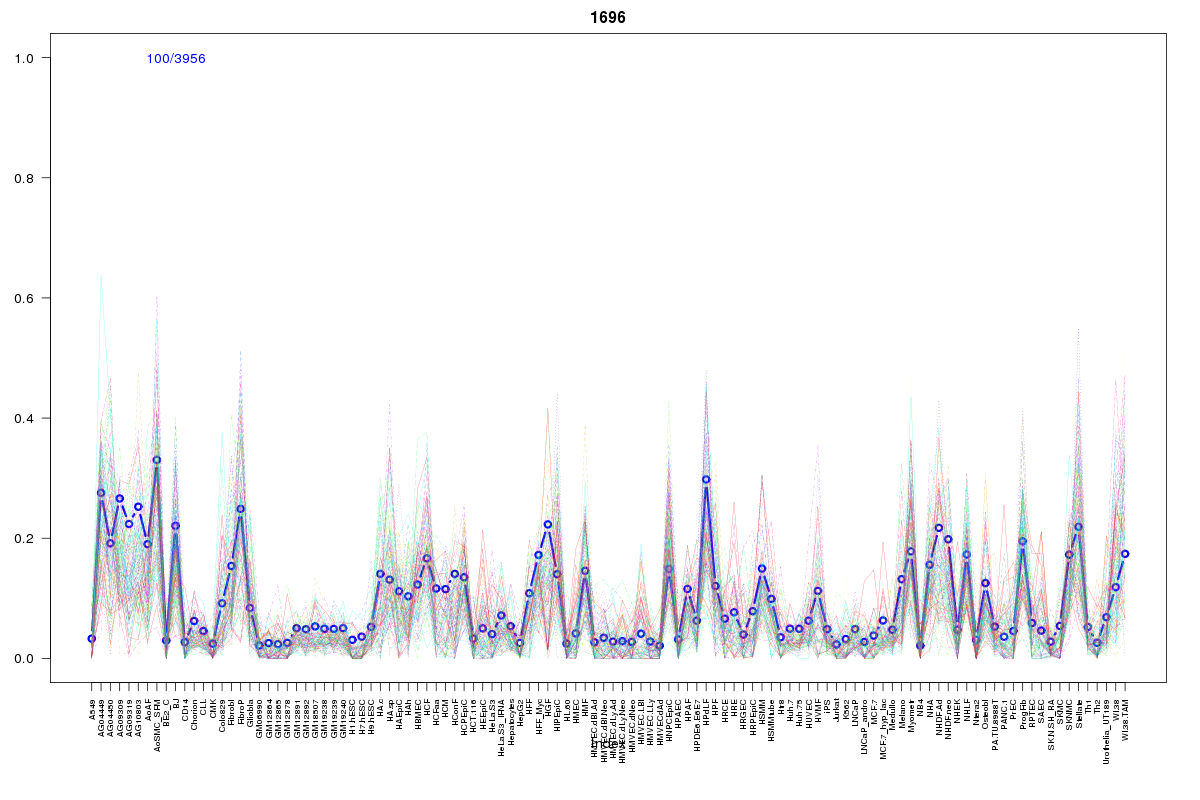 | 1696 | 2 |
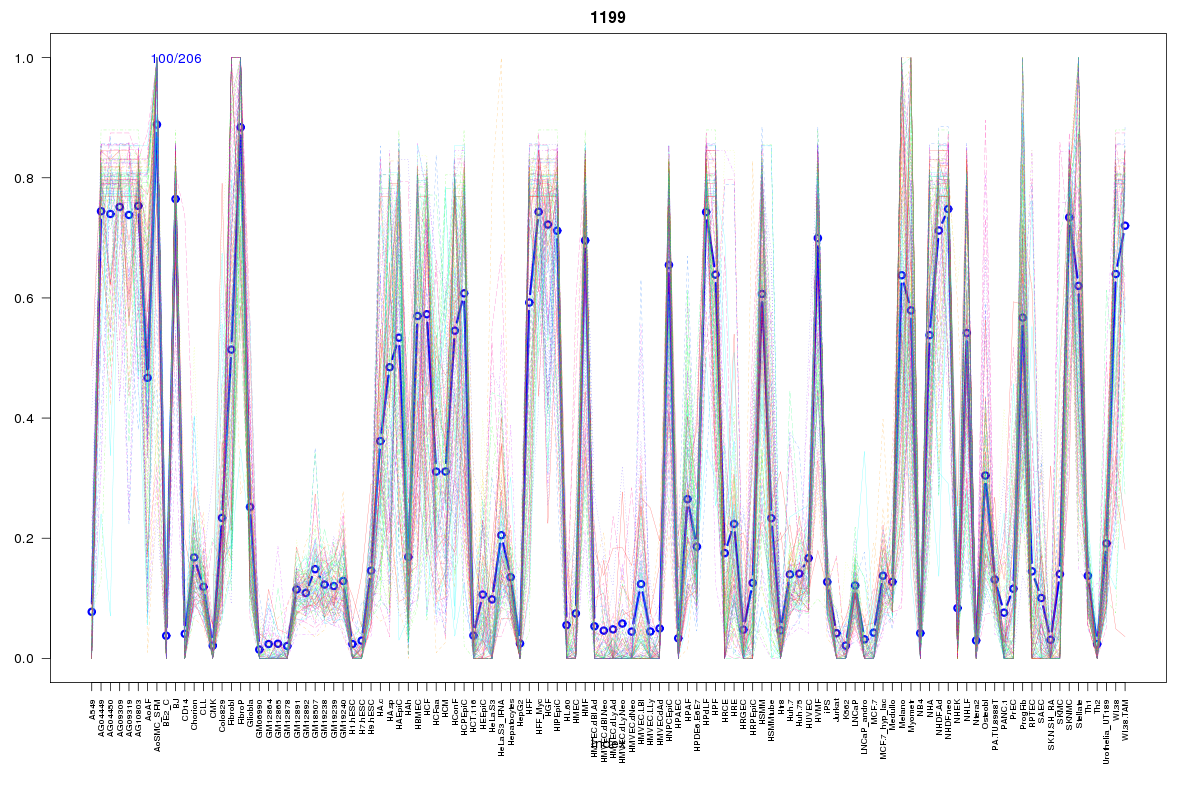 | 1199 | 1 |
 | 1701 | 1 |
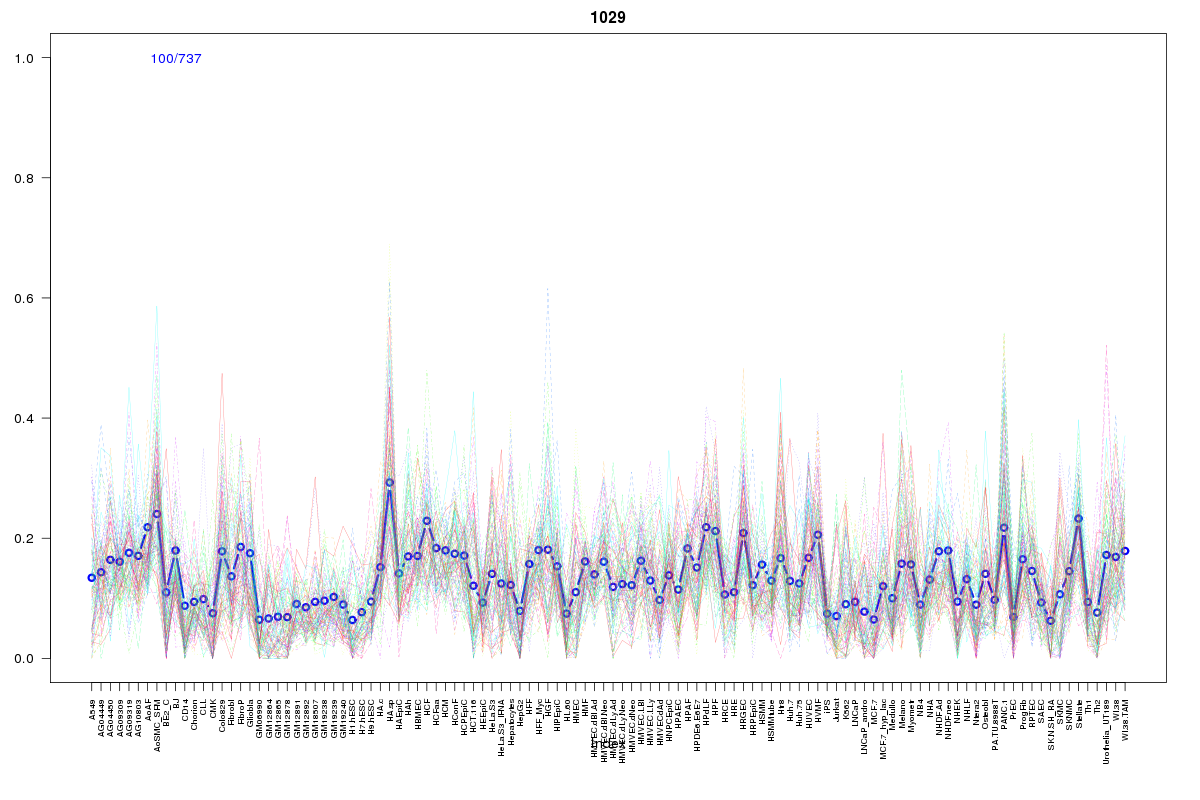 | 1029 | 1 |
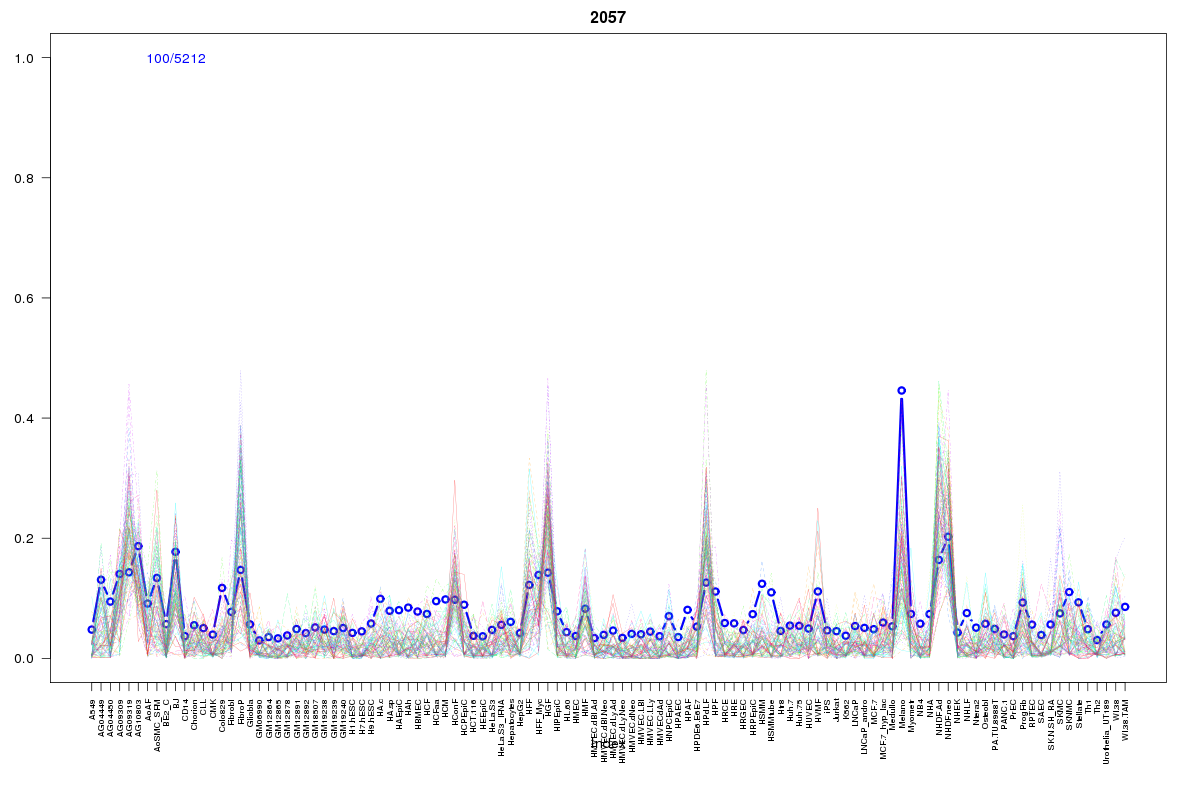 | 2057 | 1 |
 | 2223 | 1 |
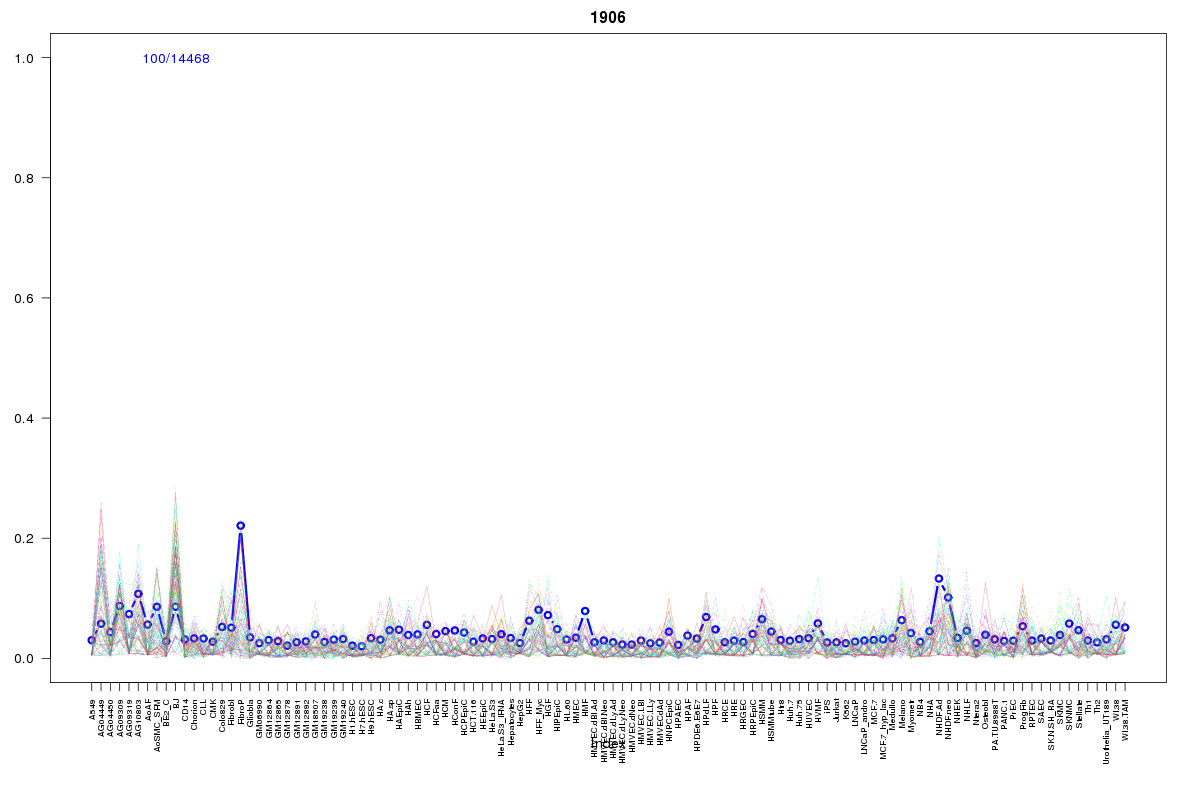 | 1906 | 1 |
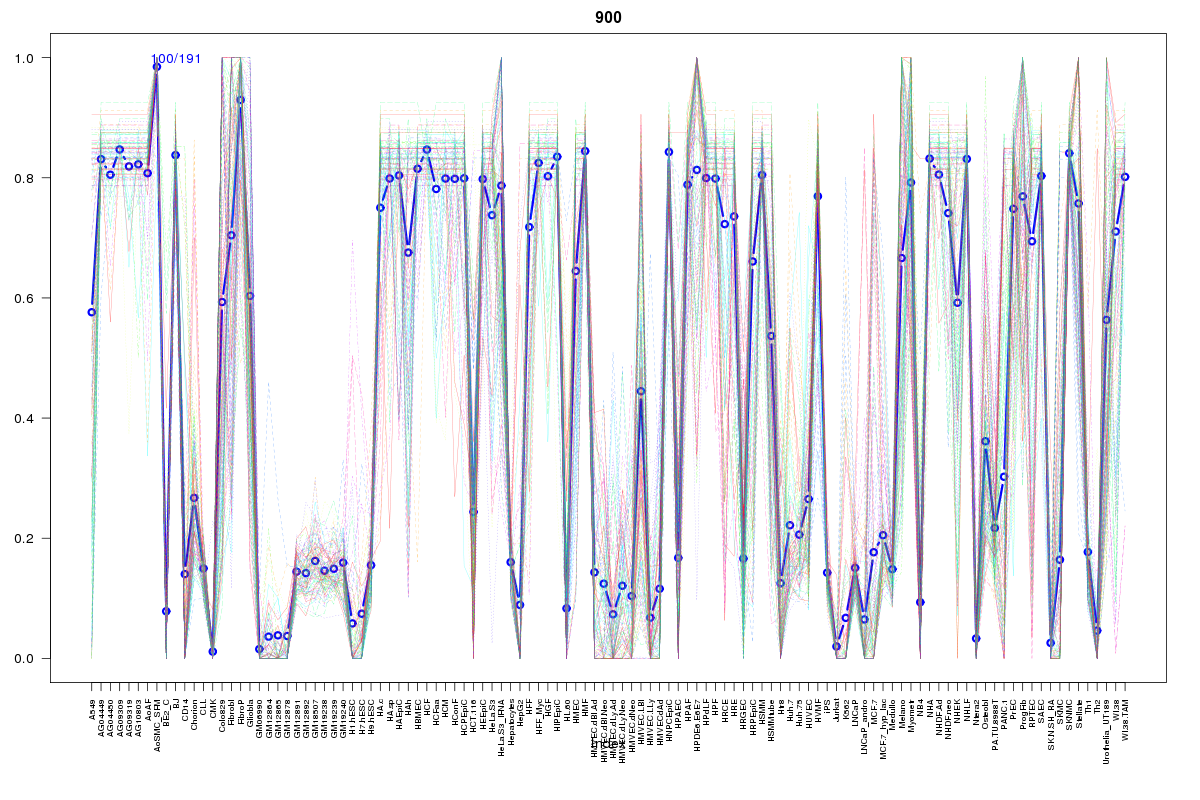 | 900 | 1 |
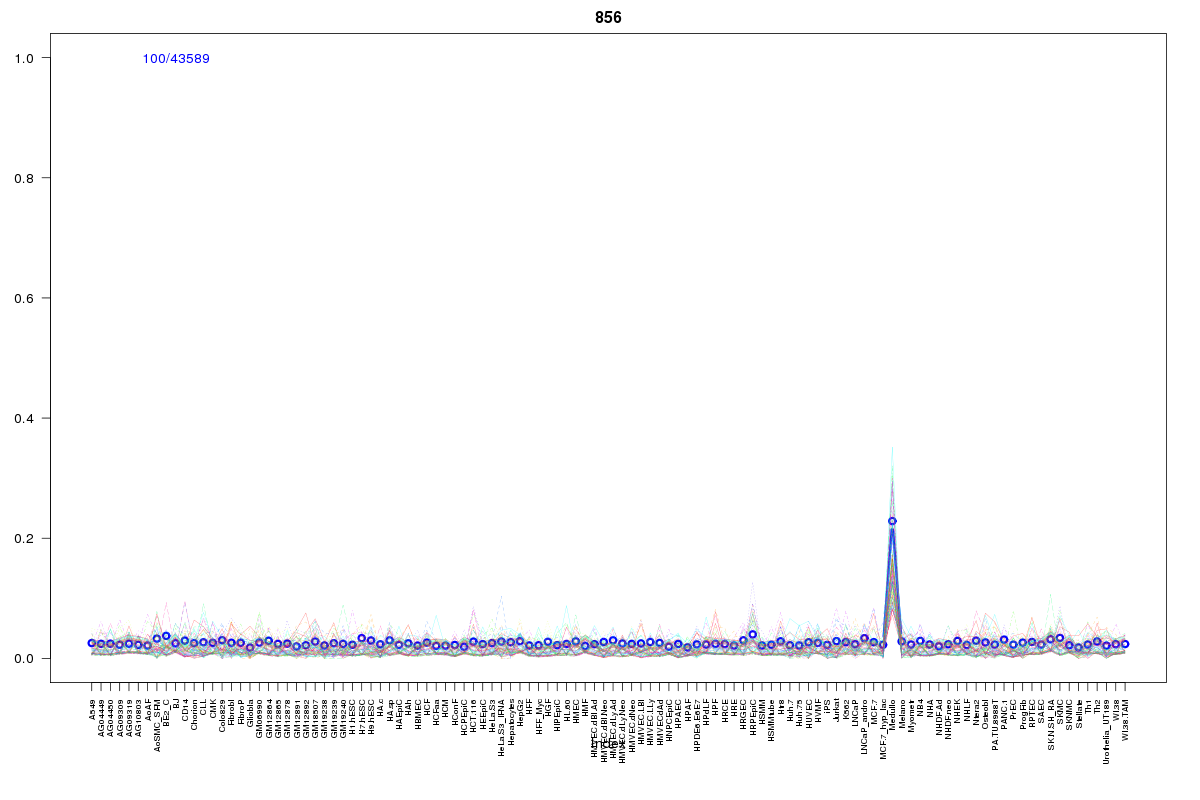 | 856 | 1 |
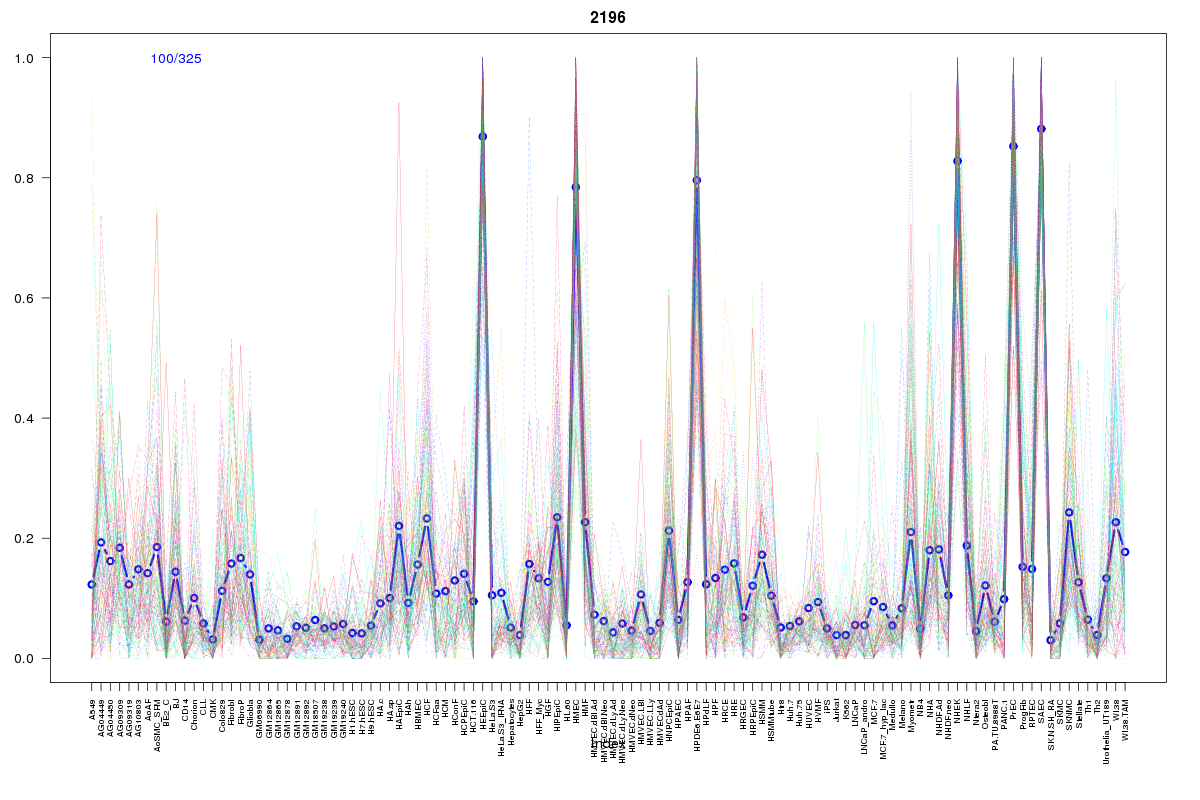 | 2196 | 1 |
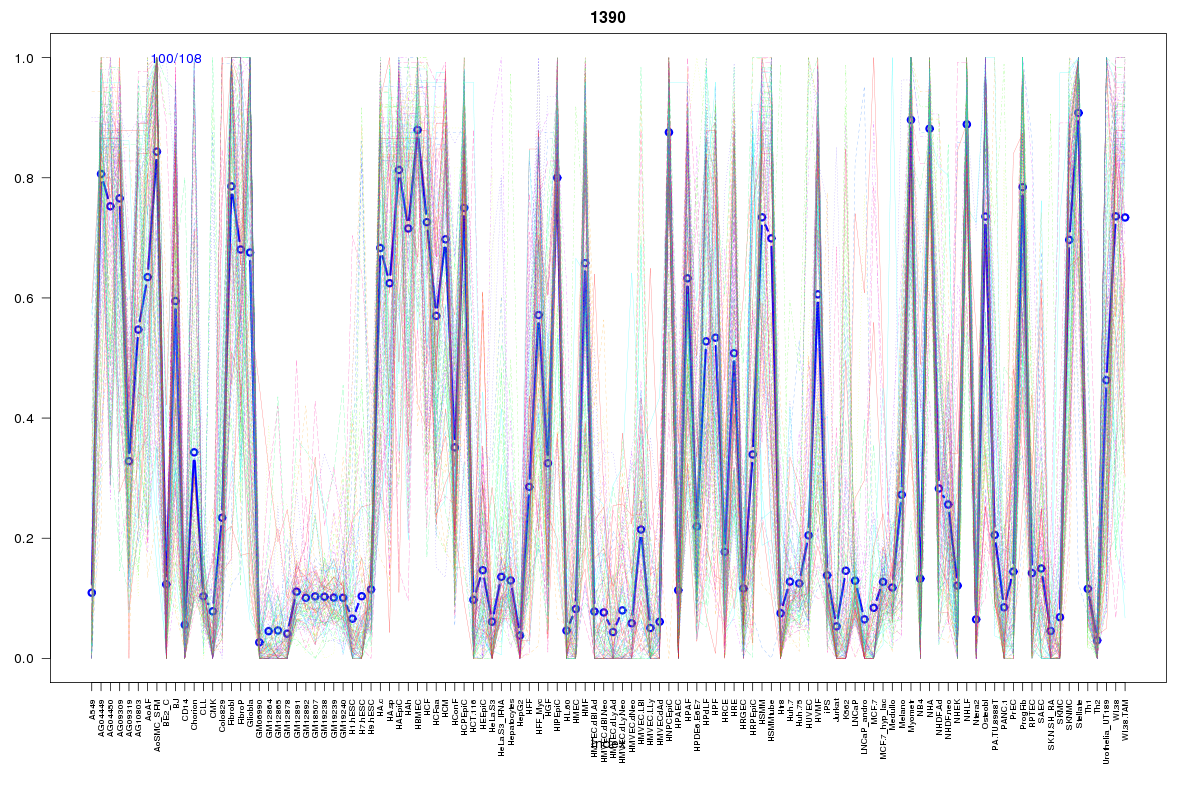 | 1390 | 1 |
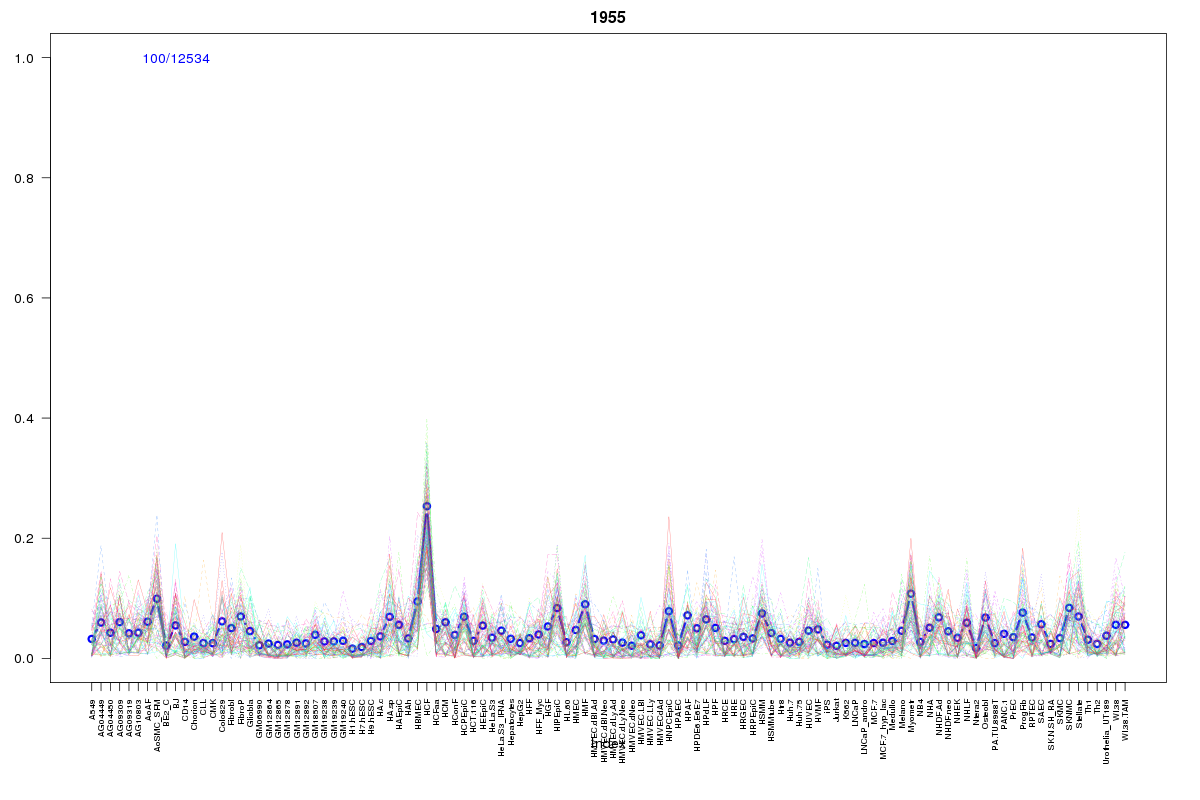 | 1955 | 1 |
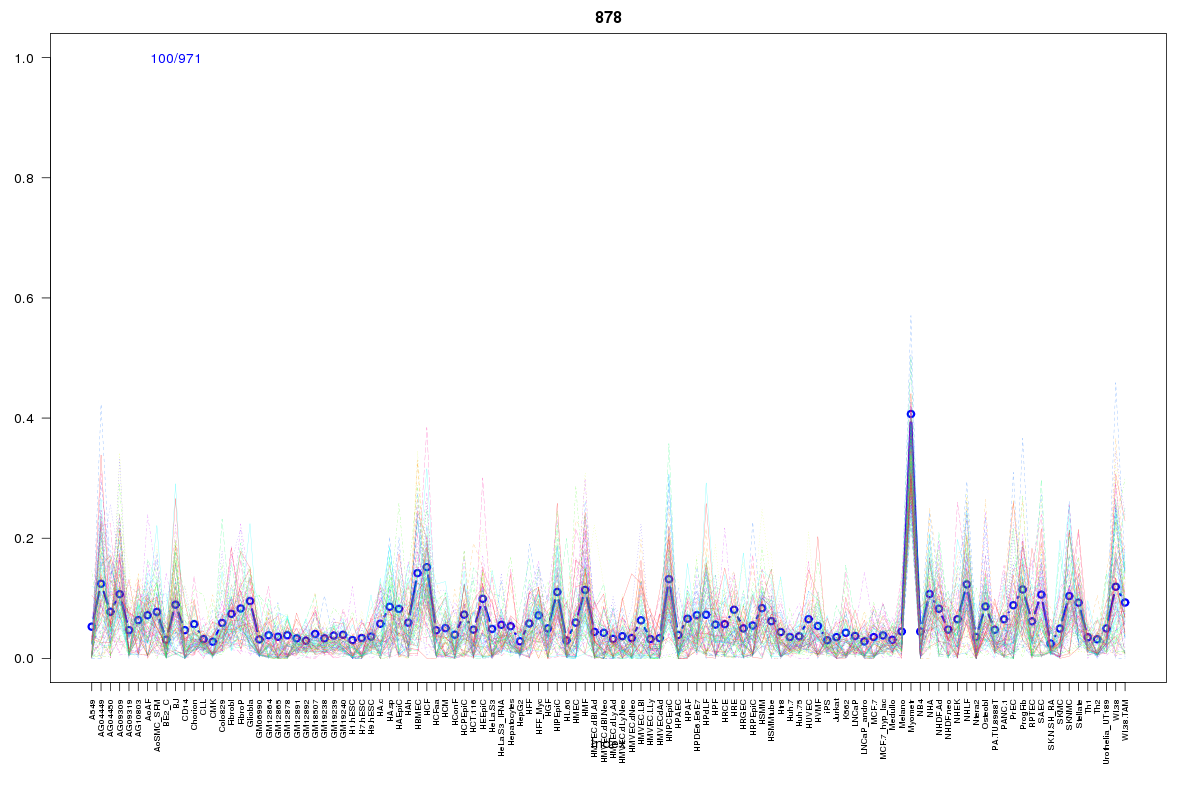 | 878 | 1 |
 | 1890 | 1 |
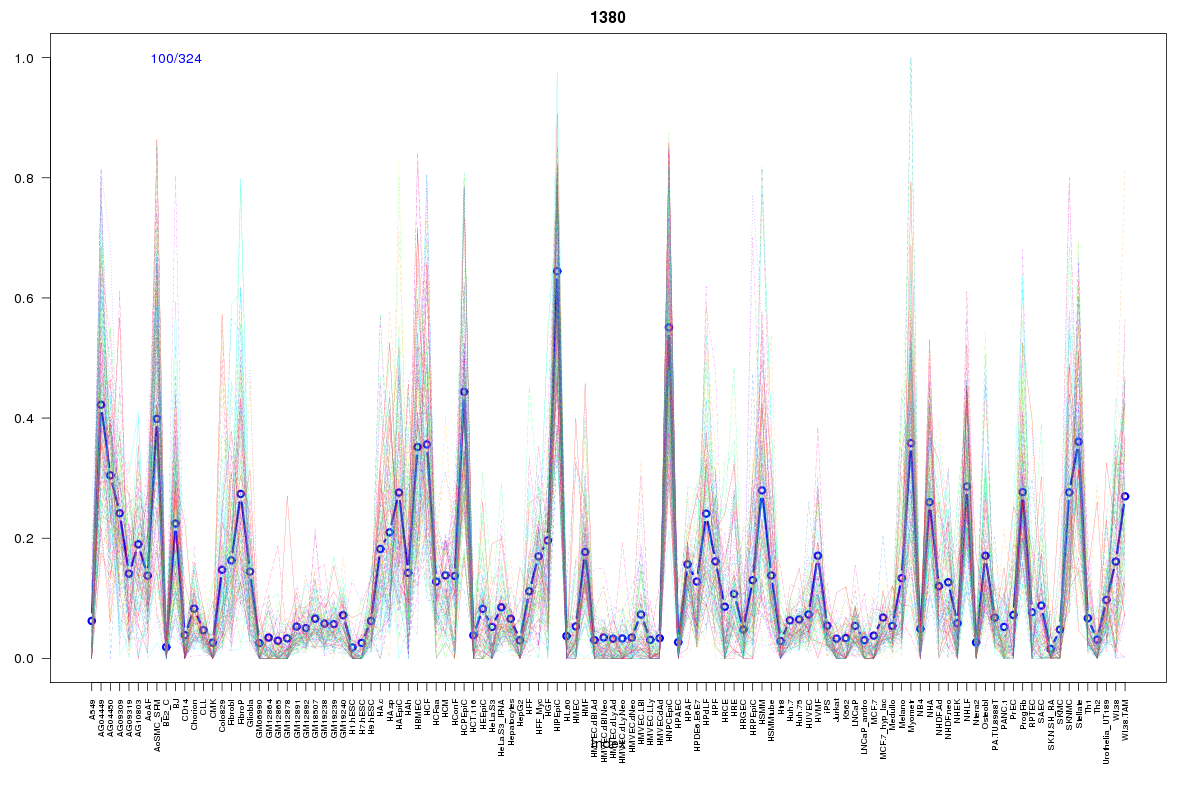 | 1380 | 1 |
Resources
BED file downloads
Connects to 16 DHS sitesTop 10 Correlated DHS Sites
p-values indiciate significant higher or lower correlation| Location | Cluster | P-value |
|---|---|---|
| chr8:25337000-25337150 | 900 | 0 |
| chr8:25312240-25312390 | 1199 | 0 |
| chr8:25270740-25270890 | 1955 | 0.002 |
| chr8:25331120-25331270 | 2057 | 0.002 |
| chr8:25336560-25336710 | 1696 | 0.003 |
| chr8:25314865-25315015 | 1029 | 0.004 |
| chr8:25337420-25337570 | 1696 | 0.004 |
| chr8:25331380-25331530 | 2223 | 0.005 |
| chr8:25272965-25273115 | 878 | 0.006 |
| chr8:25296060-25296210 | 1380 | 0.009 |
| chr8:25334560-25334710 | 1906 | 0.013 |
External Databases
UCSCEnsembl (ENSG00000104756)