Gene: HTR2A
chr13: 47405684-47470173Expression Profile
(log scale)
Graphical Connections
Distribution of linked clusters:
You may find it interesting if many of the connected DHS sites belong to the same cluster.| Cluster Profile | Cluster ID | Number of DHS sites in this cluster |
|---|---|---|
 | 1820 | 4 |
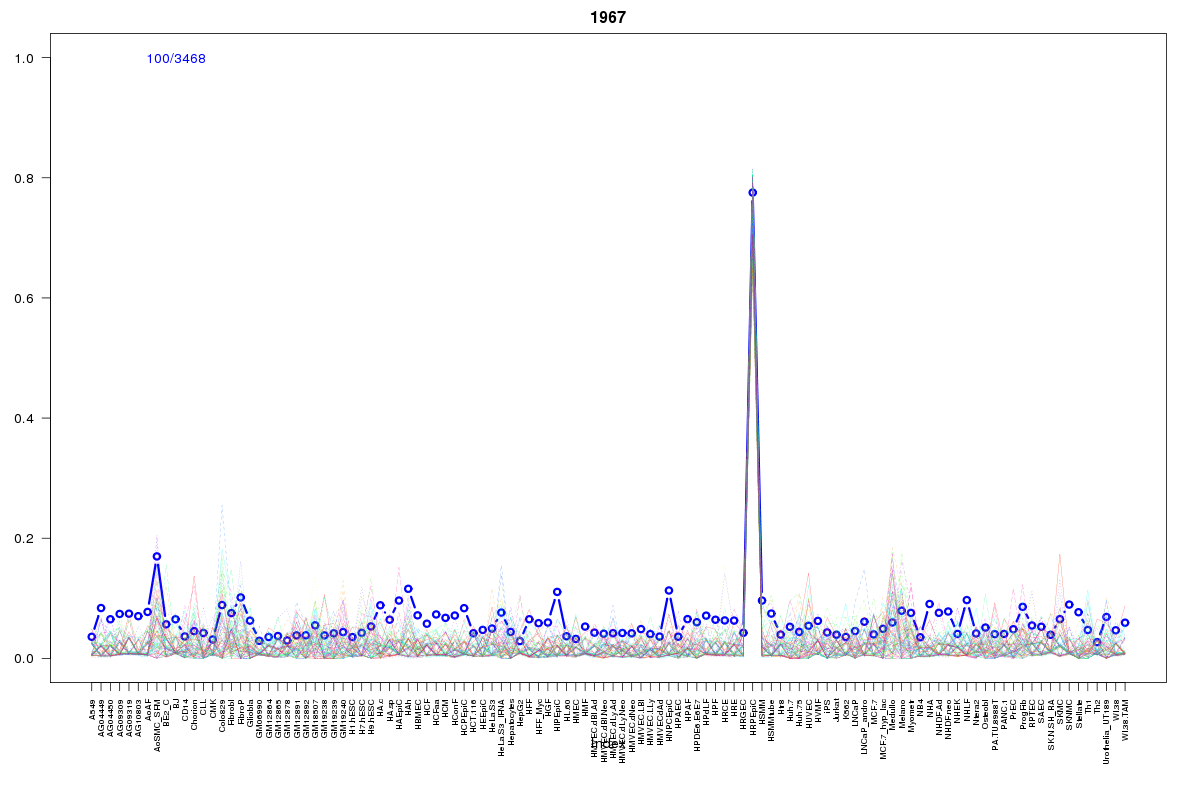 | 1967 | 3 |
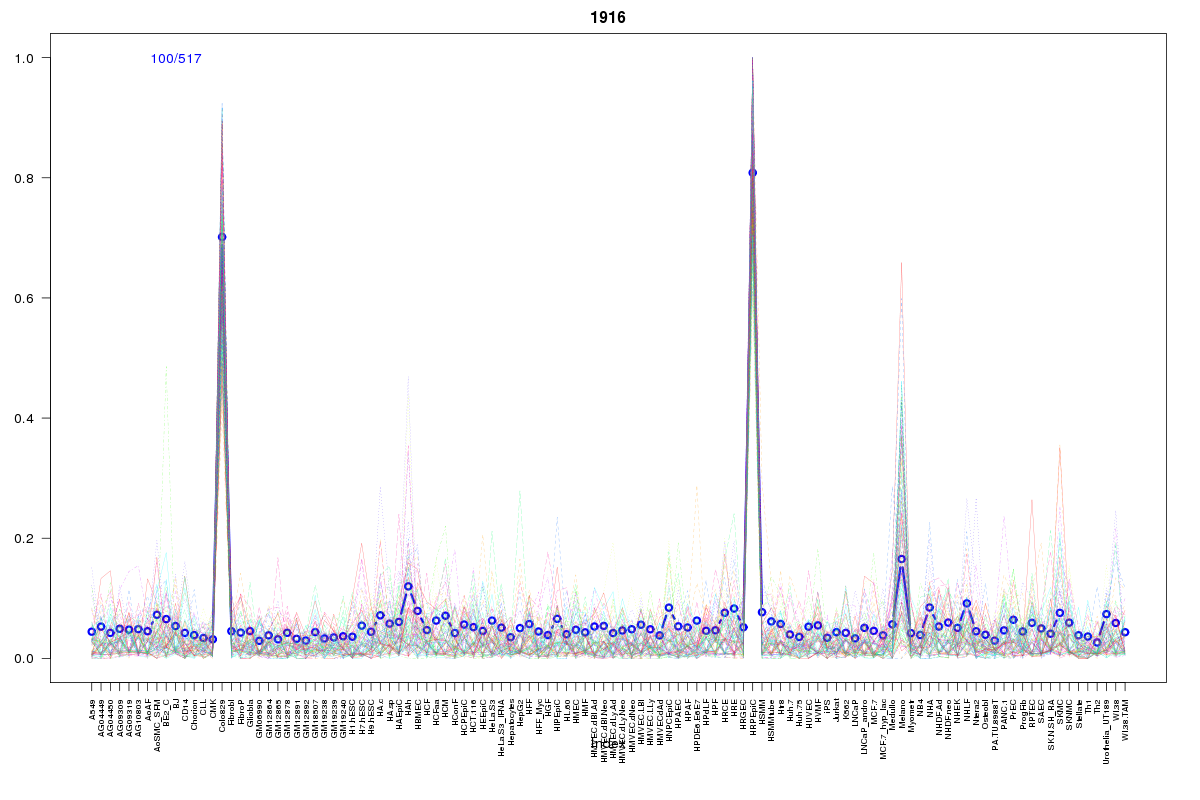 | 1916 | 2 |
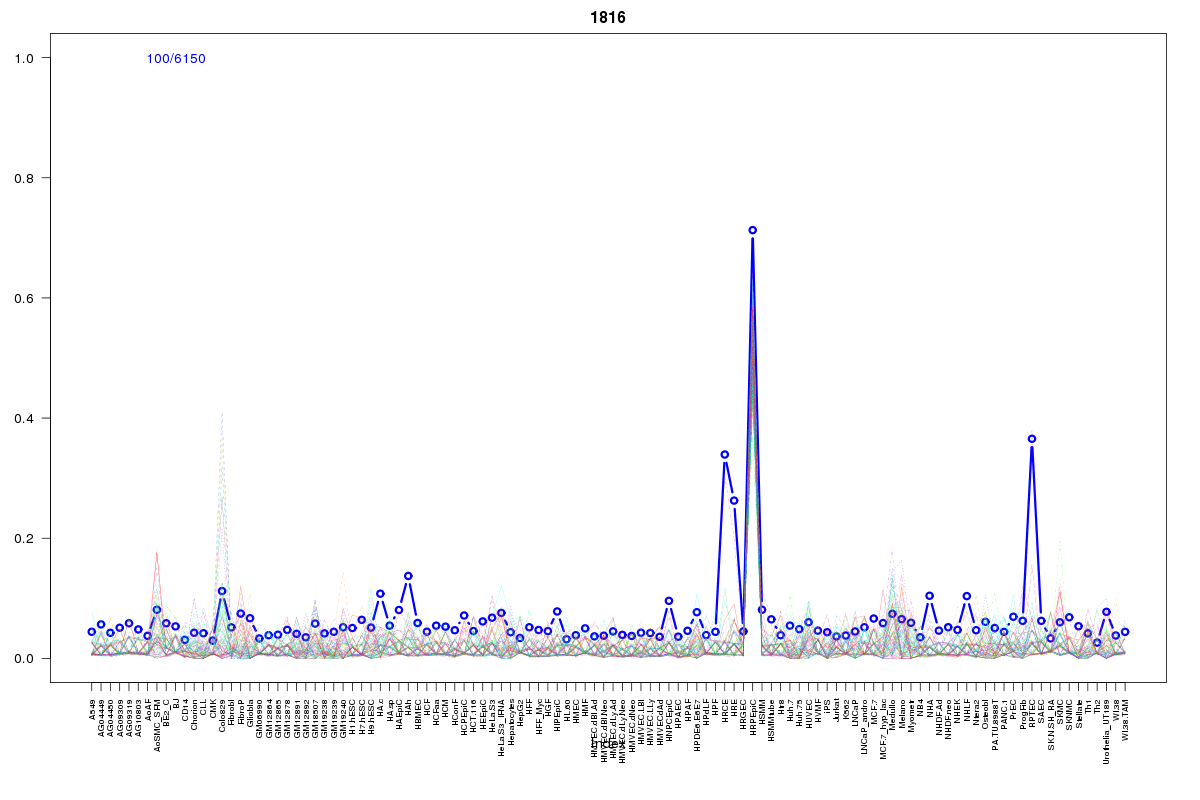 | 1816 | 2 |
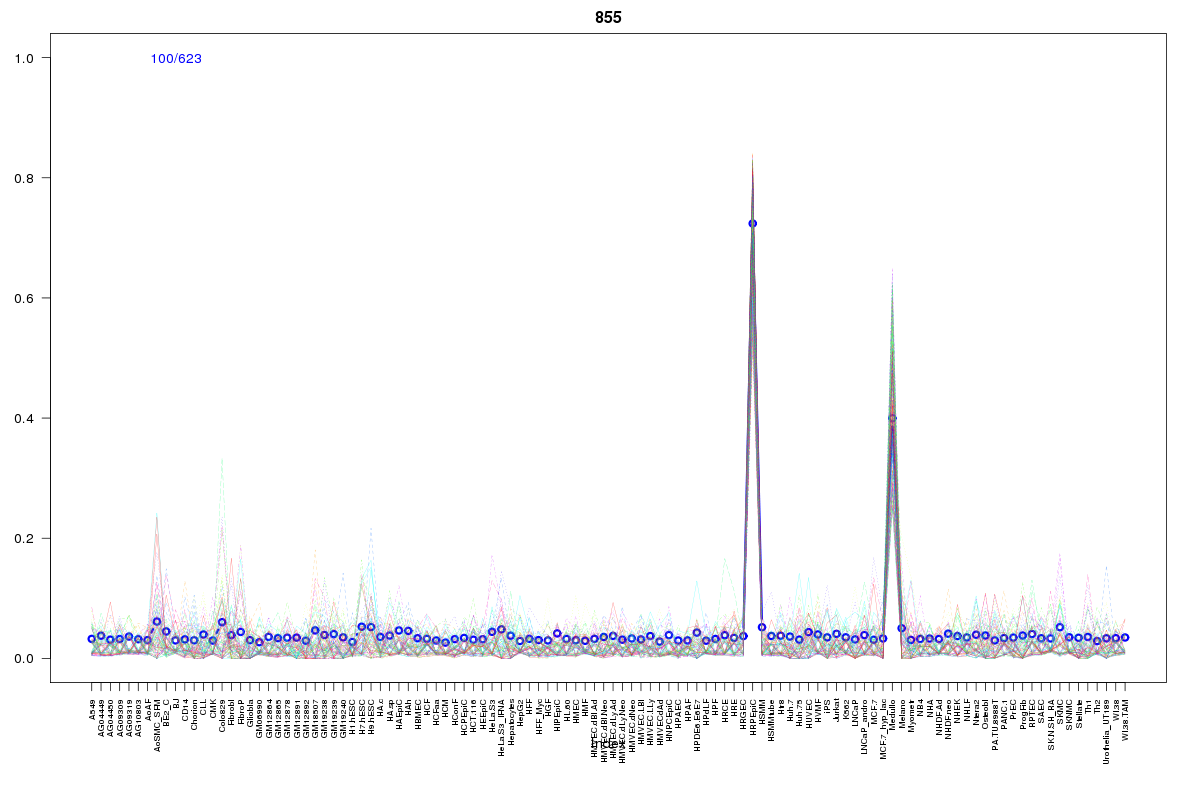 | 855 | 1 |
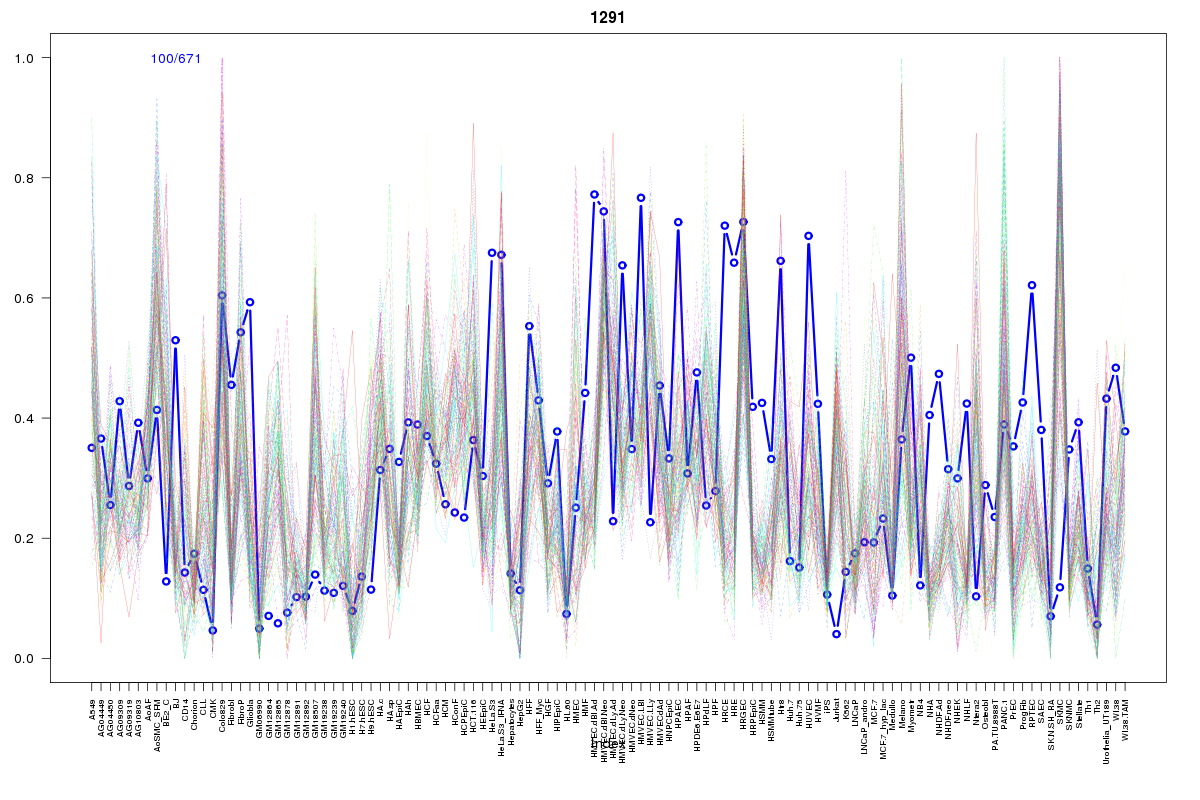 | 1291 | 1 |
 | 1151 | 1 |
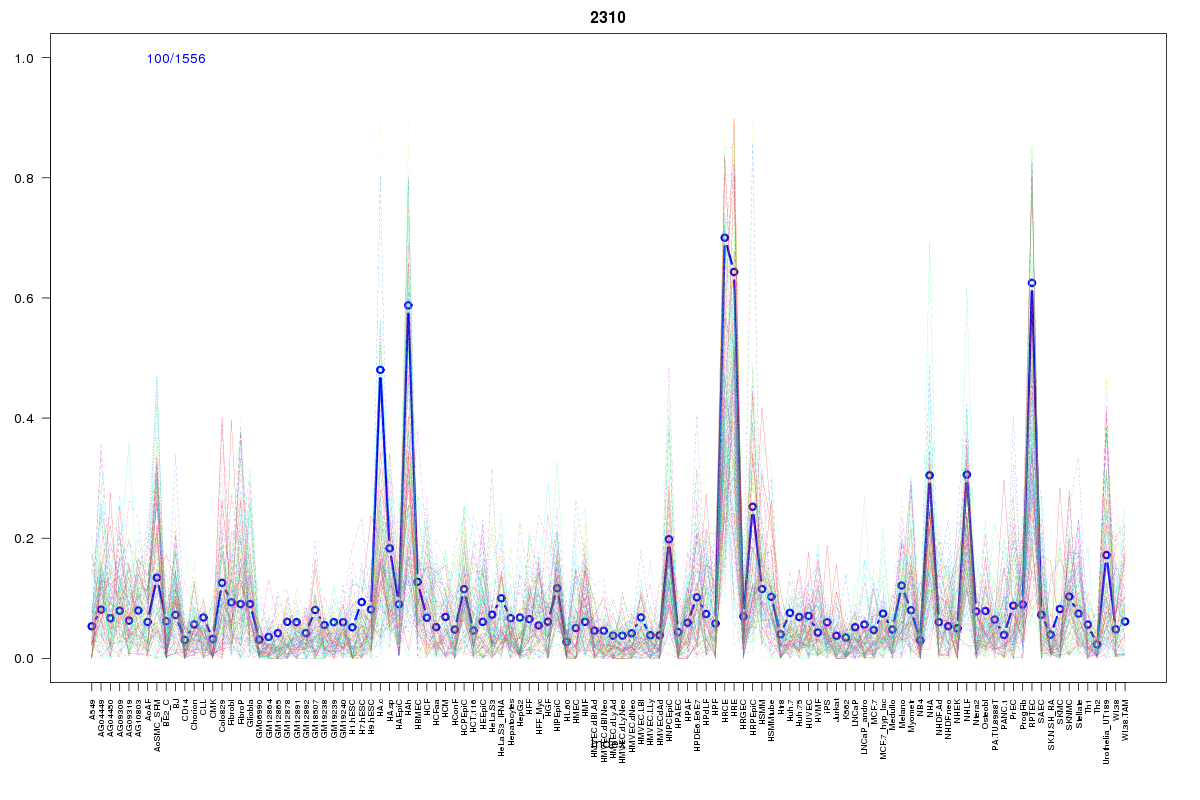 | 2310 | 1 |
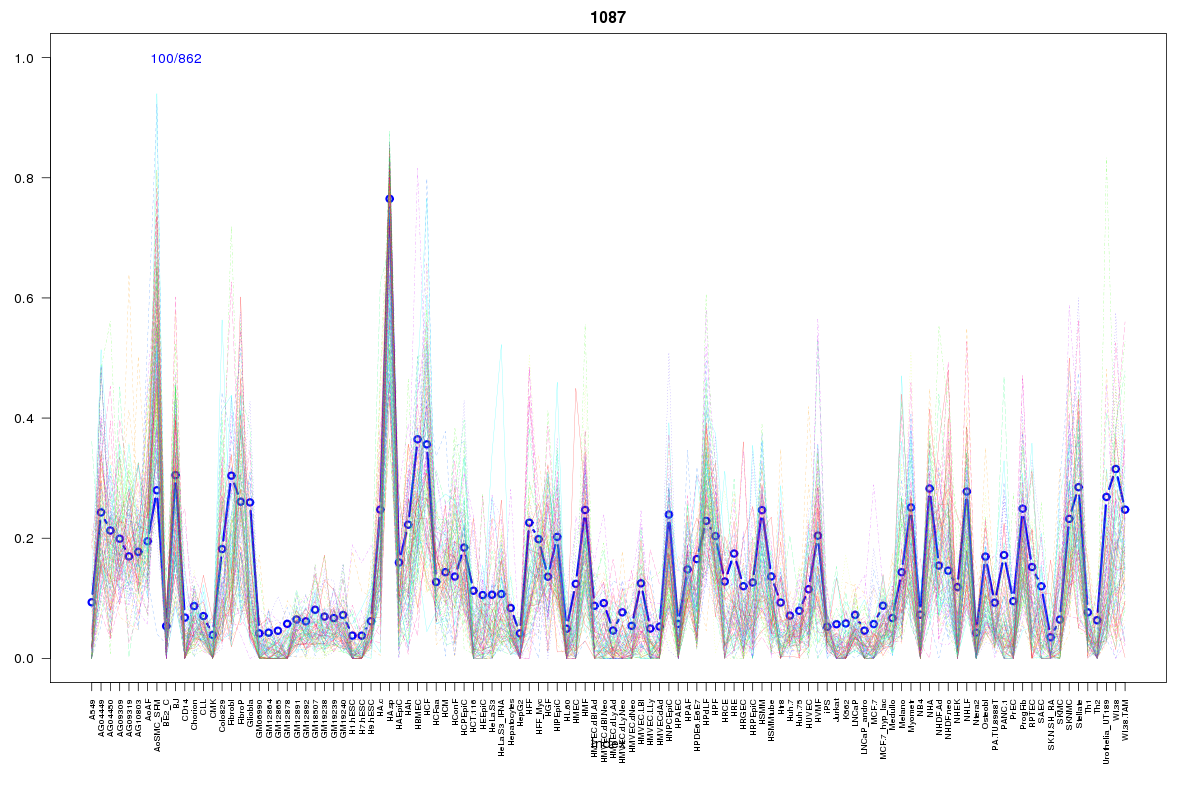 | 1087 | 1 |
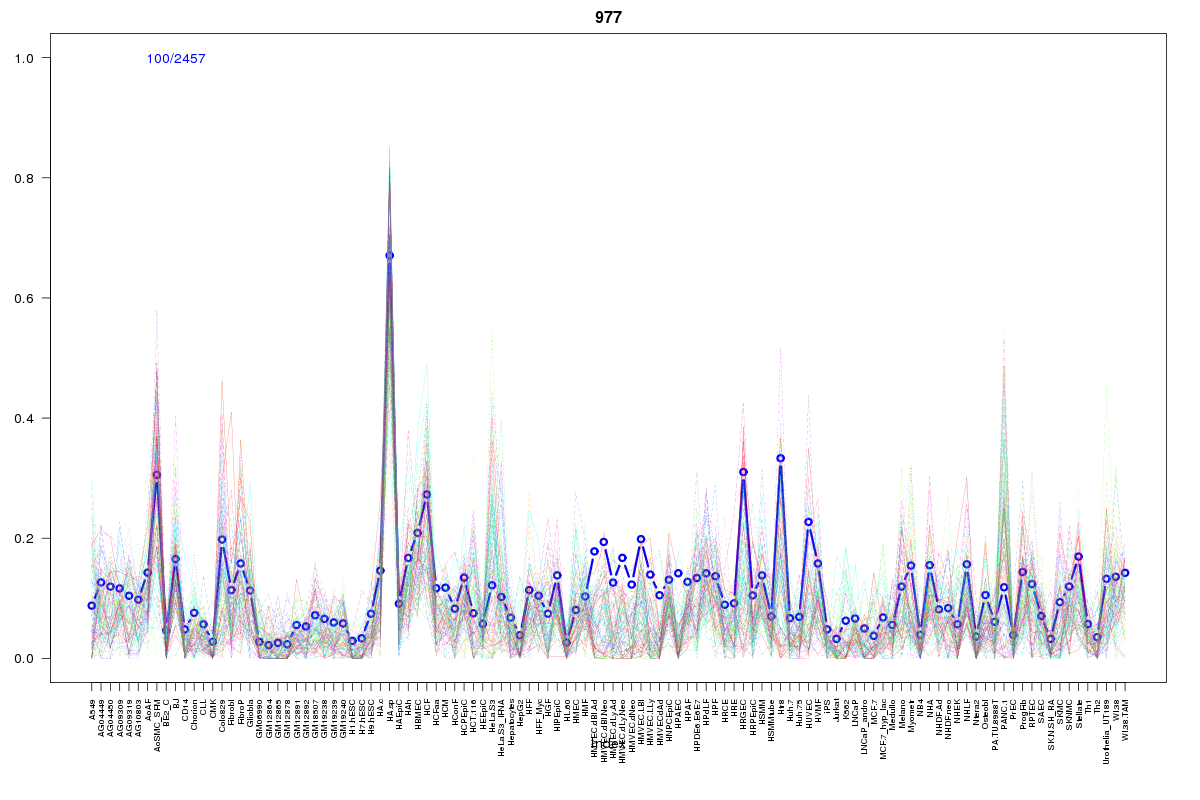 | 977 | 1 |
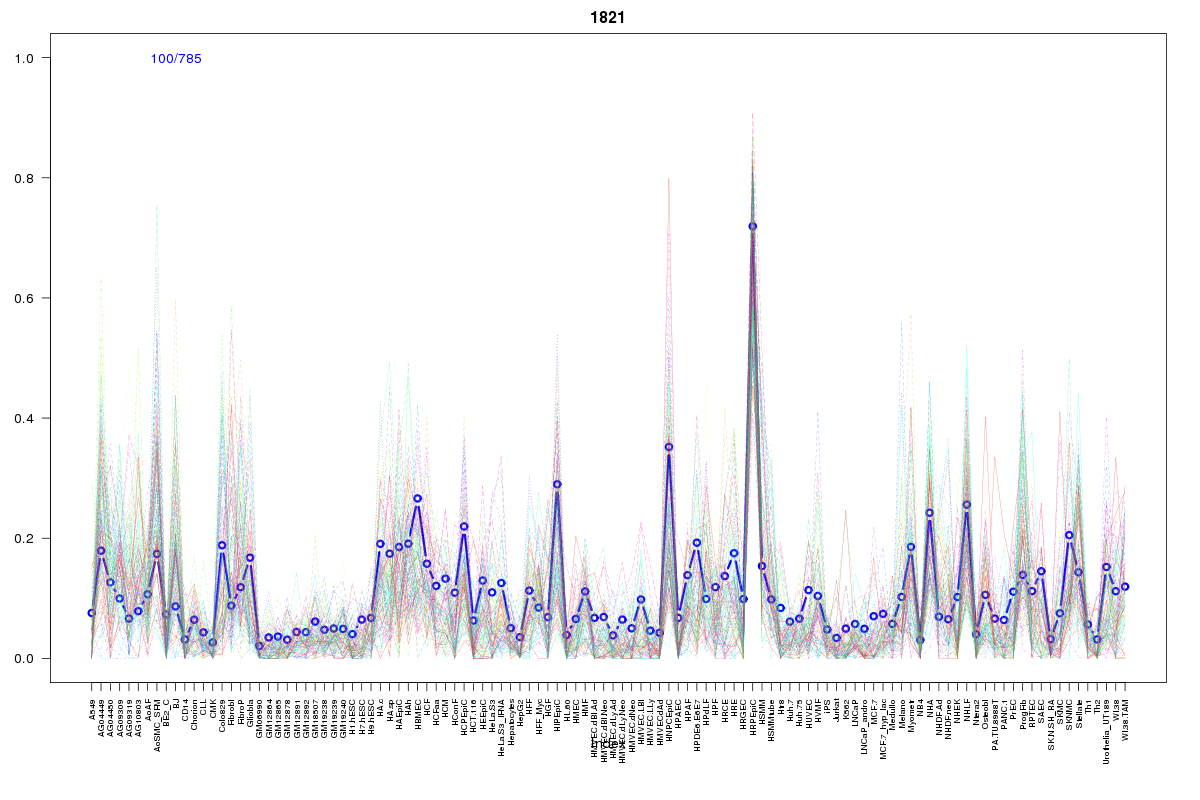 | 1821 | 1 |
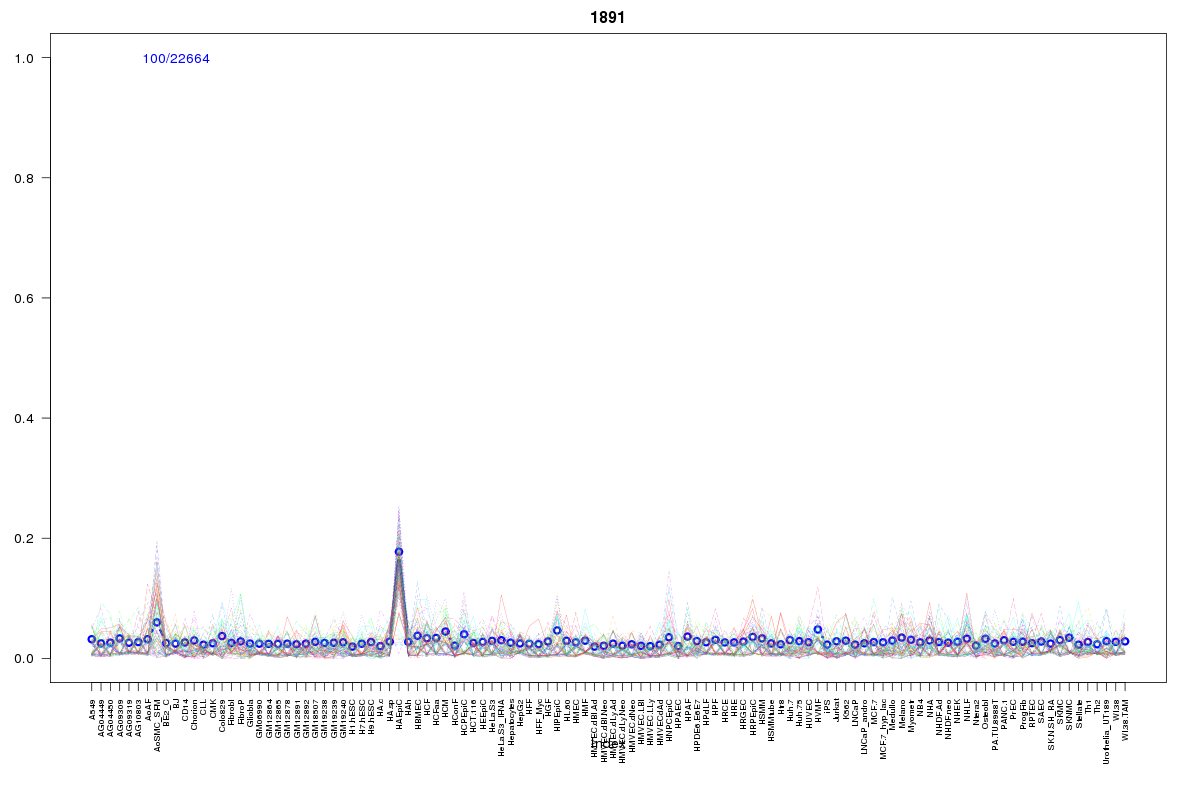 | 1891 | 1 |
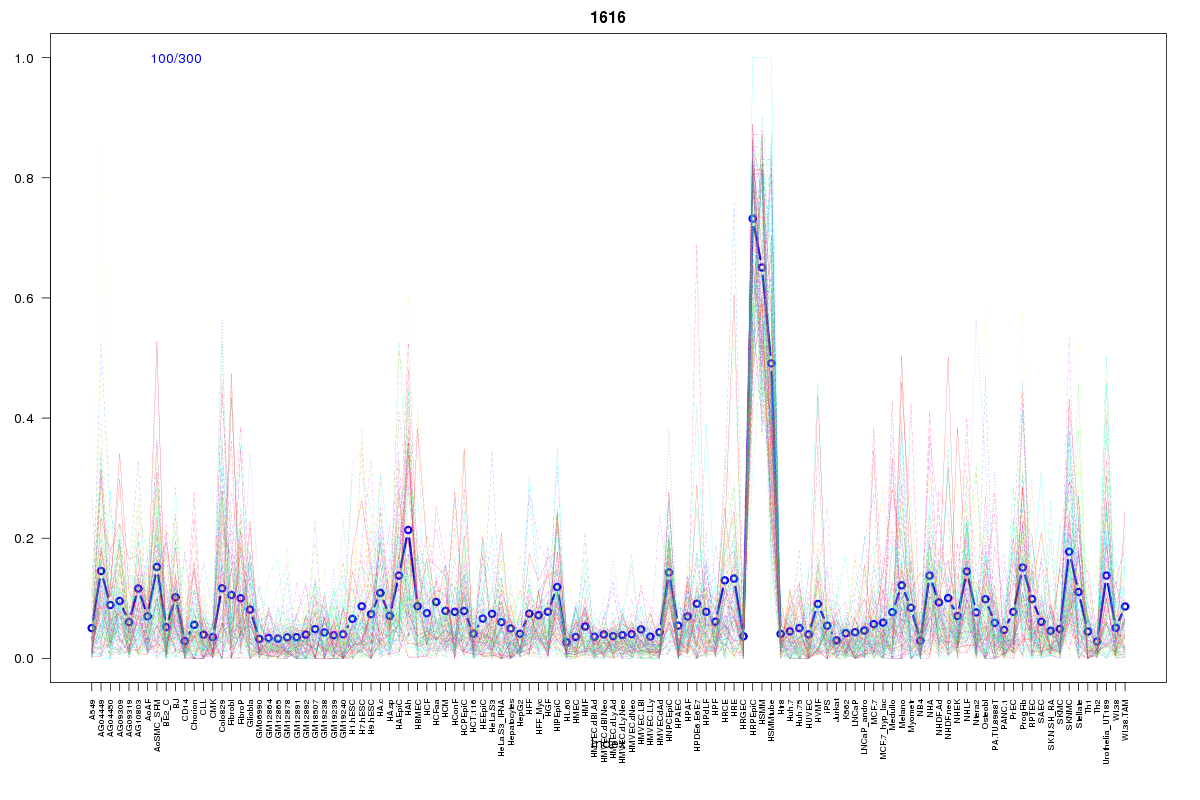 | 1616 | 1 |
Resources
BED file downloads
Connects to 20 DHS sitesTop 10 Correlated DHS Sites
p-values indiciate significant higher or lower correlation| Location | Cluster | P-value |
|---|---|---|
| chr13:47442360-47442510 | 1967 | 0.001 |
| chr13:47488040-47488190 | 1967 | 0.004 |
| chr13:47470500-47470650 | 1967 | 0.007 |
| chr13:47439440-47439590 | 1820 | 0.007 |
| chr13:47478360-47478510 | 1820 | 0.008 |
| chr13:47480680-47480830 | 1820 | 0.009 |
| chr13:47369580-47369730 | 855 | 0.01 |
| chr13:47418640-47418790 | 1916 | 0.011 |
| chr13:47488580-47488730 | 1616 | 0.012 |
| chr13:47562380-47562530 | 1816 | 0.012 |
| chr13:47430820-47430970 | 1816 | 0.012 |
External Databases
UCSCEnsembl (ENSG00000102468)