Gene: TPTEP1
chr22: 17082776-17179632Expression Profile
(log scale)
Graphical Connections
Distribution of linked clusters:
You may find it interesting if many of the connected DHS sites belong to the same cluster.| Cluster Profile | Cluster ID | Number of DHS sites in this cluster |
|---|---|---|
 | 615 | 19 |
 | 2110 | 12 |
 | 1963 | 5 |
 | 2114 | 3 |
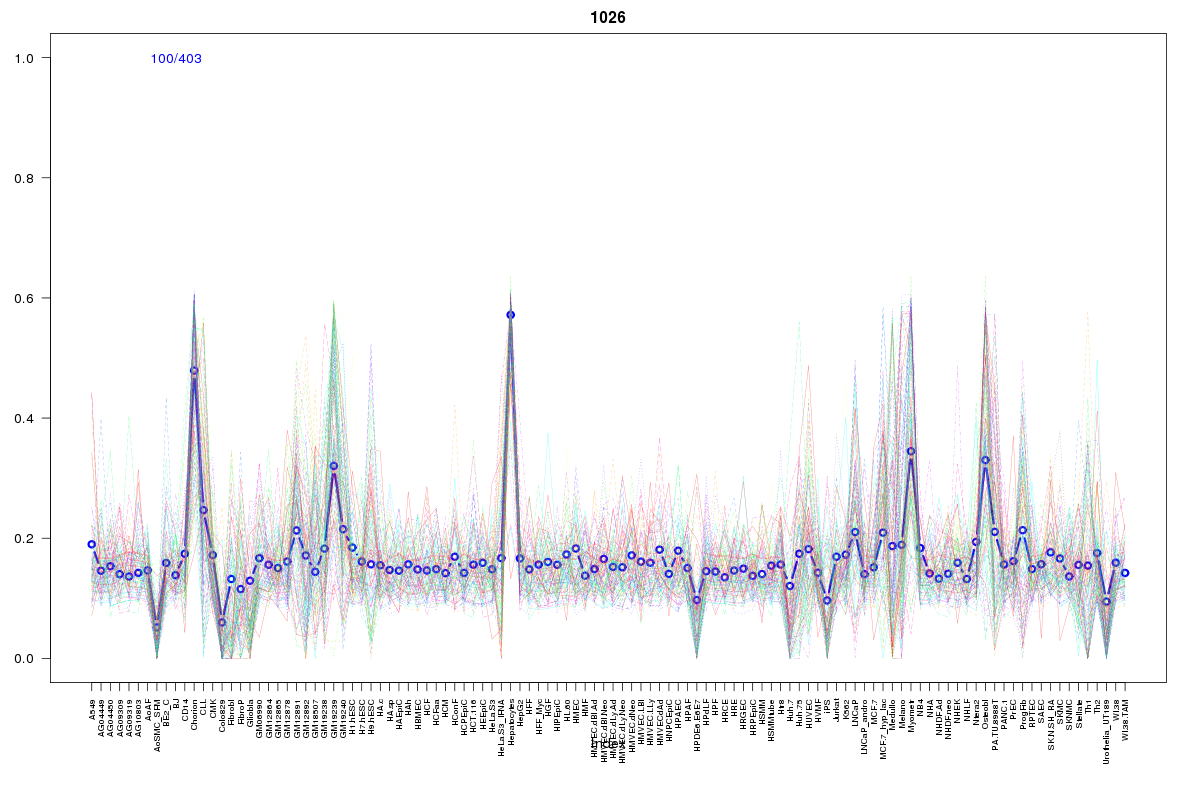 | 1026 | 2 |
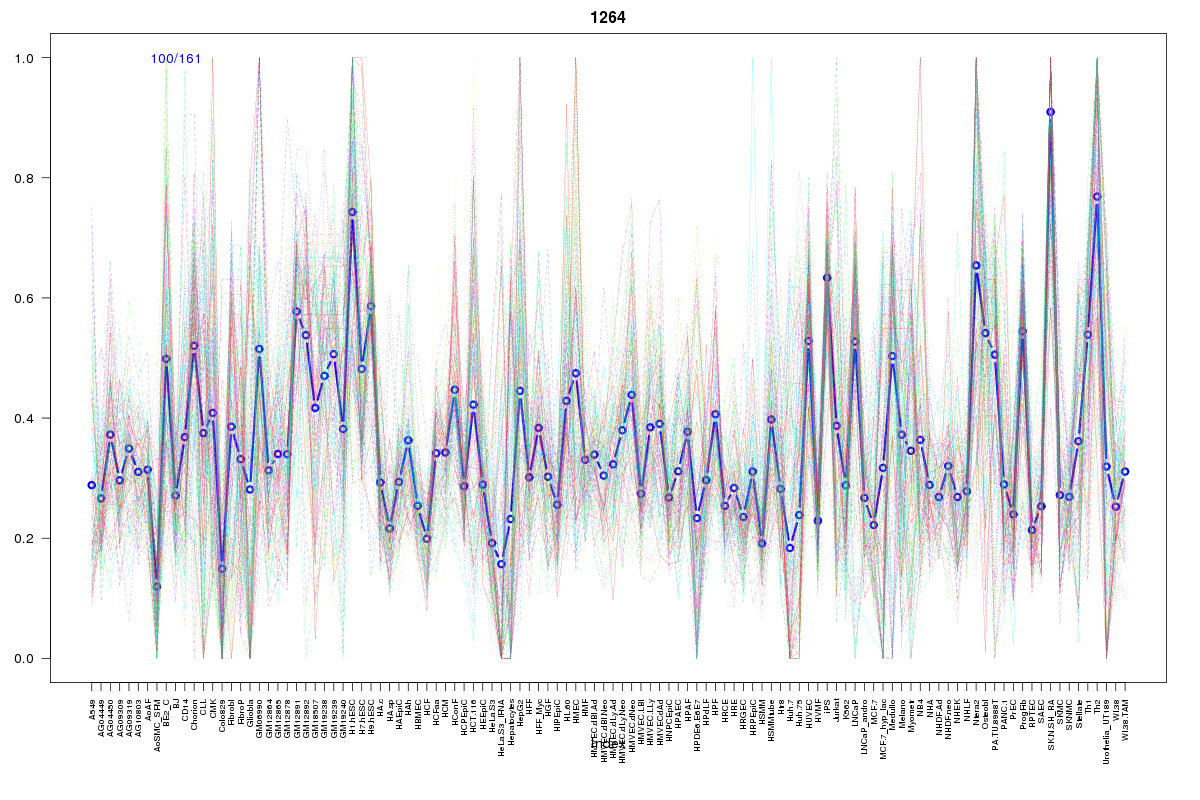 | 1264 | 1 |
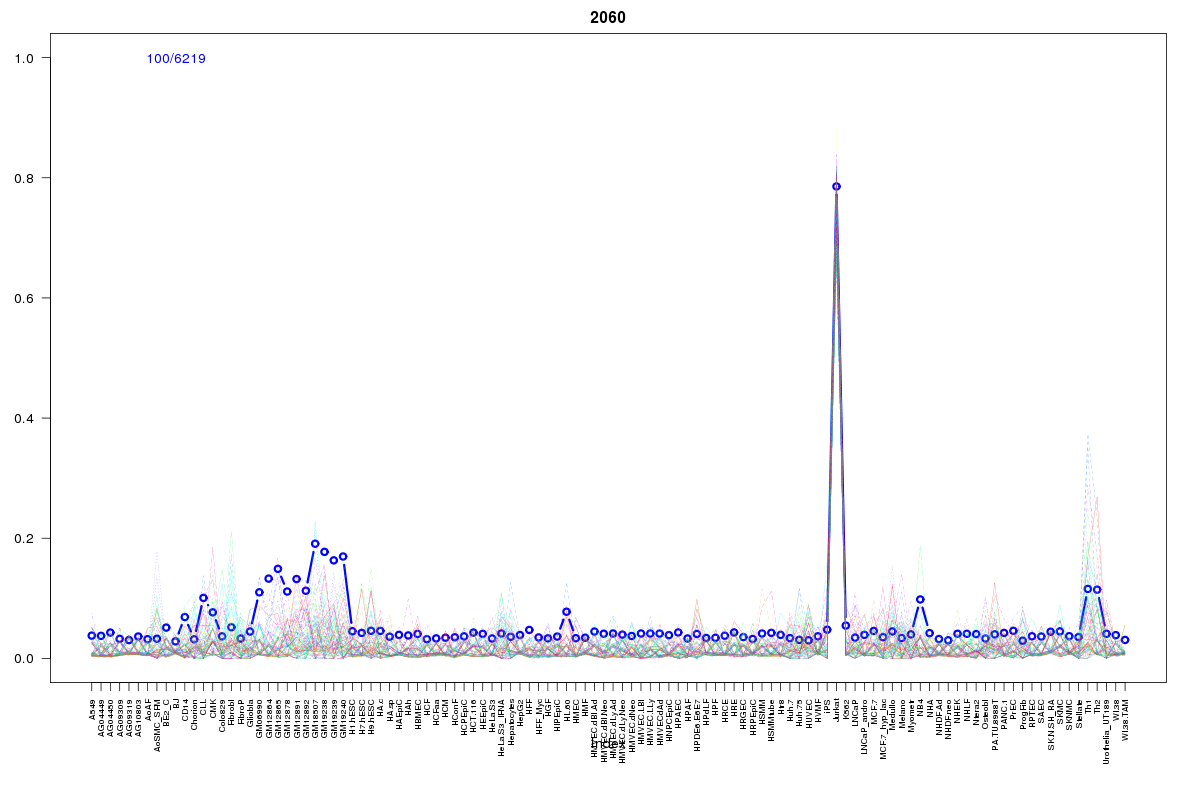 | 2060 | 1 |
 | 2279 | 1 |
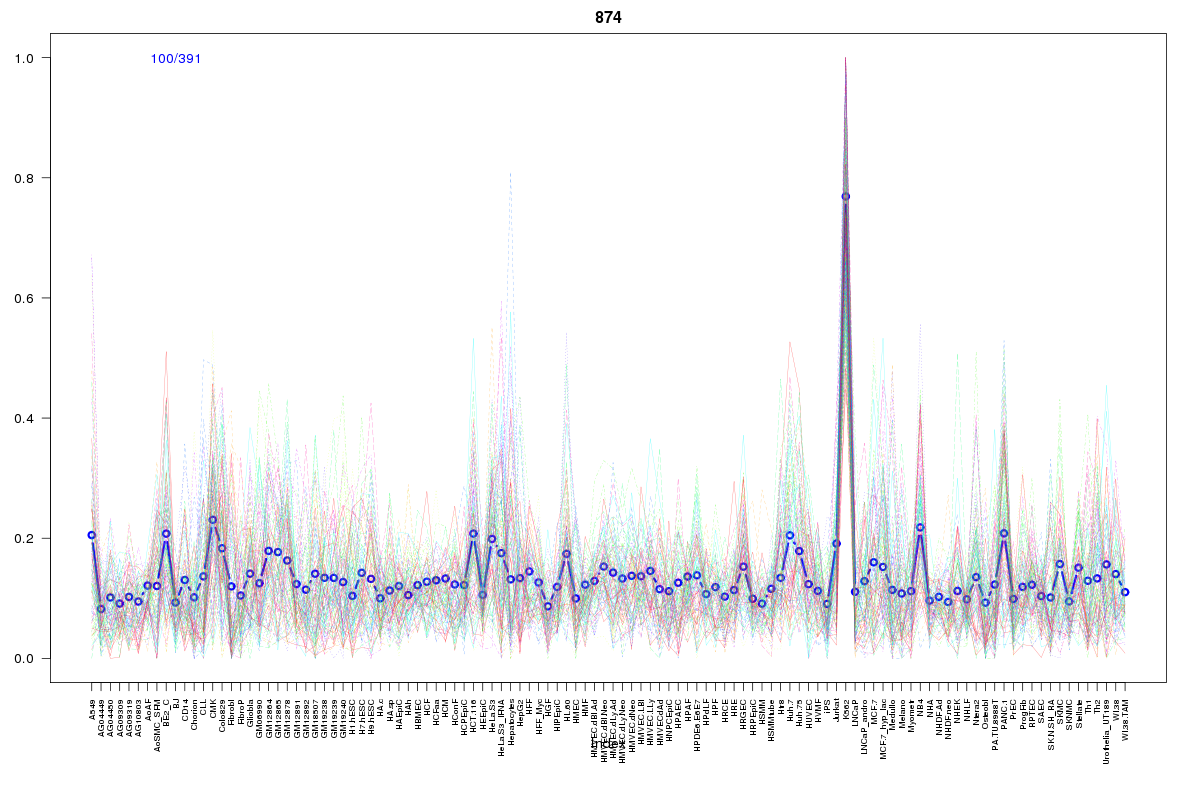 | 874 | 1 |
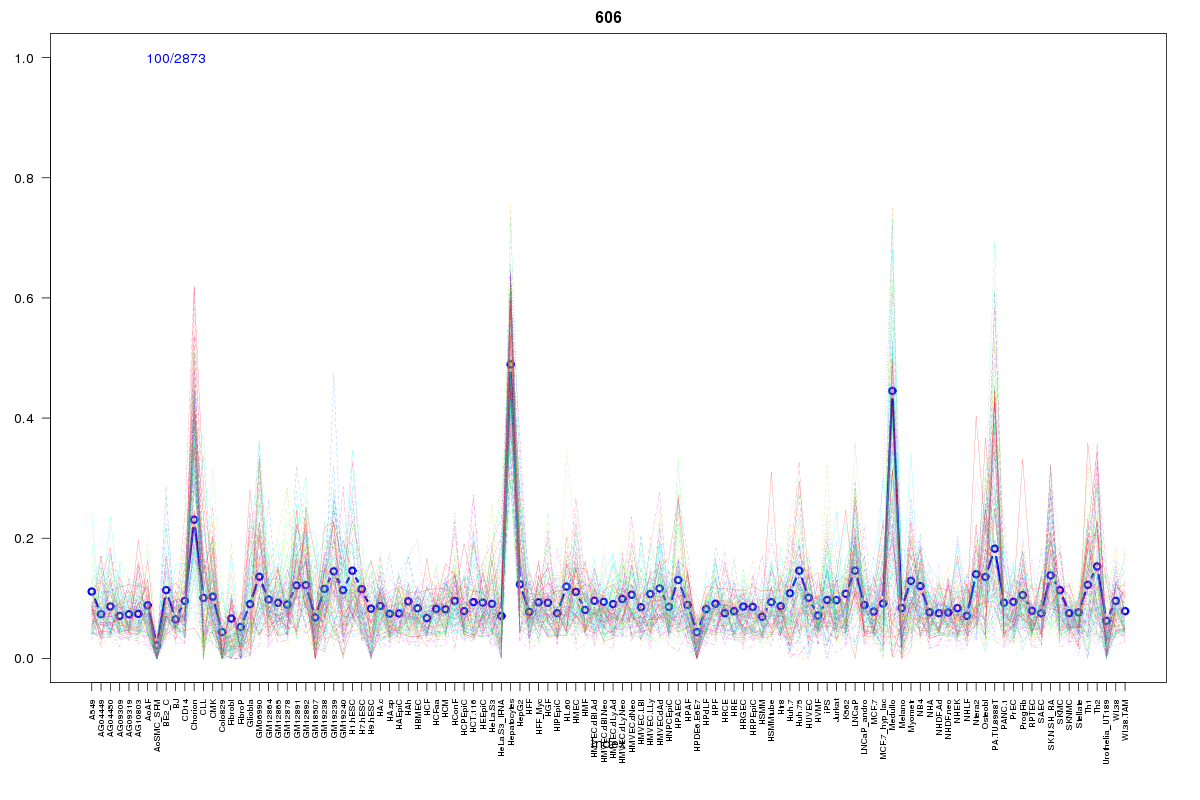 | 606 | 1 |
 | 1605 | 1 |
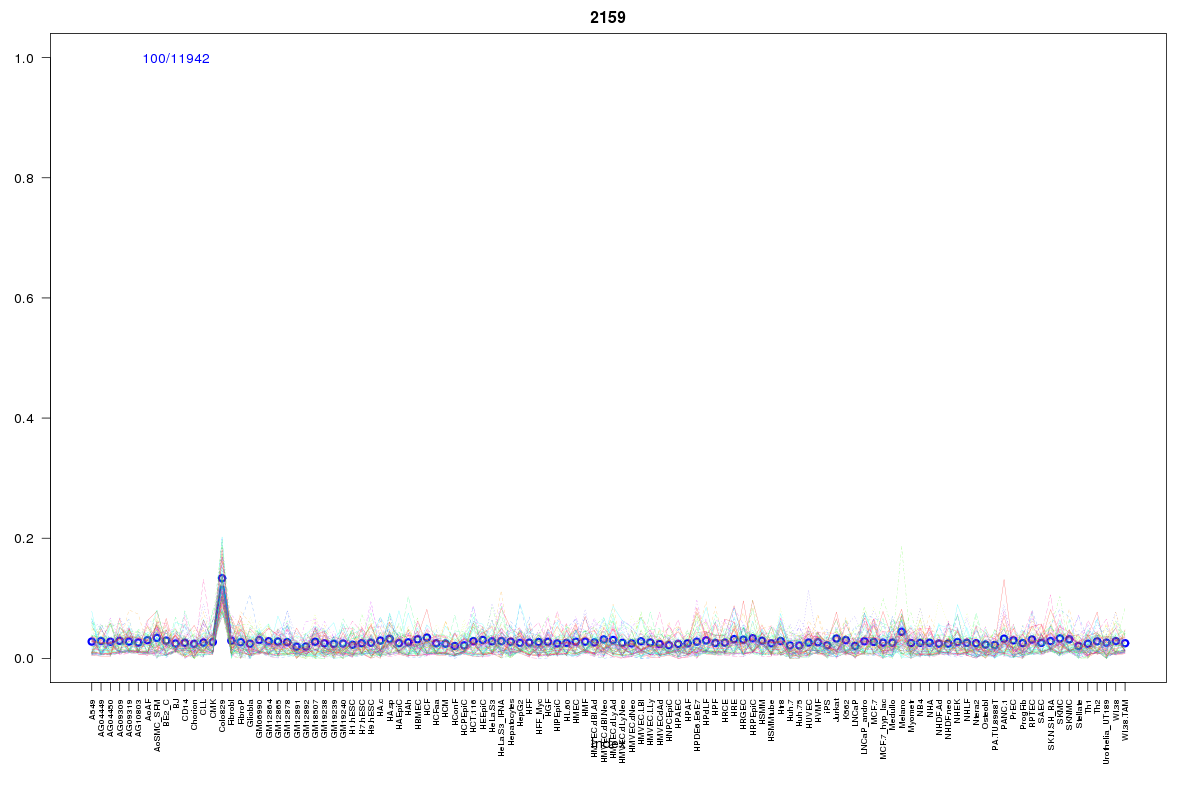 | 2159 | 1 |
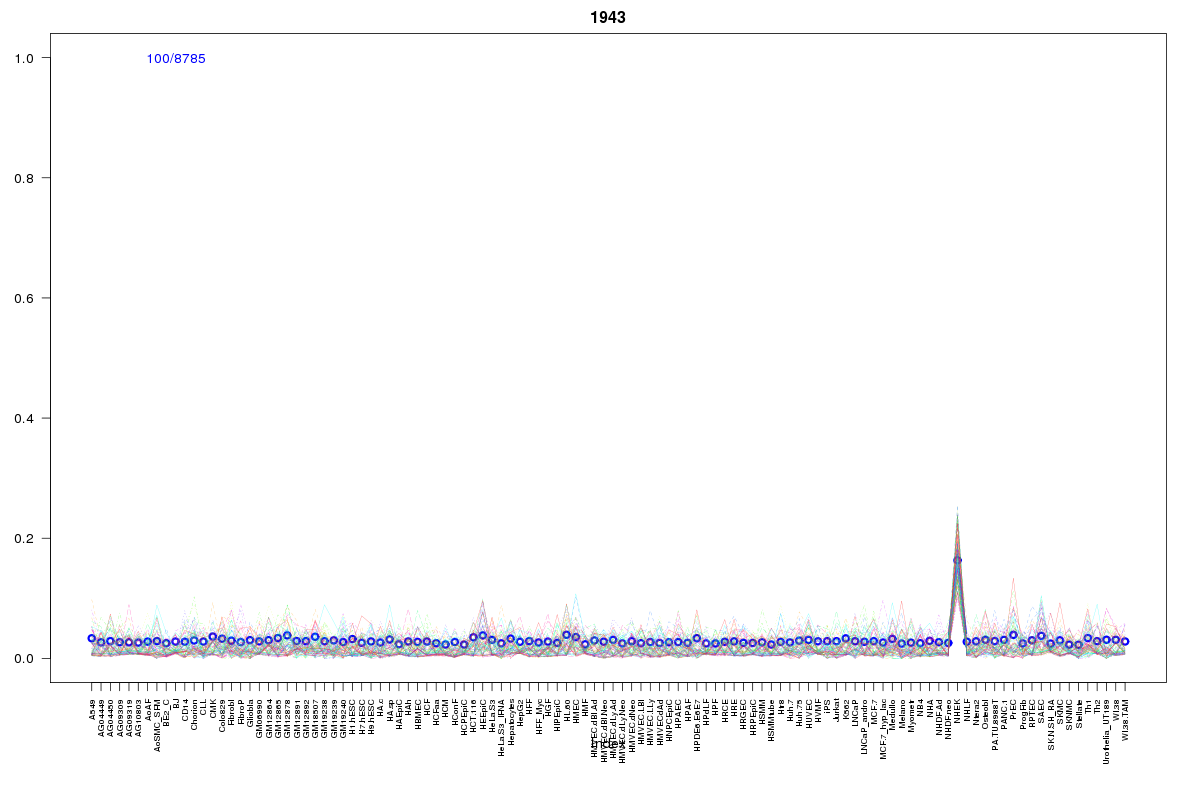 | 1943 | 1 |
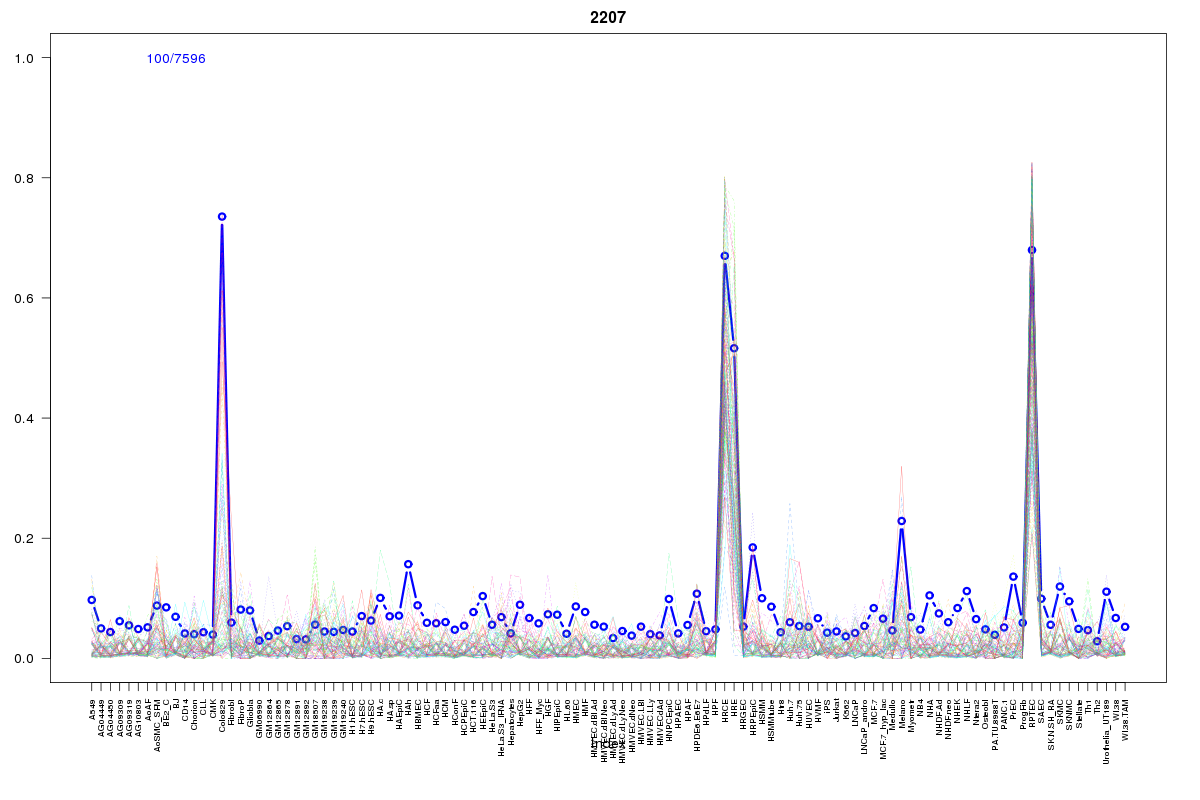 | 2207 | 1 |
 | 860 | 1 |
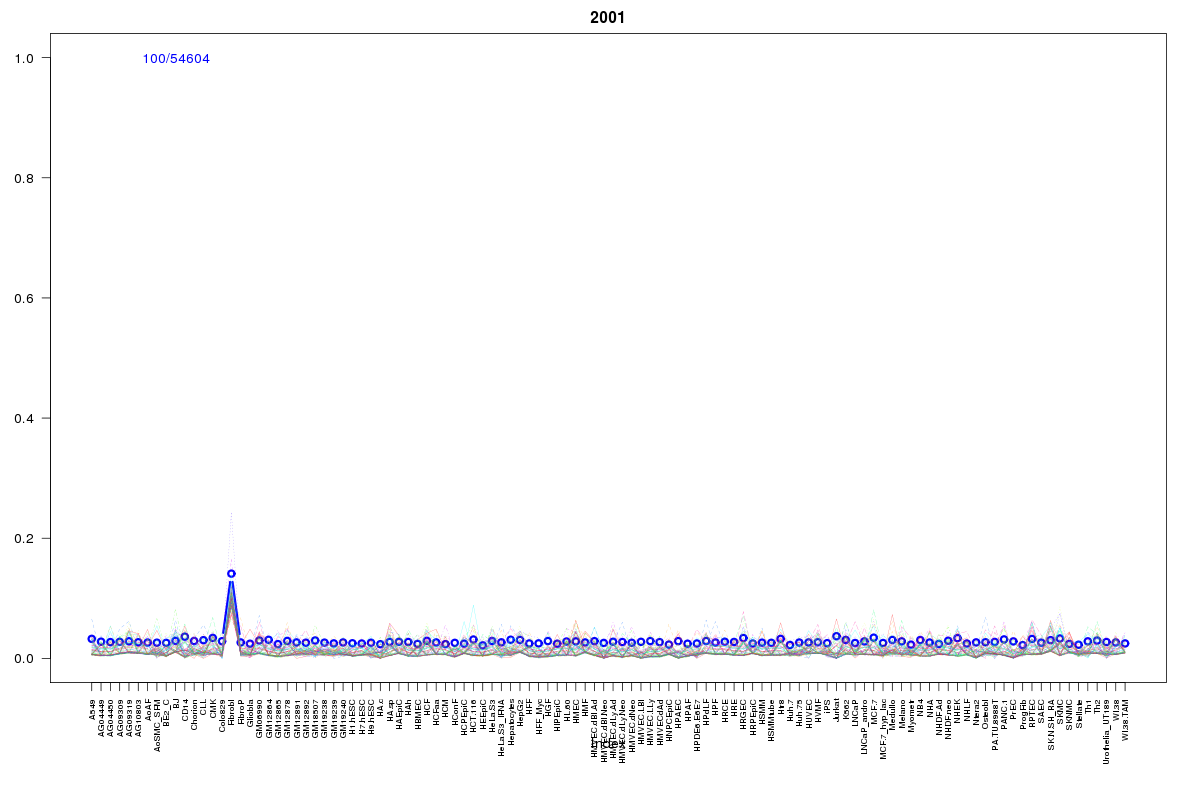 | 2001 | 1 |
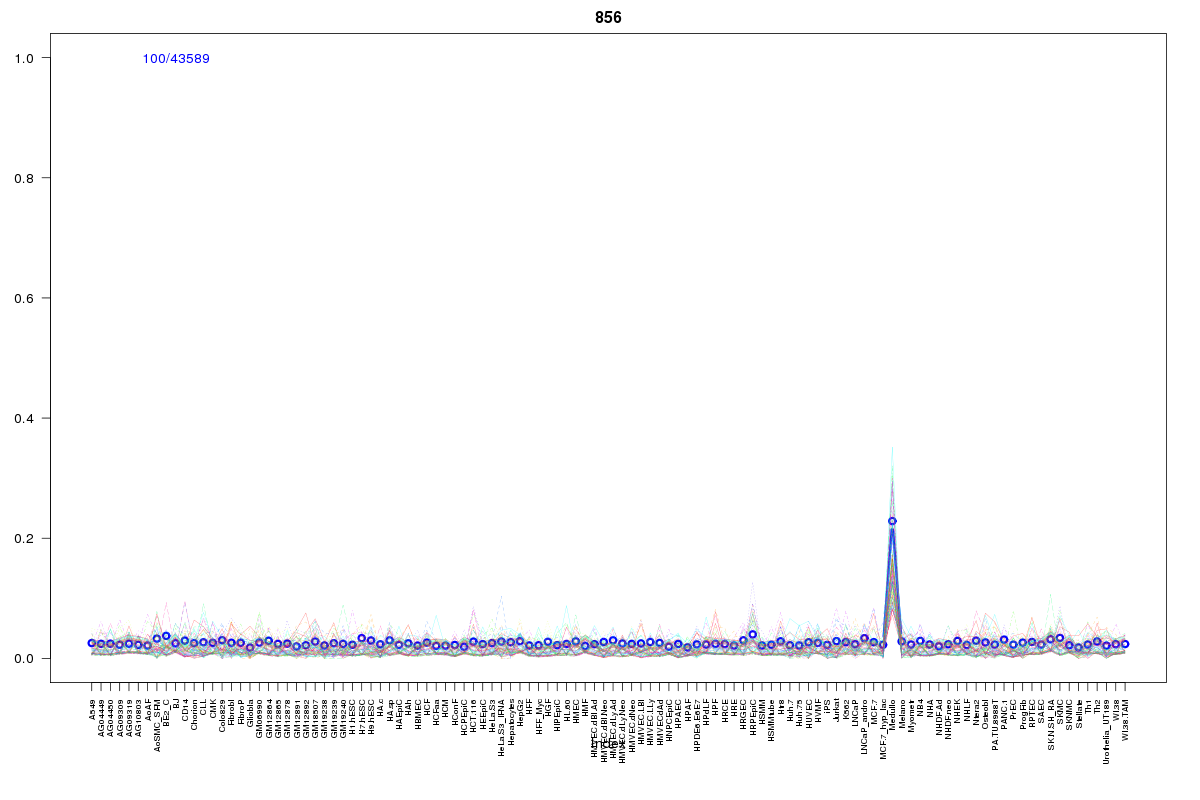 | 856 | 1 |
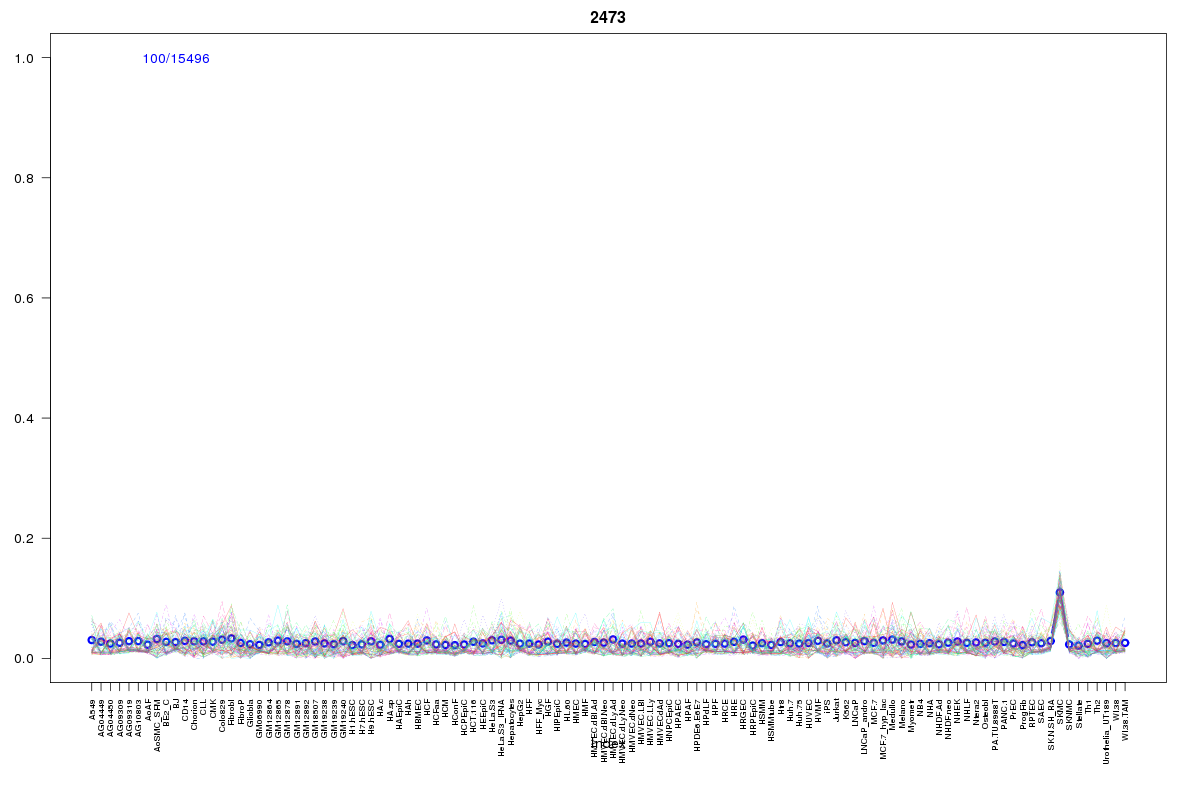 | 2473 | 1 |
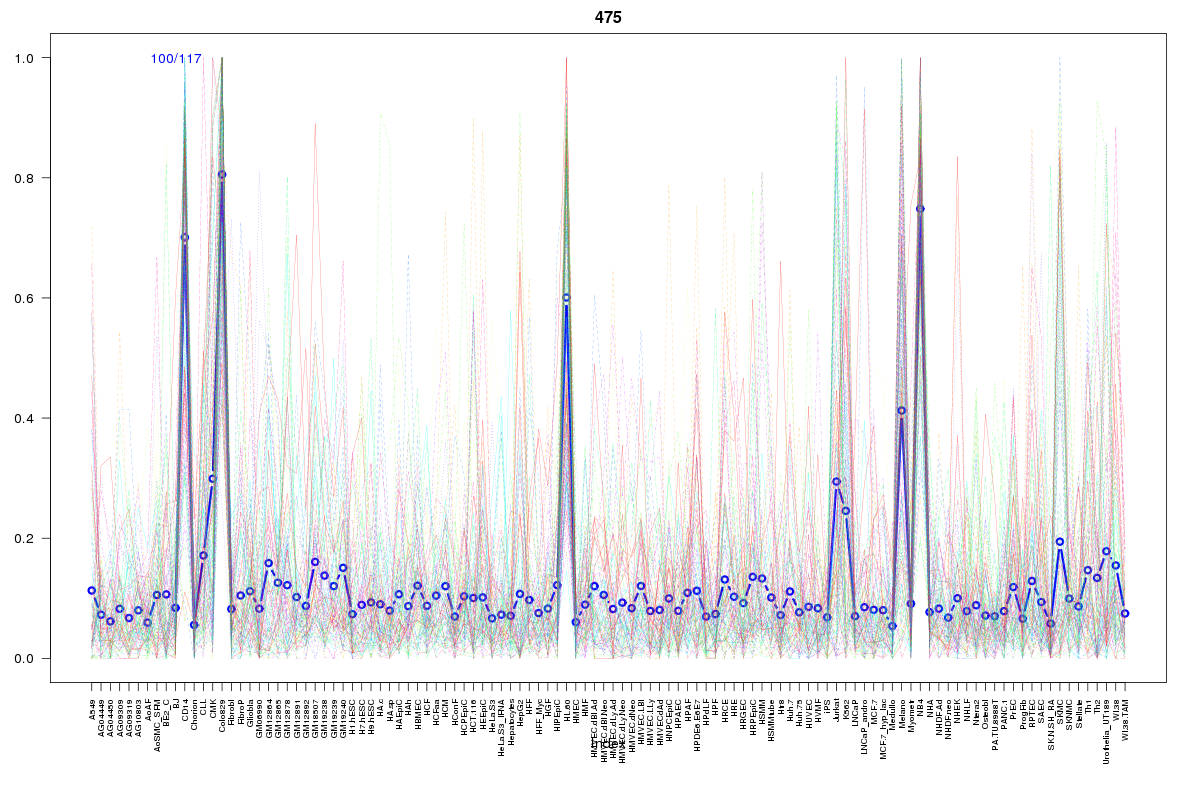 | 475 | 1 |
Resources
BED file downloads
Connects to 55 DHS sitesTop 10 Correlated DHS Sites
p-values indiciate significant higher or lower correlationExternal Databases
UCSCEnsembl (ENSG00000100181)