Gene: TTC39A
chr1: 51752929-51810788Expression Profile
(log scale)
Graphical Connections
Distribution of linked clusters:
You may find it interesting if many of the connected DHS sites belong to the same cluster.| Cluster Profile | Cluster ID | Number of DHS sites in this cluster |
|---|---|---|
 | 862 | 3 |
 | 2186 | 3 |
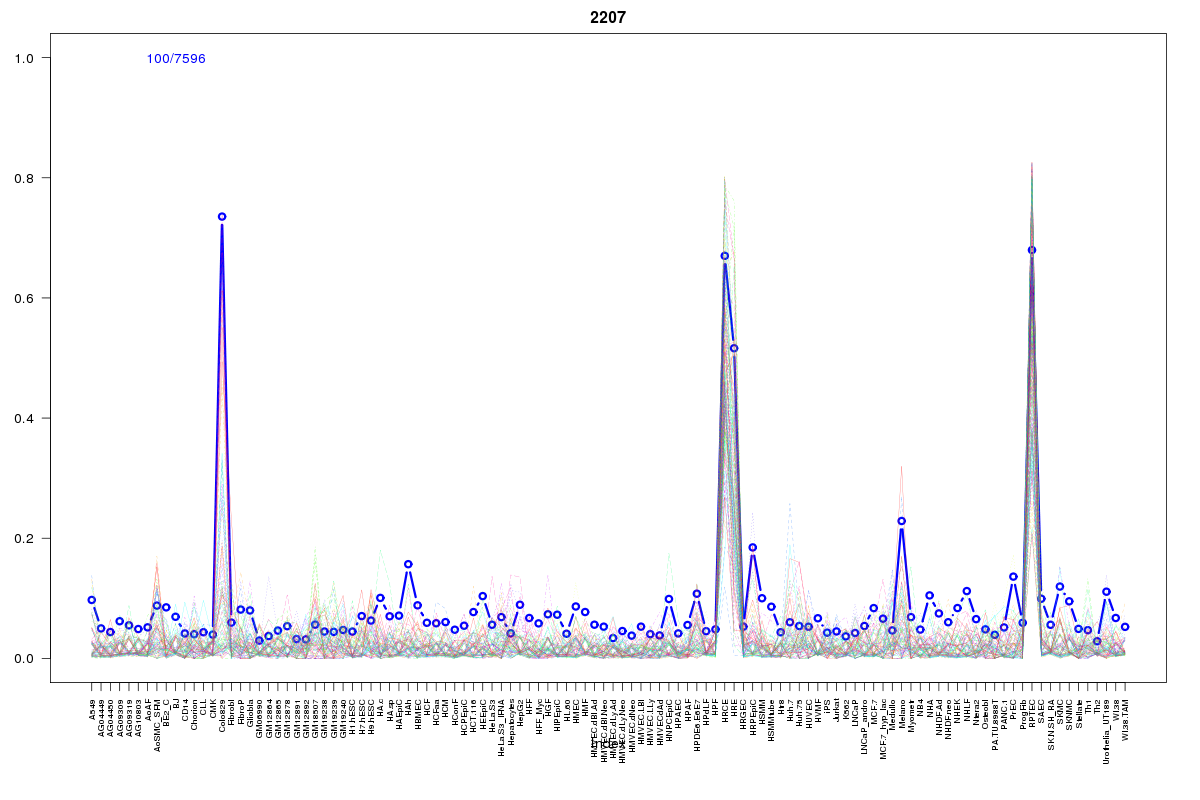 | 2207 | 2 |
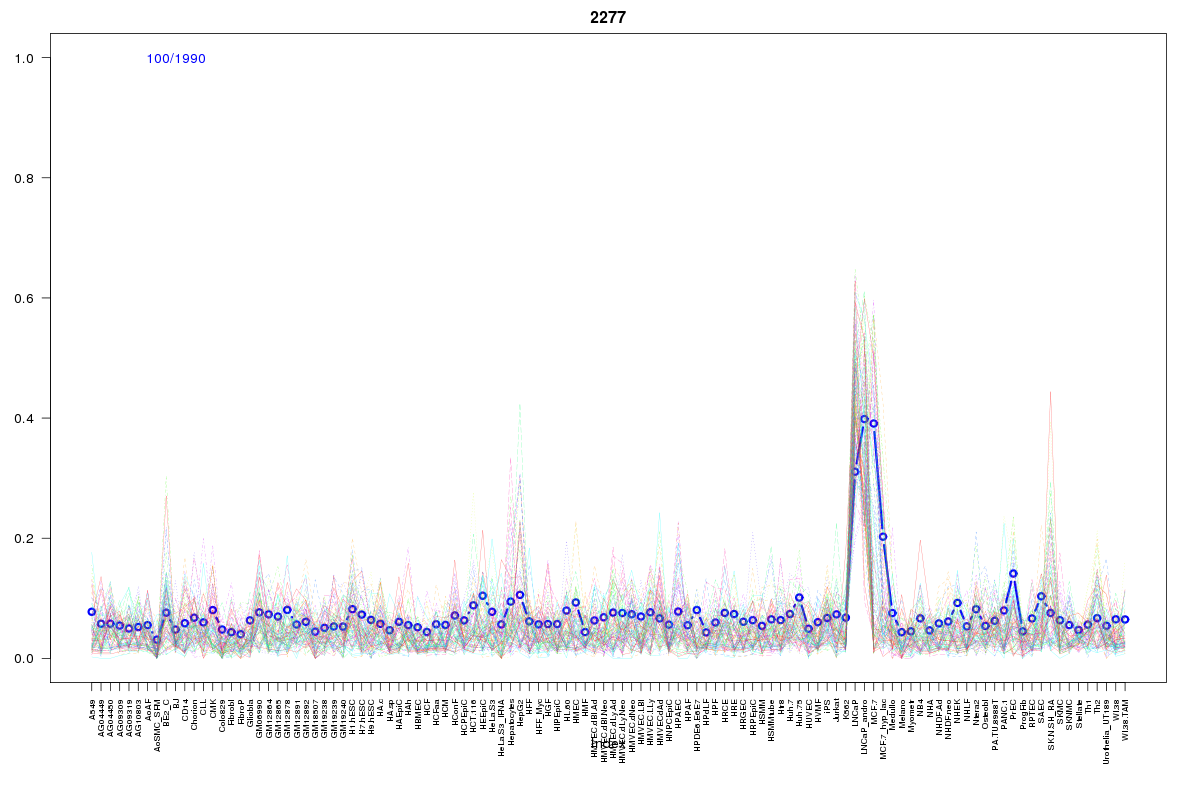 | 2277 | 2 |
 | 2211 | 1 |
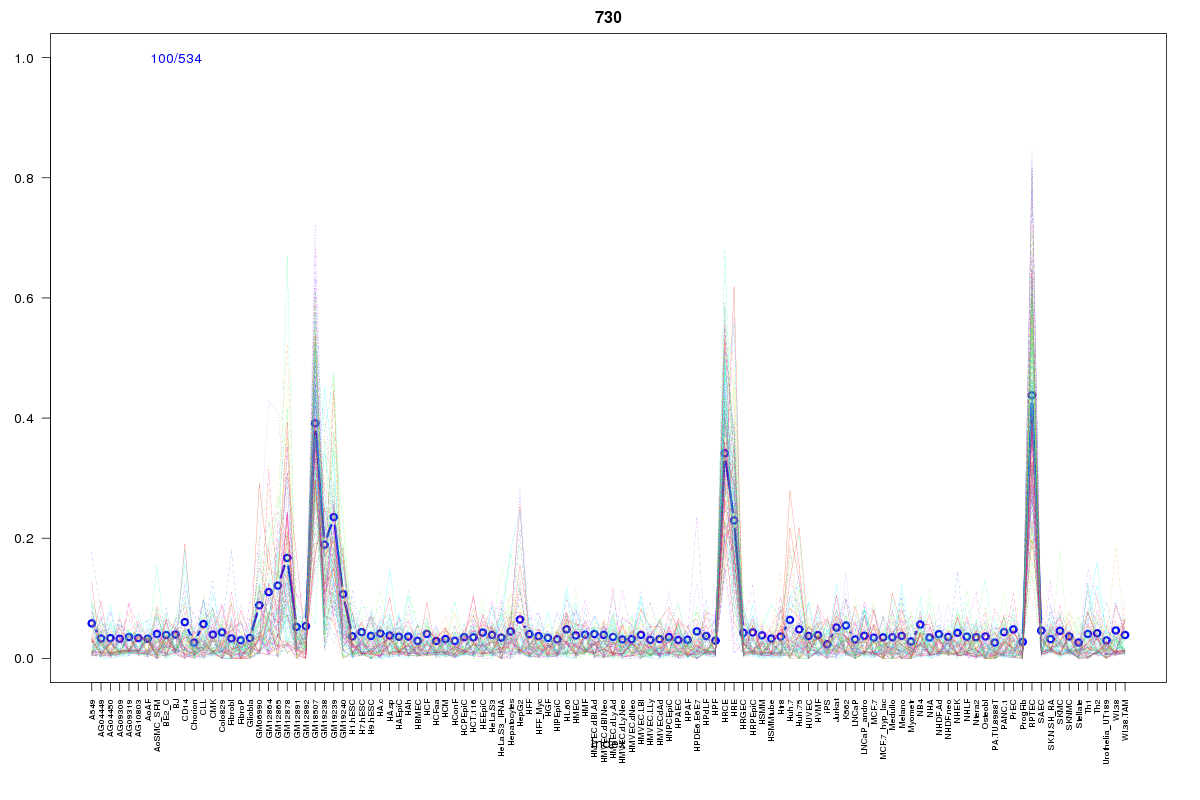 | 730 | 1 |
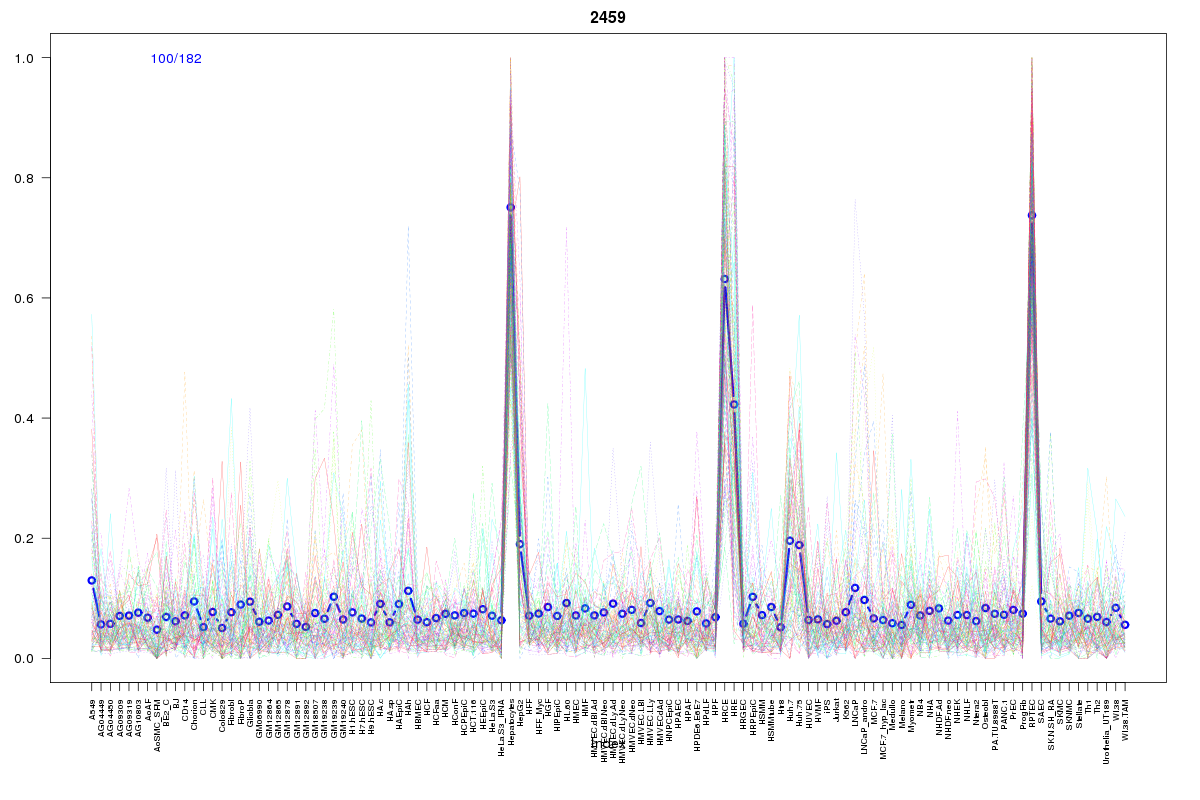 | 2459 | 1 |
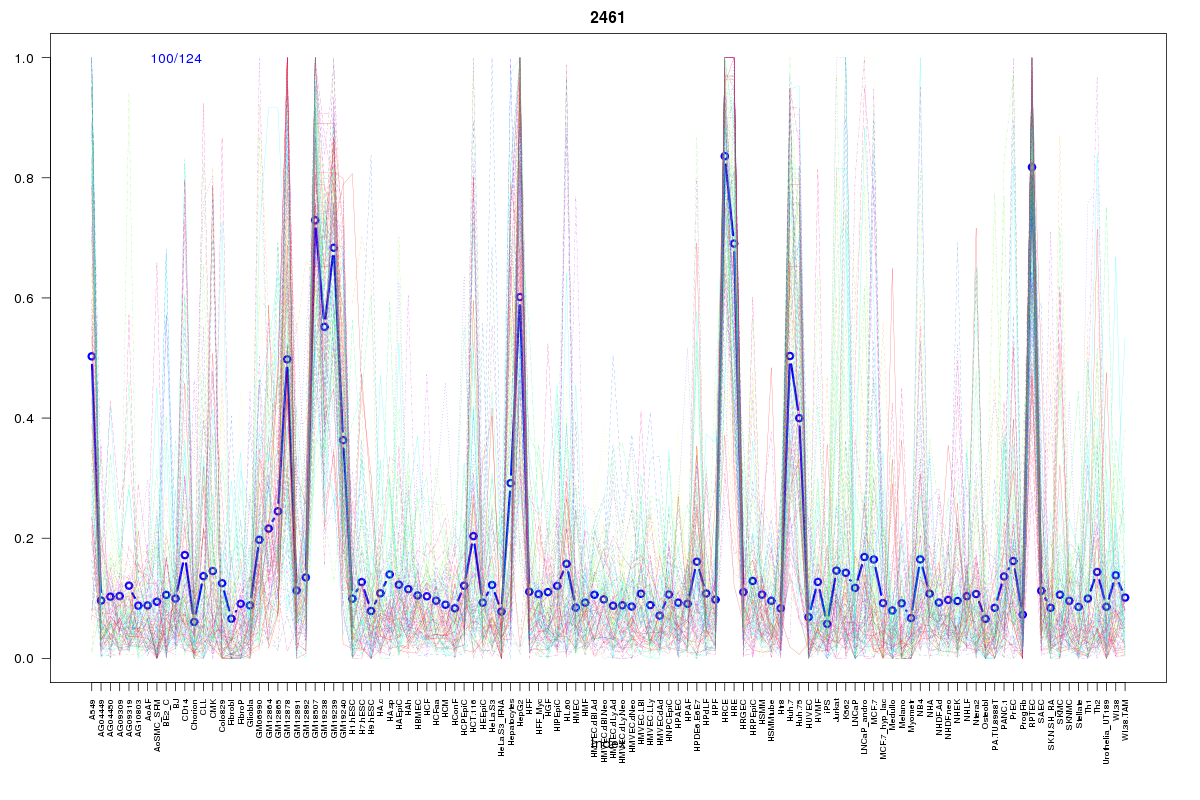 | 2461 | 1 |
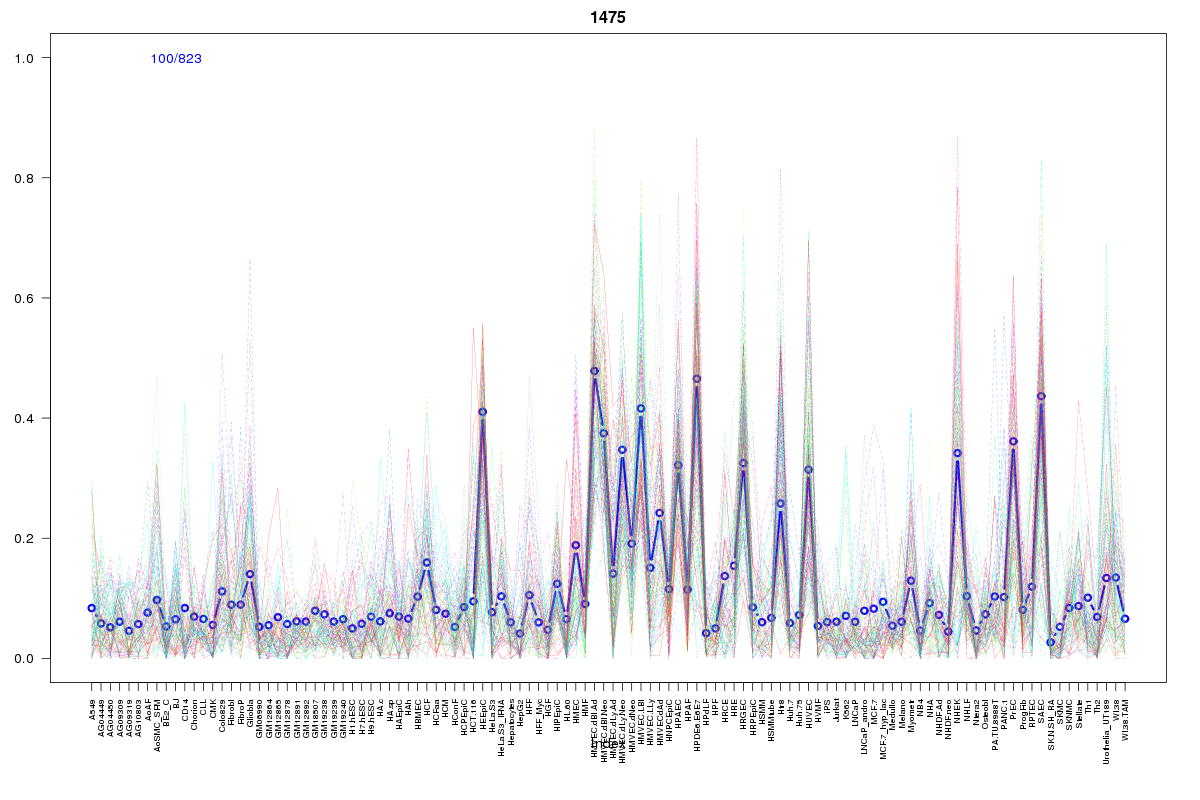 | 1475 | 1 |
 | 2237 | 1 |
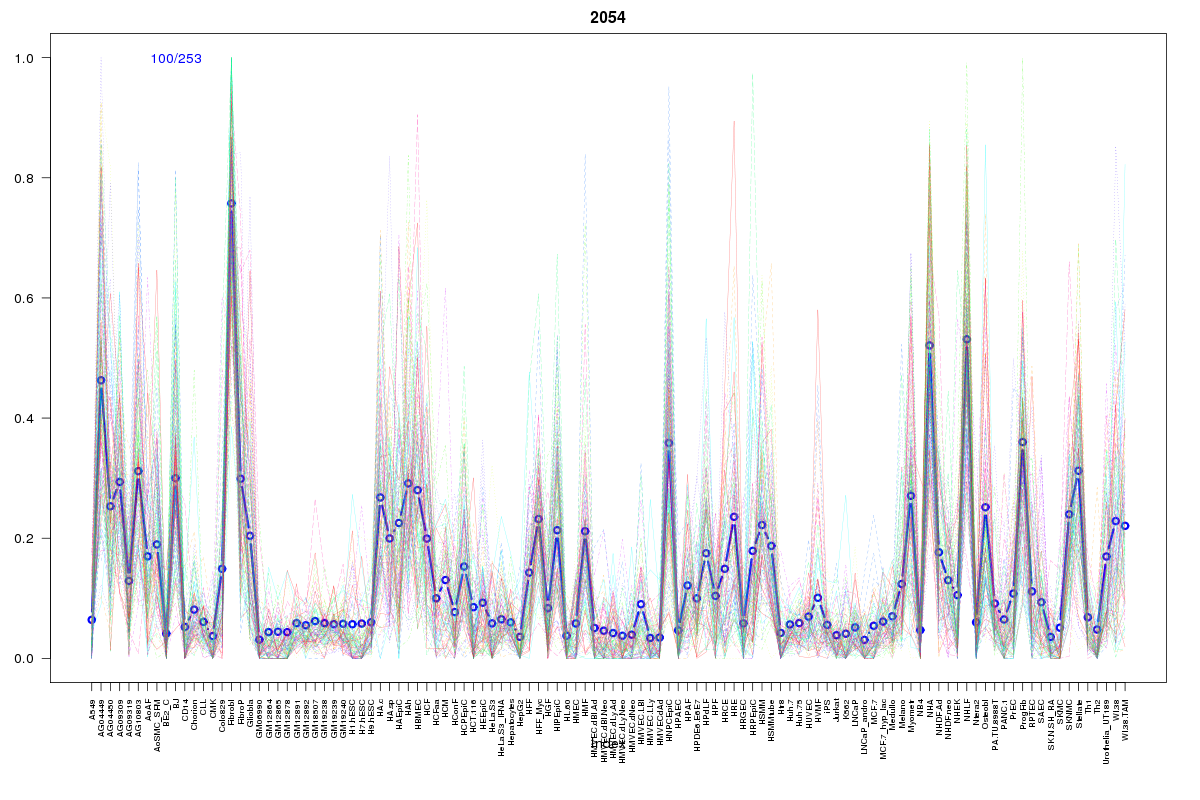 | 2054 | 1 |
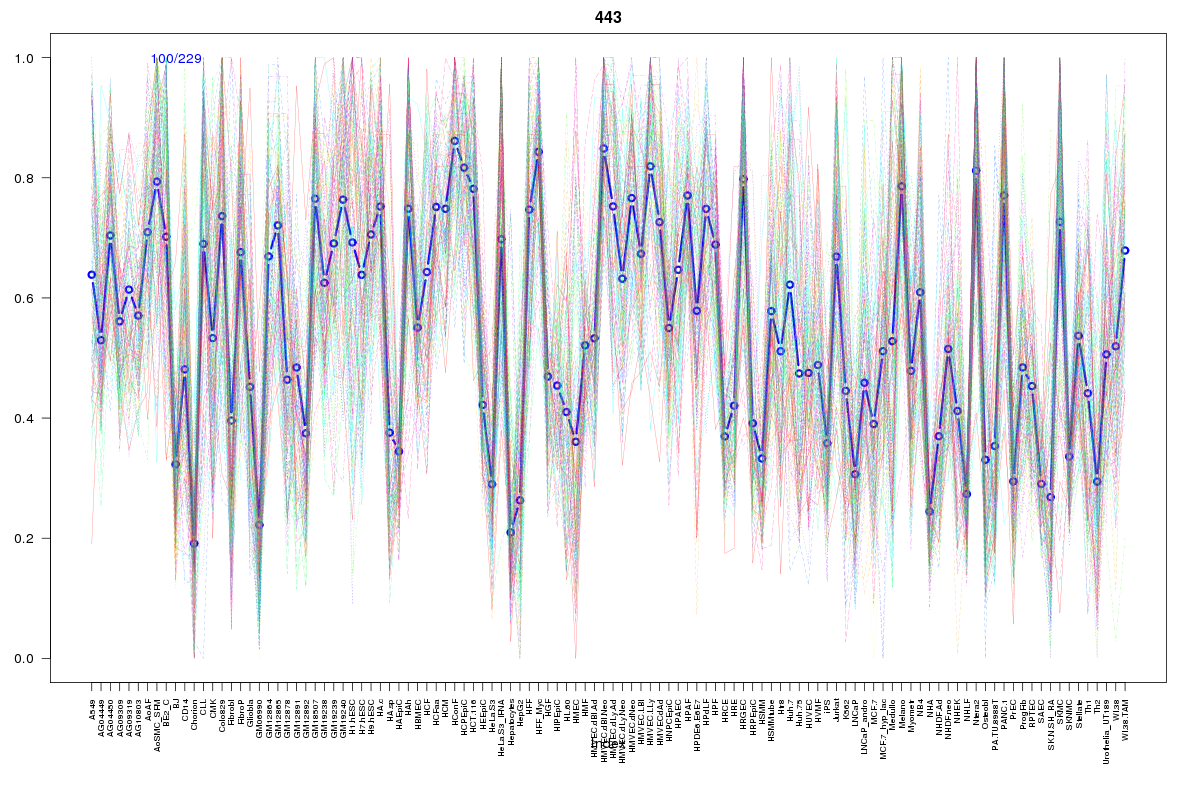 | 443 | 1 |
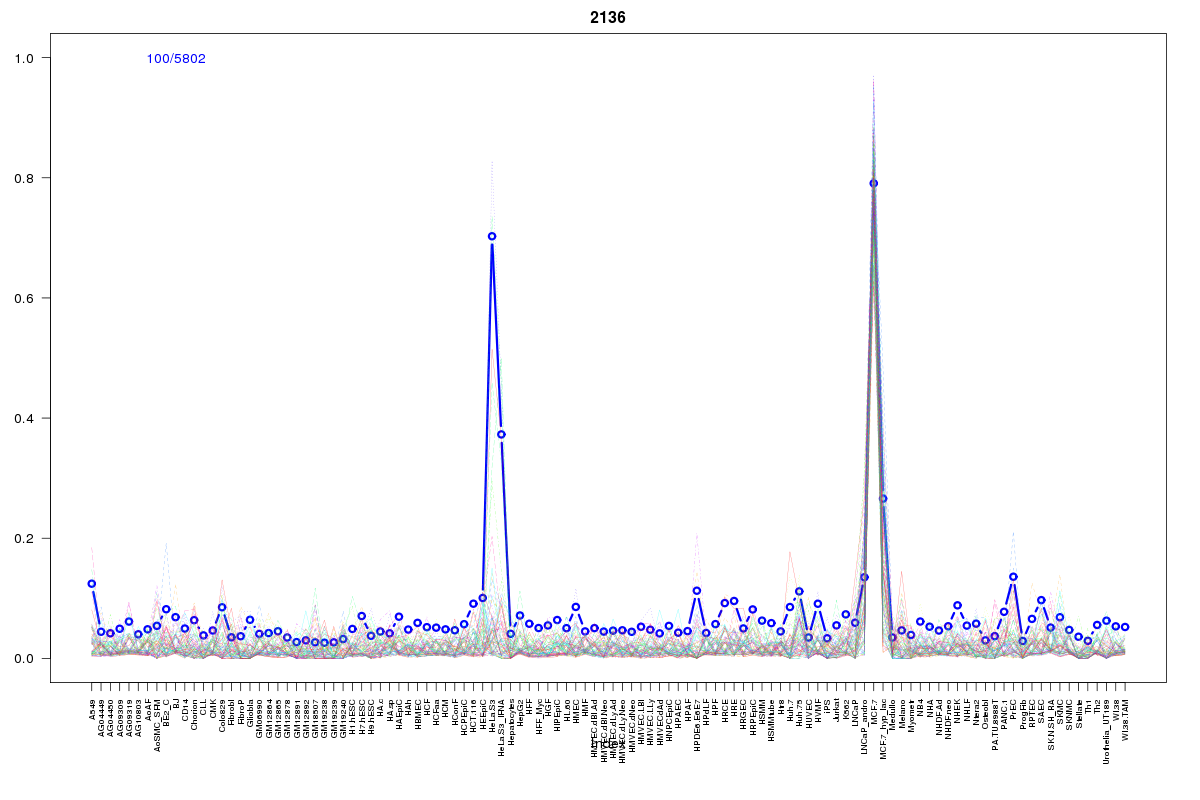 | 2136 | 1 |
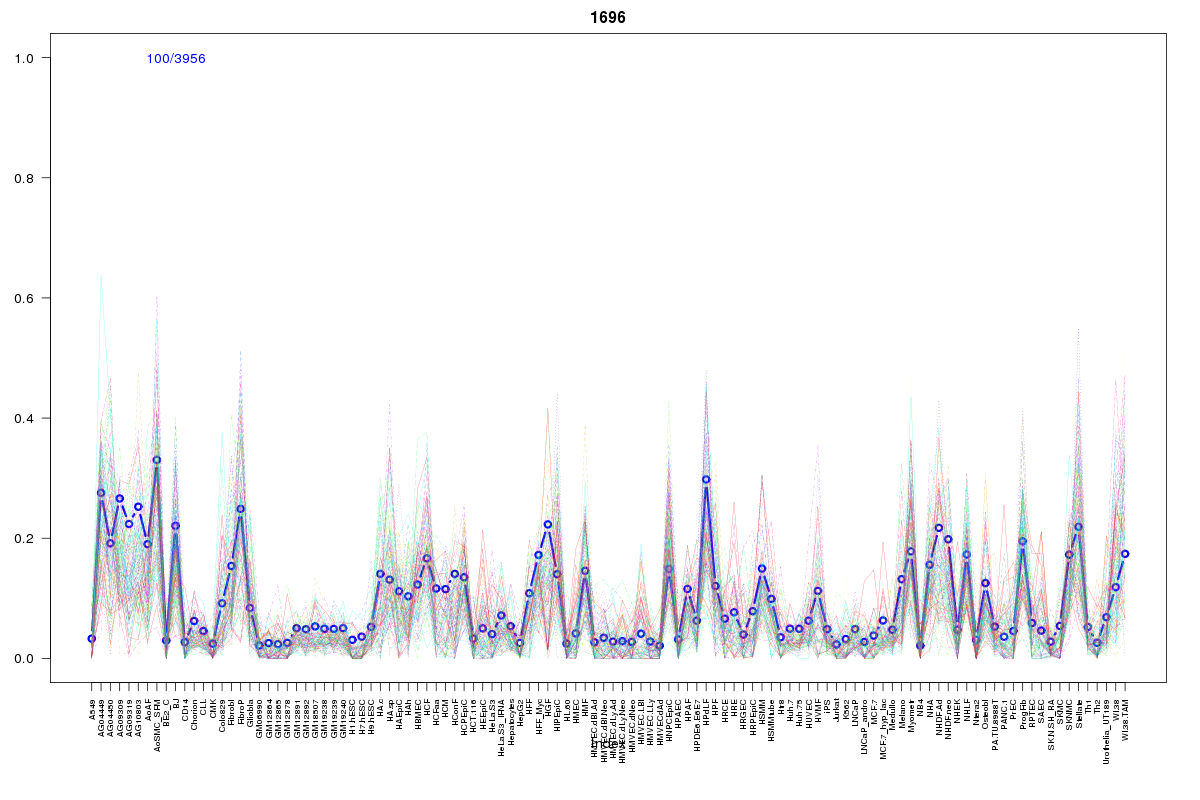 | 1696 | 1 |
 | 2233 | 1 |
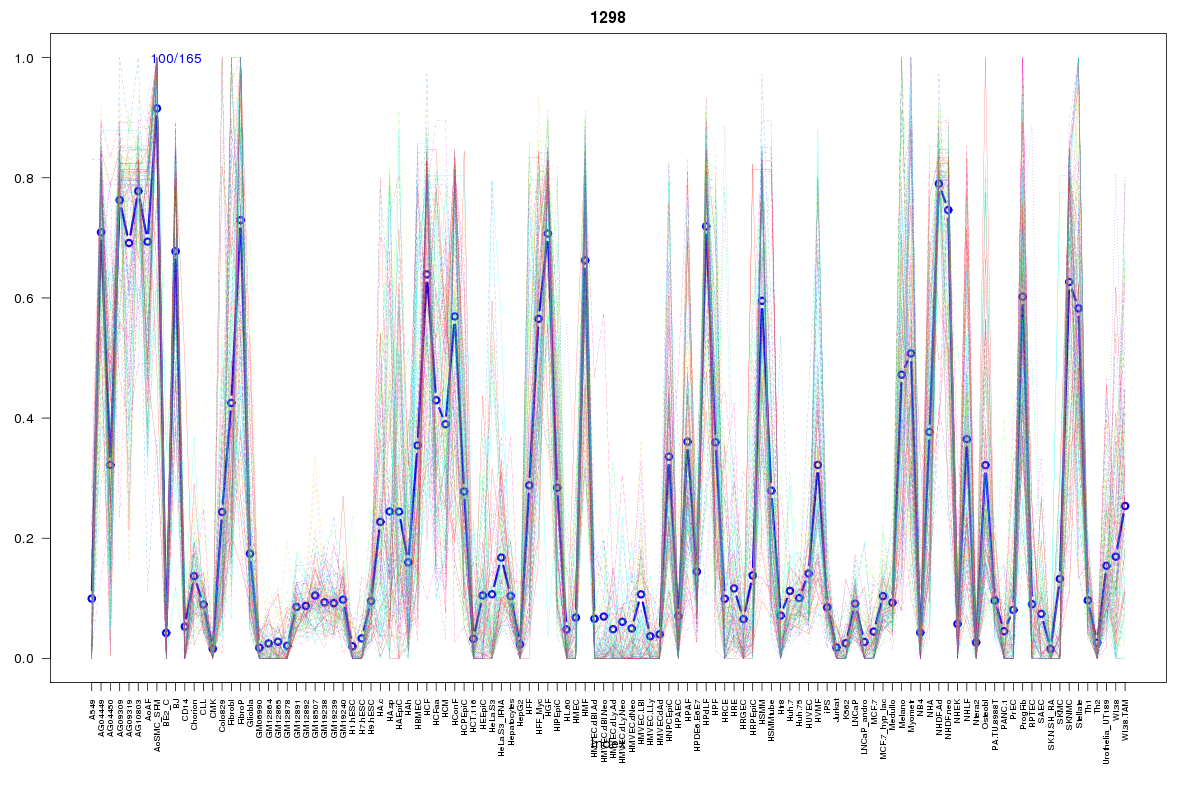 | 1298 | 1 |
 | 2279 | 1 |
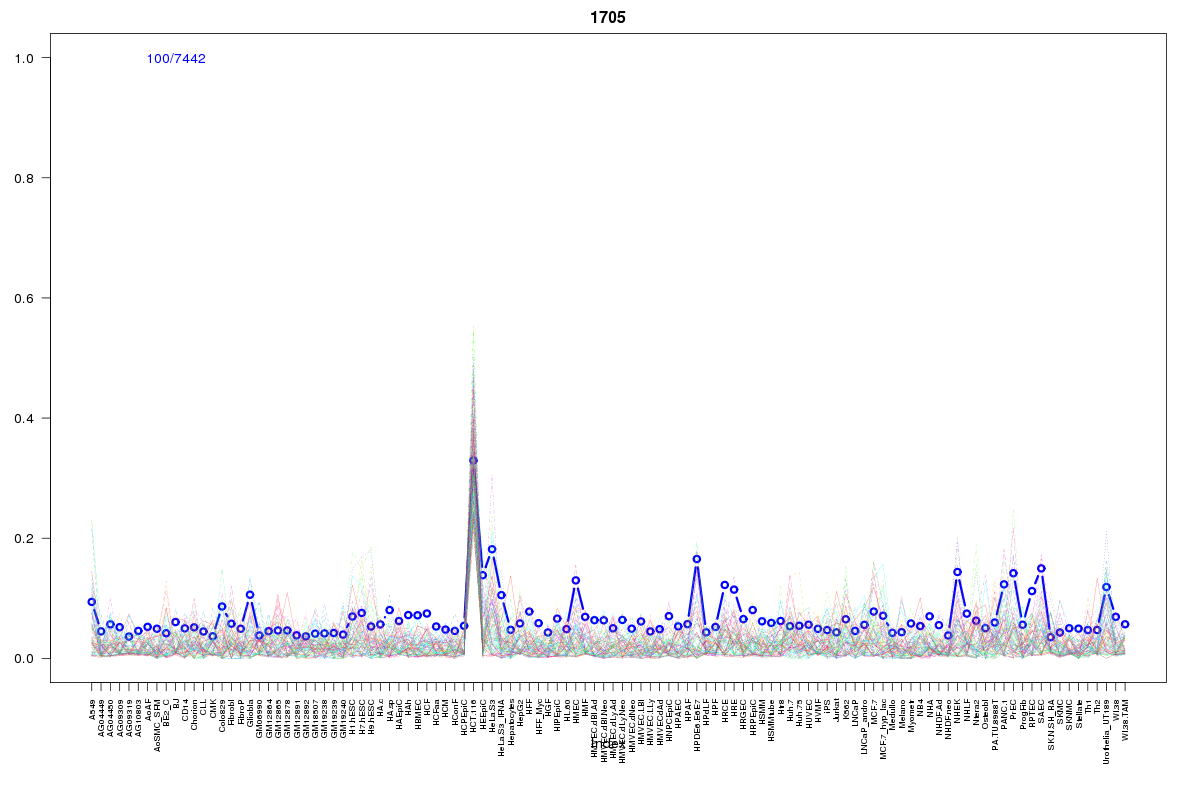 | 1705 | 1 |
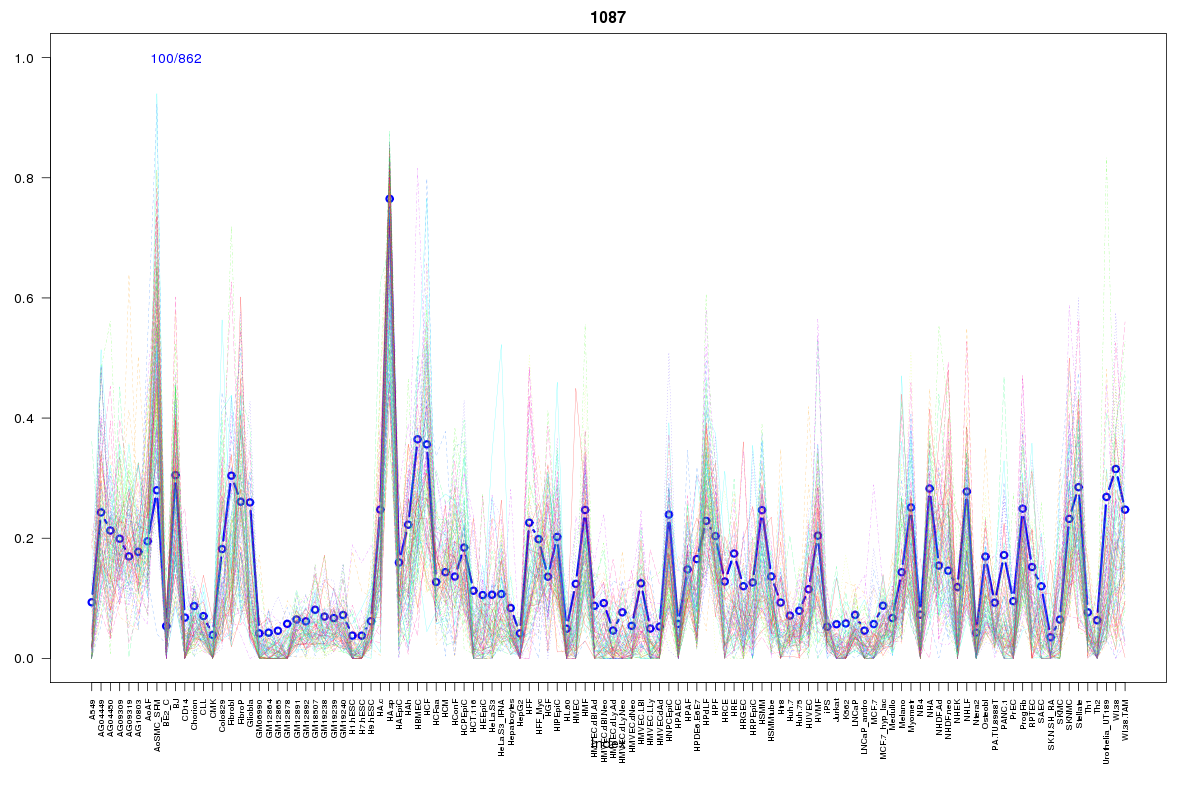 | 1087 | 1 |
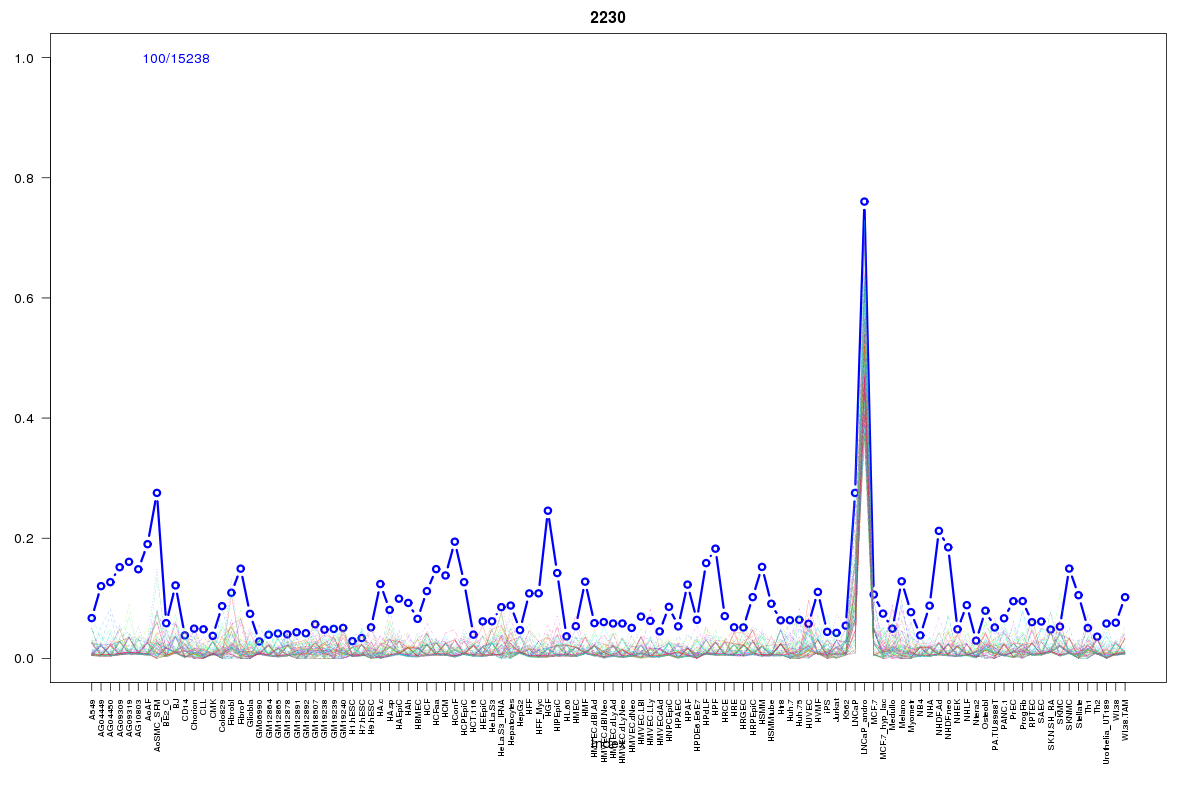 | 2230 | 1 |
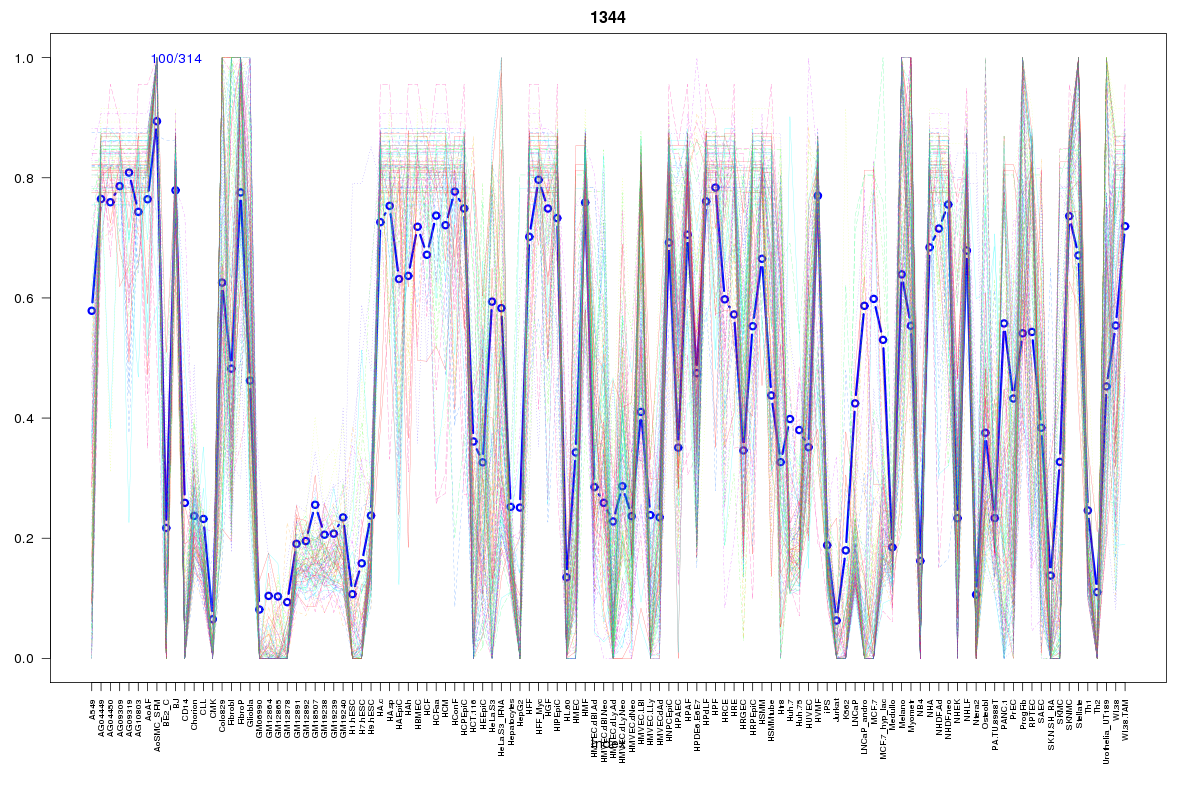 | 1344 | 1 |
Resources
BED file downloads
Connects to 27 DHS sitesTop 10 Correlated DHS Sites
p-values indiciate significant higher or lower correlation| Location | Cluster | P-value |
|---|---|---|
| chr1:51772760-51772910 | 2277 | 0 |
| chr1:51781965-51782115 | 862 | 0.001 |
| chr1:51795200-51795350 | 2233 | 0.002 |
| chr1:51771200-51771350 | 2461 | 0.002 |
| chr1:51812200-51812350 | 2230 | 0.004 |
| chr1:51746320-51746470 | 2207 | 0.004 |
| chr1:51771045-51771195 | 2459 | 0.004 |
| chr1:51790040-51790190 | 2237 | 0.005 |
| chr1:51795565-51795715 | 2279 | 0.006 |
| chr1:51782540-51782690 | 2207 | 0.009 |
| chr1:51812045-51812195 | 2277 | 0.009 |
External Databases
UCSCEnsembl (ENSG00000085831)