Gene: MTIF2
chr2: 55463730-55496379Expression Profile
(log scale)
Graphical Connections
Distribution of linked clusters:
You may find it interesting if many of the connected DHS sites belong to the same cluster.| Cluster Profile | Cluster ID | Number of DHS sites in this cluster |
|---|---|---|
 | 615 | 7 |
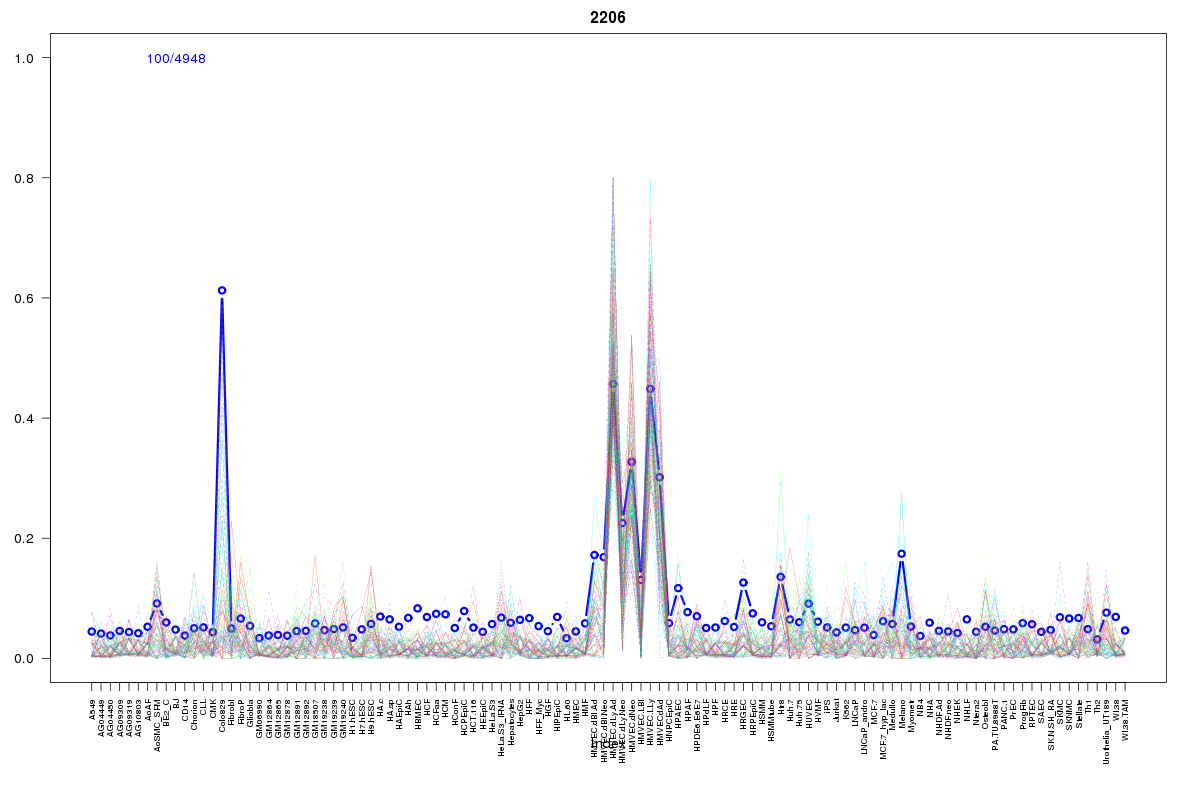 | 2206 | 3 |
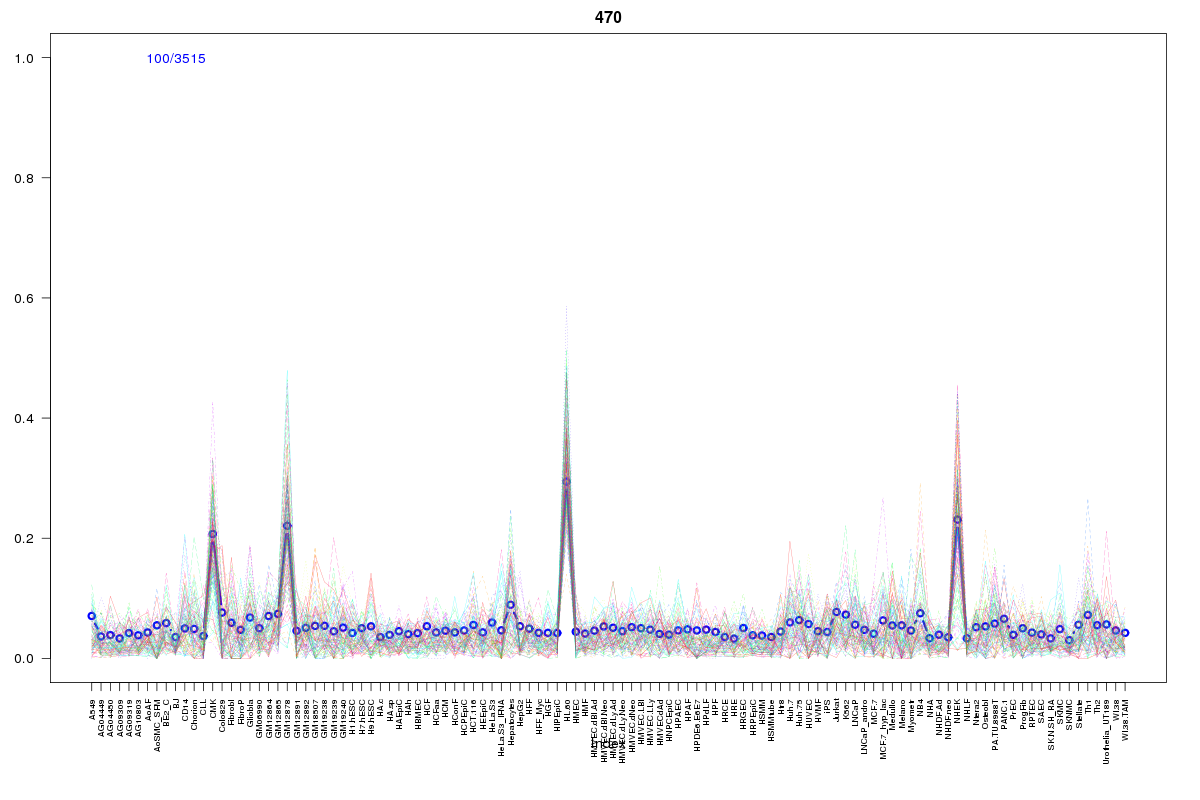 | 470 | 2 |
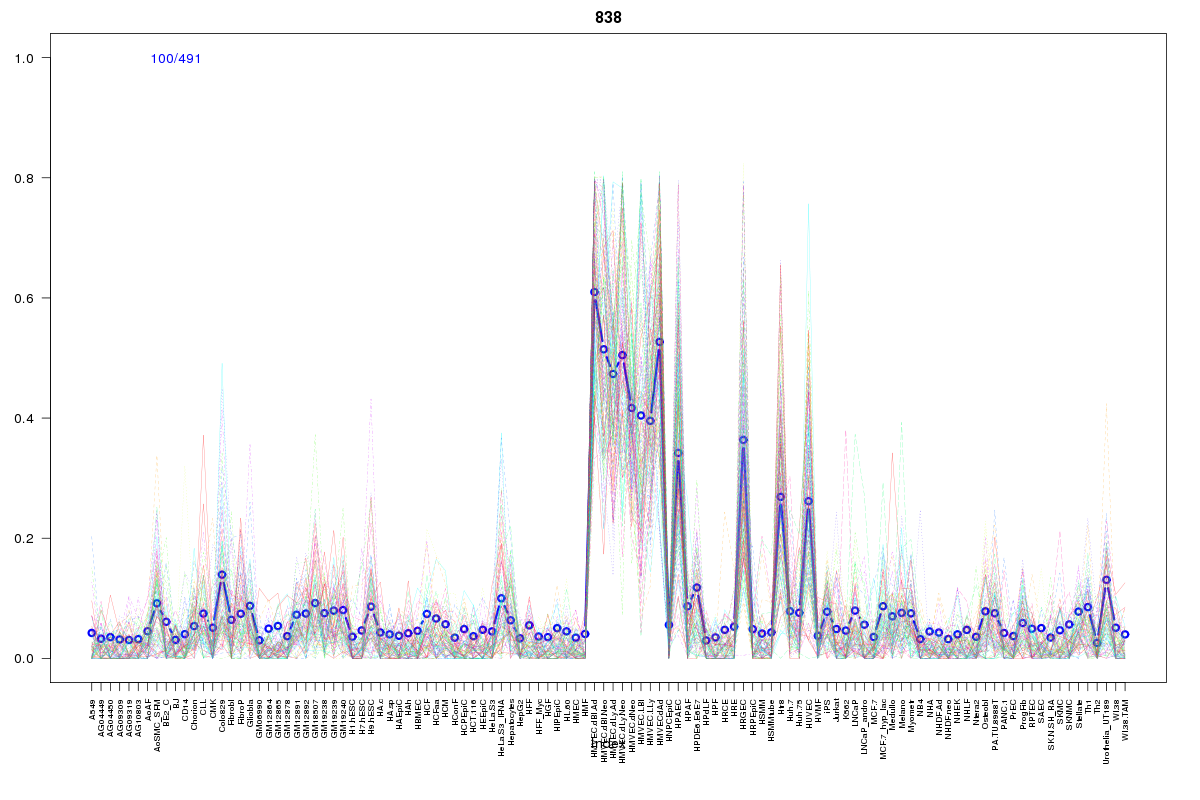 | 838 | 1 |
 | 2404 | 1 |
 | 2178 | 1 |
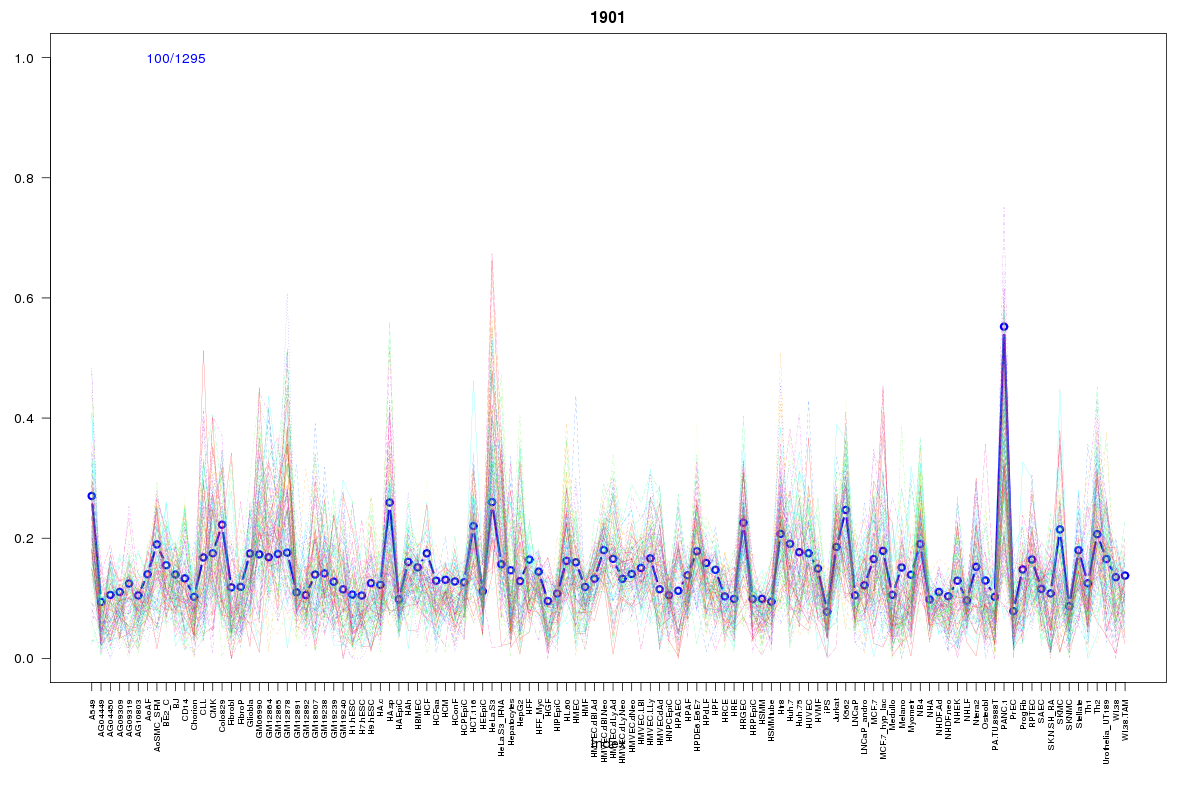 | 1901 | 1 |
 | 421 | 1 |
 | 629 | 1 |
 | 2017 | 1 |
 | 2059 | 1 |
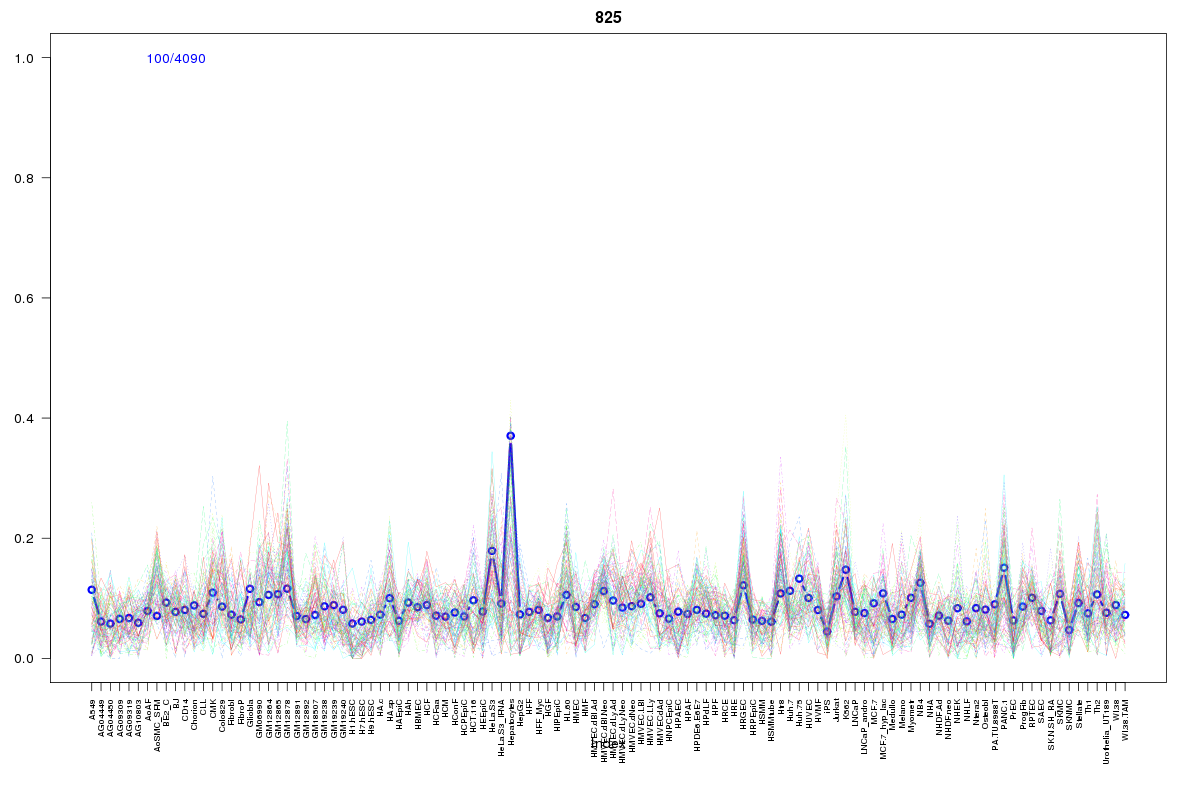 | 825 | 1 |
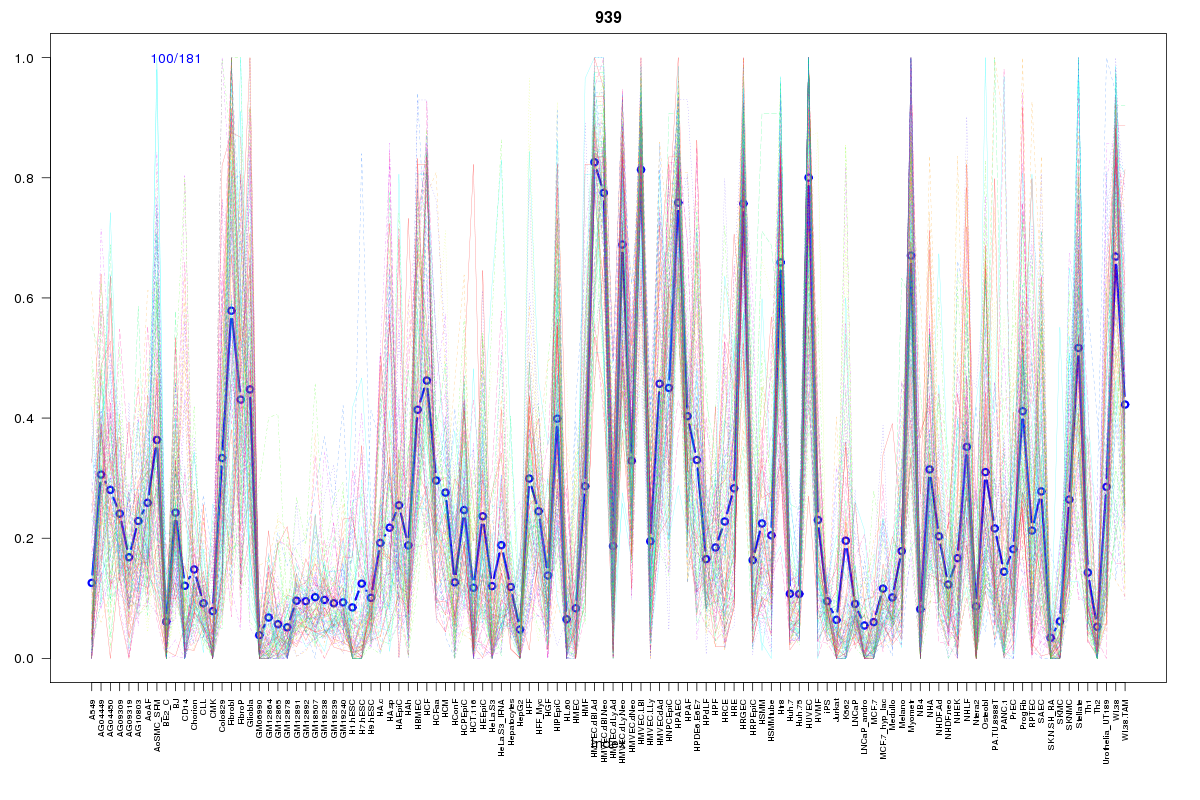 | 939 | 1 |
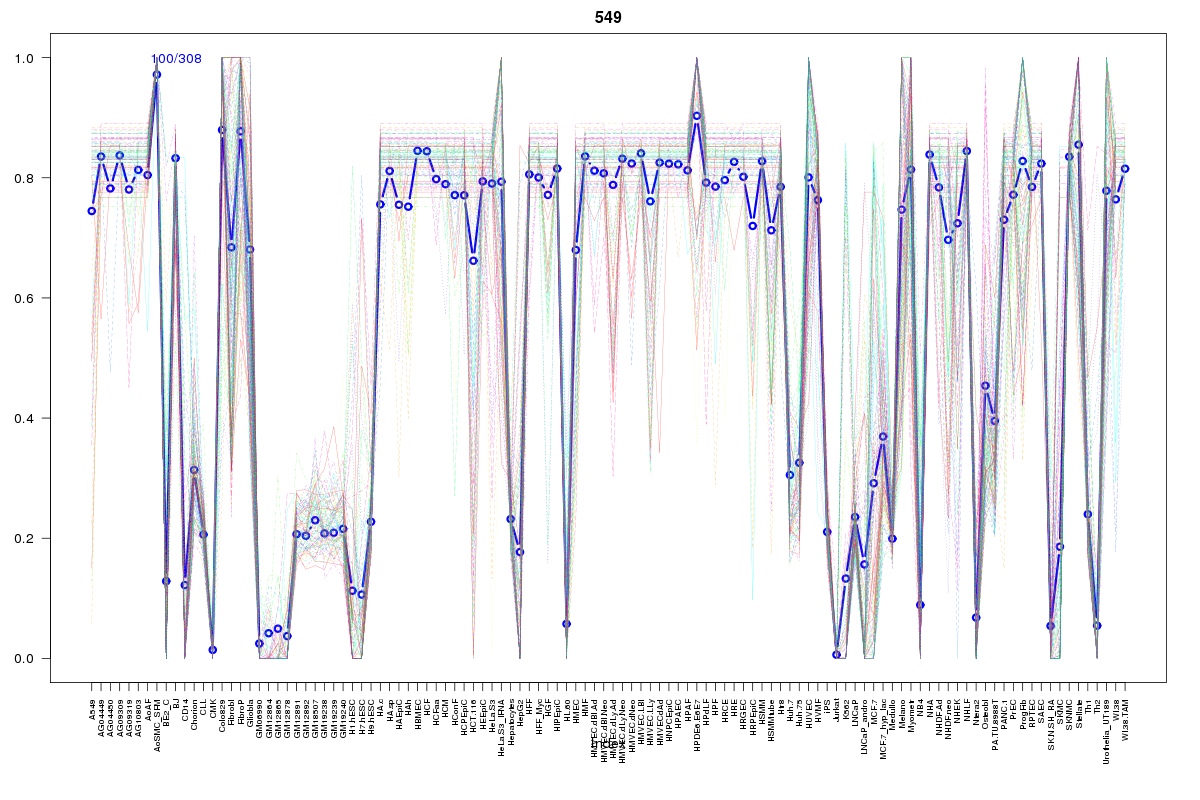 | 549 | 1 |
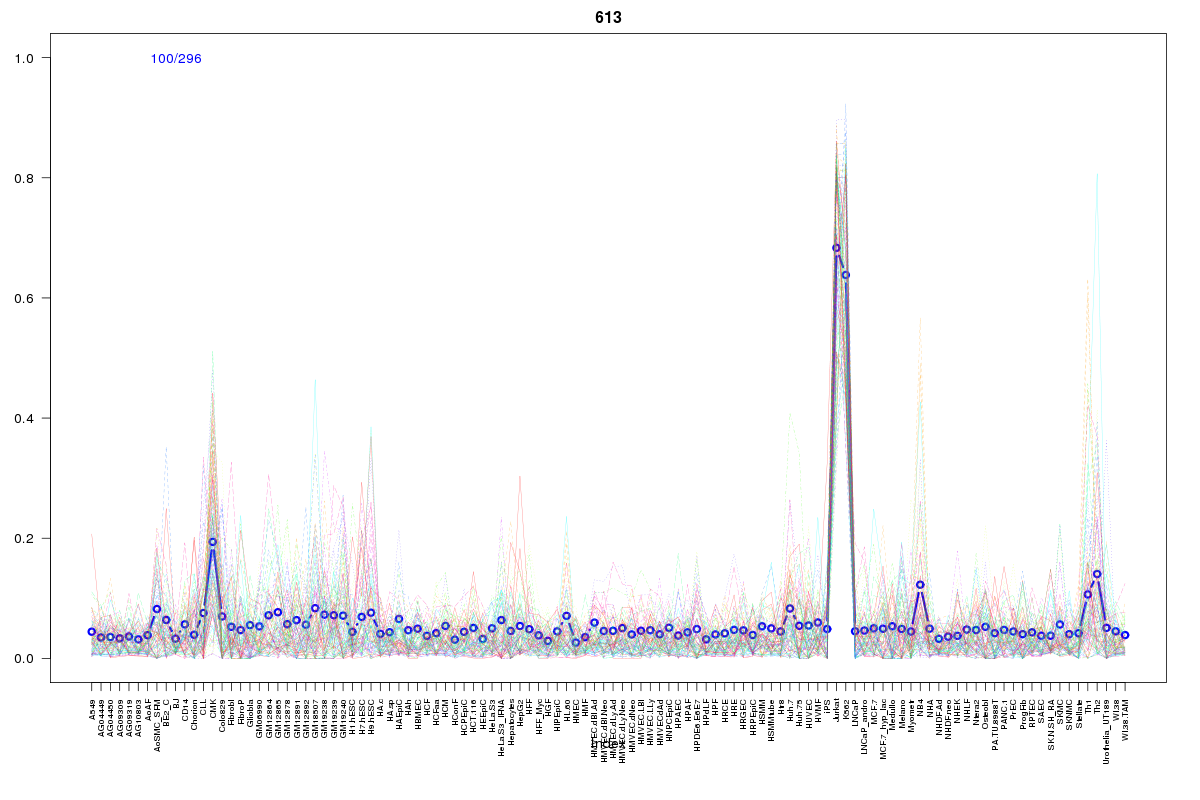 | 613 | 1 |
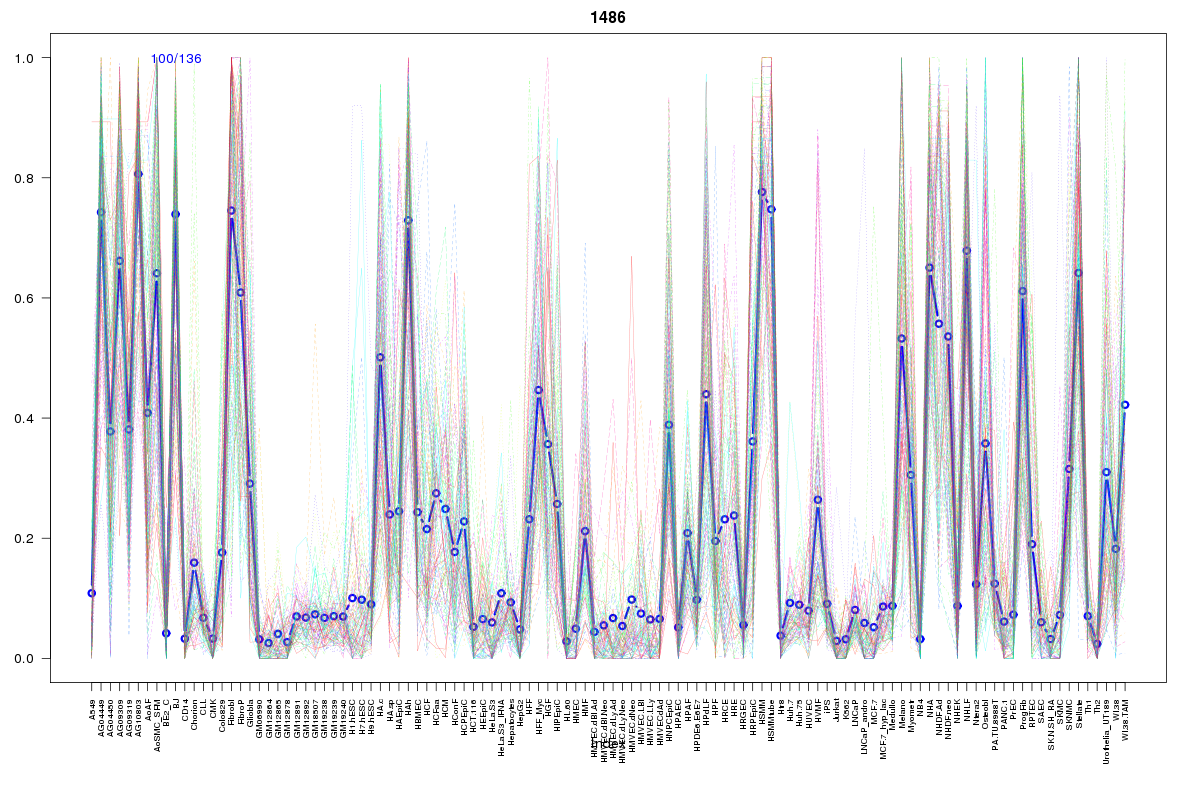 | 1486 | 1 |
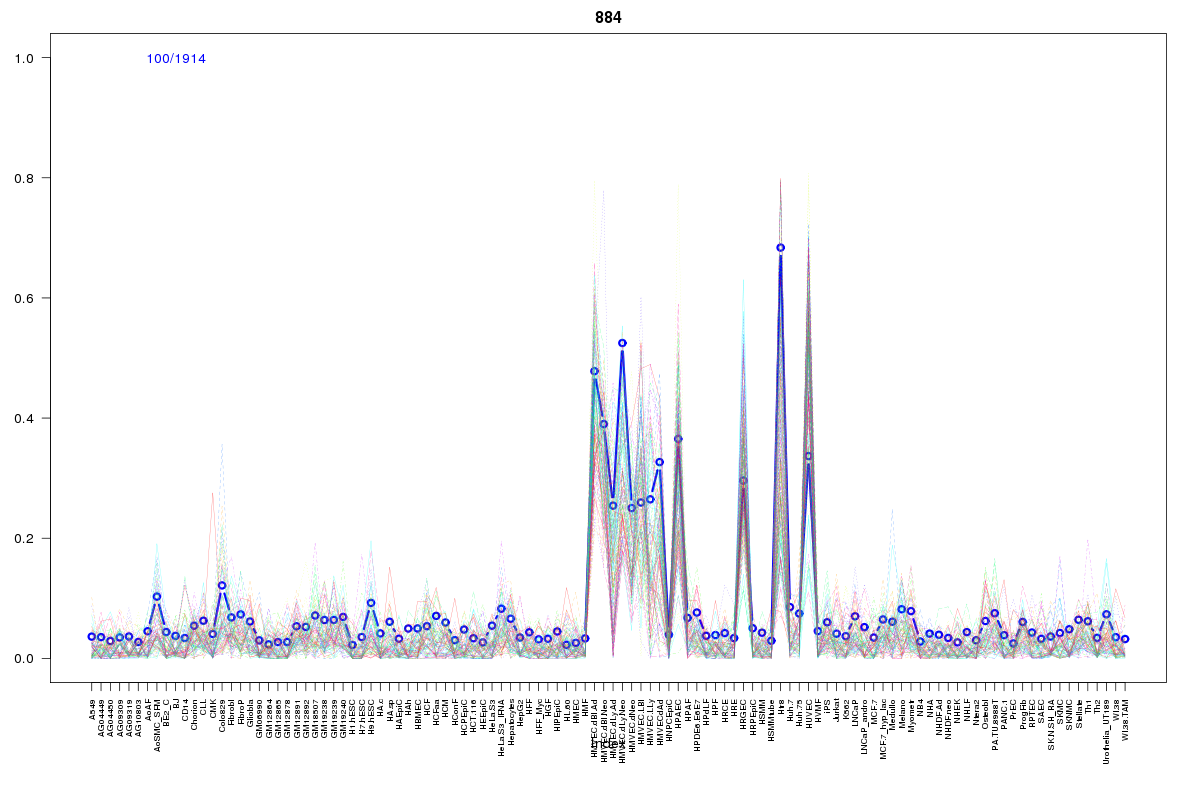 | 884 | 1 |
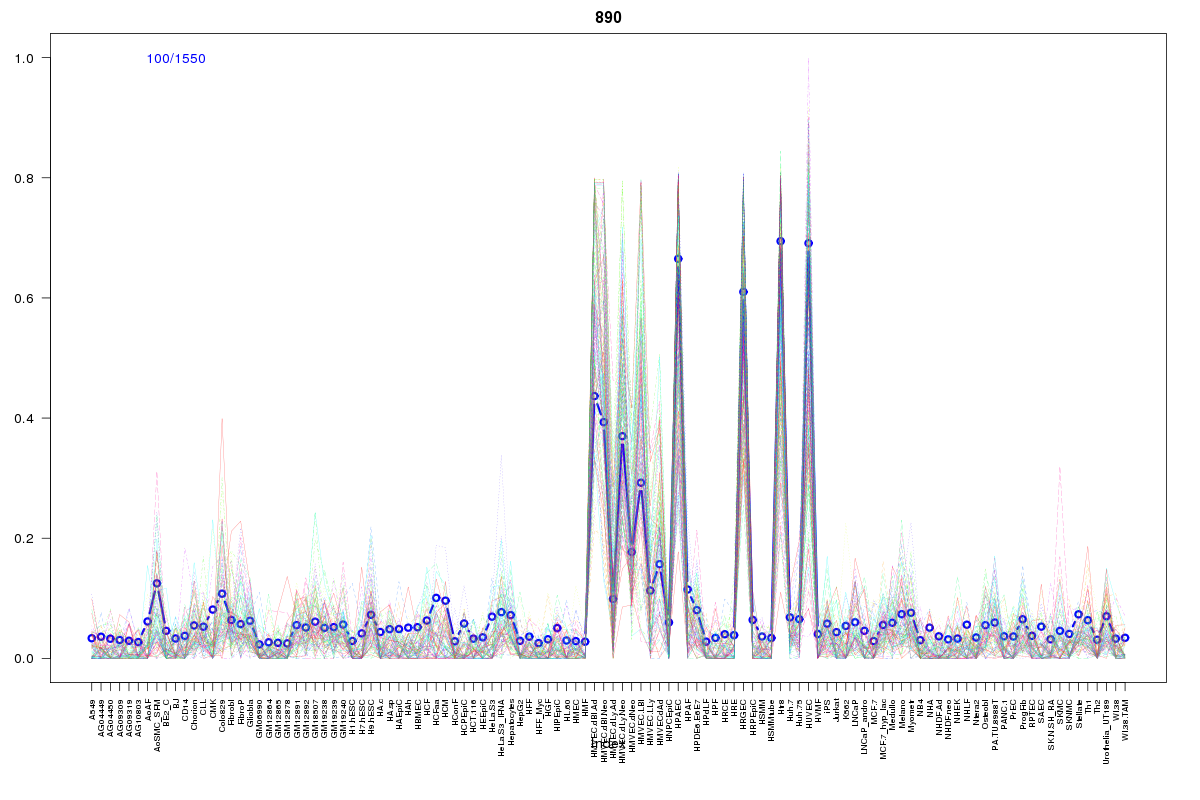 | 890 | 1 |
Resources
BED file downloads
Connects to 27 DHS sitesTop 10 Correlated DHS Sites
p-values indiciate significant higher or lower correlation| Location | Cluster | P-value |
|---|---|---|
| chr2:55458965-55459115 | 1901 | 0 |
| chr2:55463520-55463670 | 2017 | 0 |
| chr2:55459120-55459270 | 421 | 0.001 |
| chr2:55463360-55463510 | 615 | 0.001 |
| chr2:55464160-55464310 | 470 | 0.004 |
| chr2:55510700-55510850 | 615 | 0.004 |
| chr2:55496940-55497090 | 825 | 0.005 |
| chr2:55367045-55367195 | 615 | 0.009 |
| chr2:55456440-55456590 | 615 | 0.009 |
| chr2:55458800-55458950 | 2178 | 0.012 |
| chr2:55496745-55496895 | 2059 | 0.013 |
External Databases
UCSCEnsembl (ENSG00000085760)