Gene: ITIH1
chr3: 52811602-52826077Expression Profile
(log scale)
Graphical Connections
Distribution of linked clusters:
You may find it interesting if many of the connected DHS sites belong to the same cluster.| Cluster Profile | Cluster ID | Number of DHS sites in this cluster |
|---|---|---|
 | 2114 | 5 |
 | 2110 | 3 |
 | 1355 | 3 |
 | 927 | 3 |
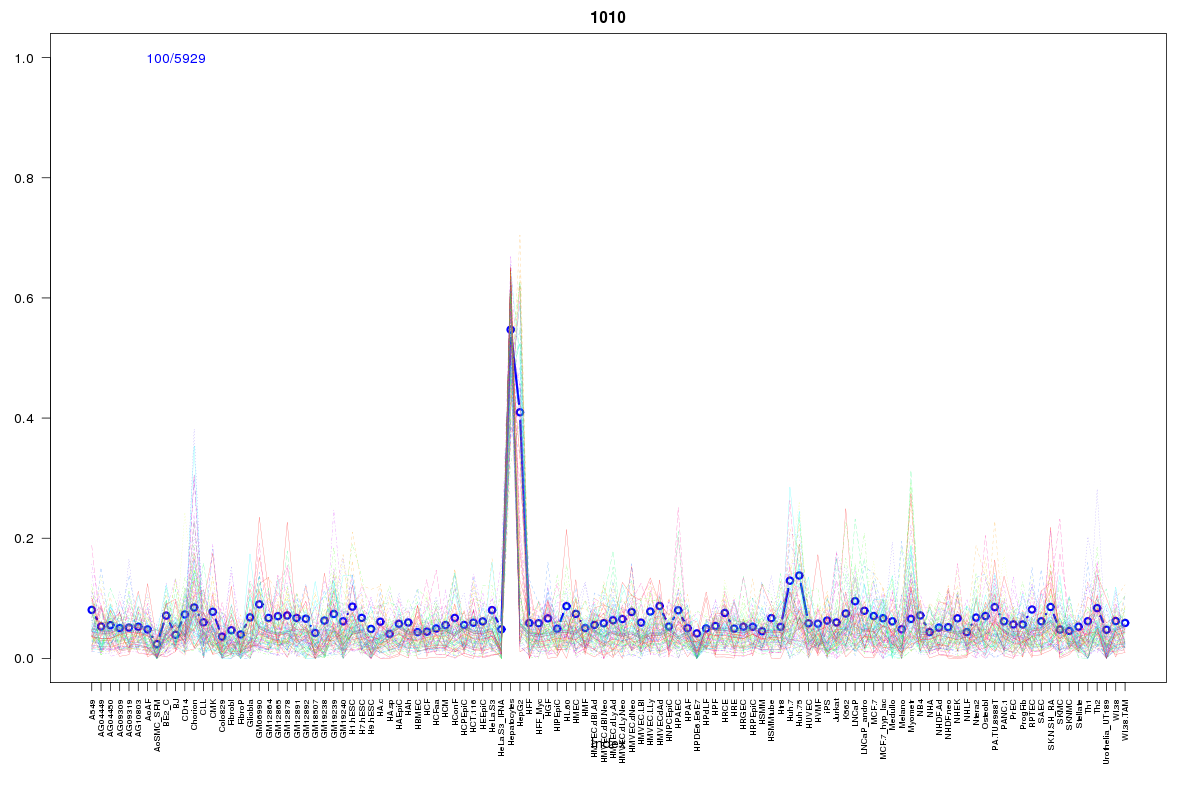 | 1010 | 2 |
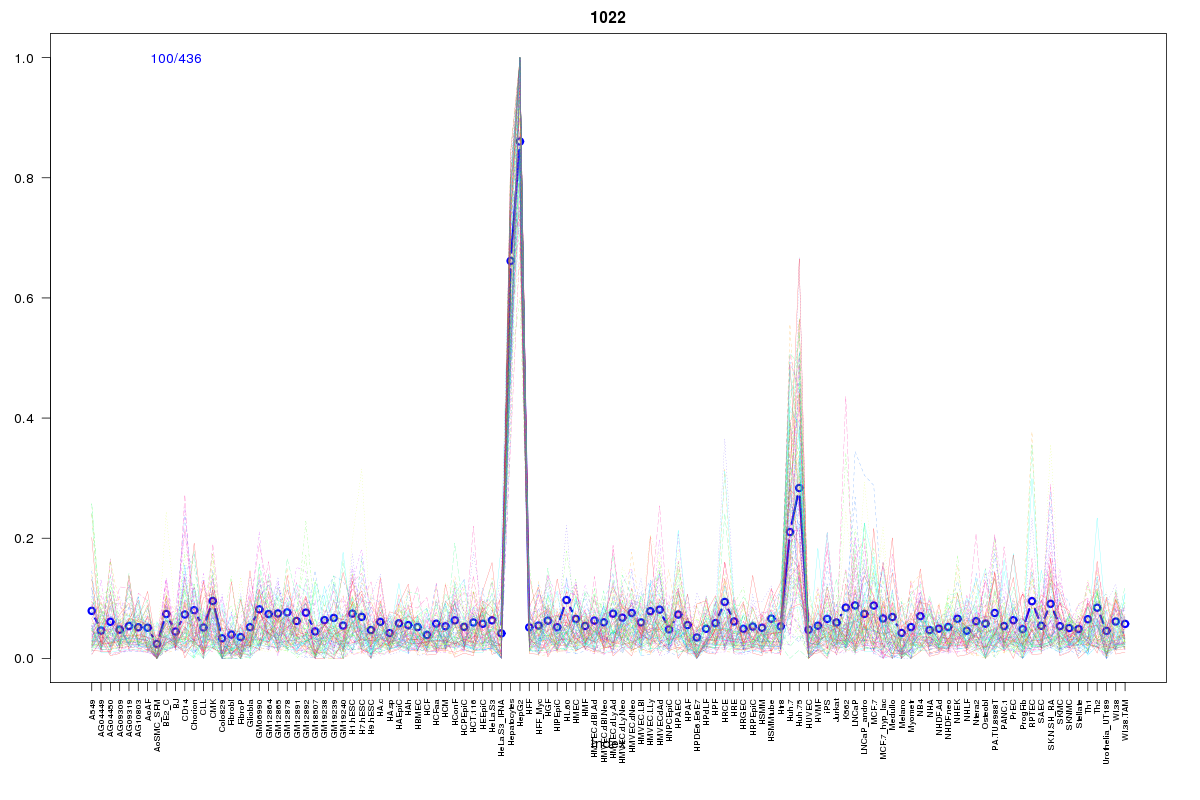 | 1022 | 2 |
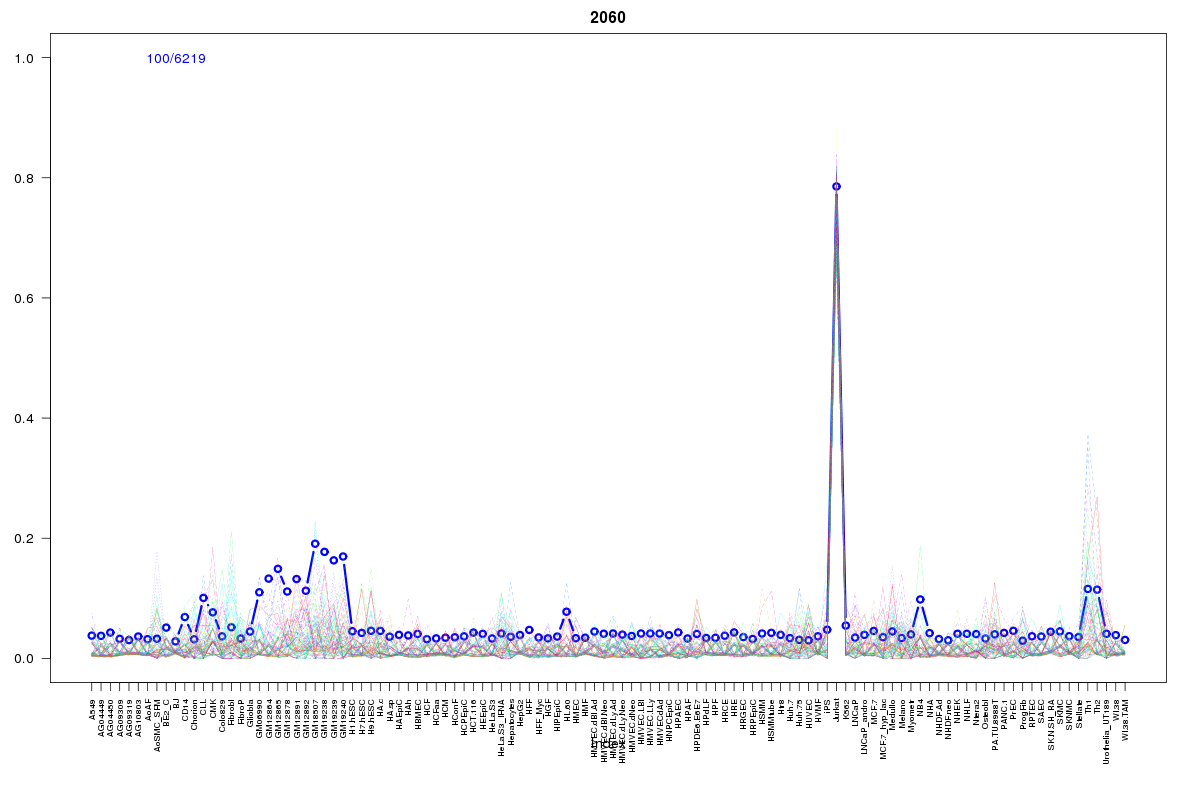 | 2060 | 2 |
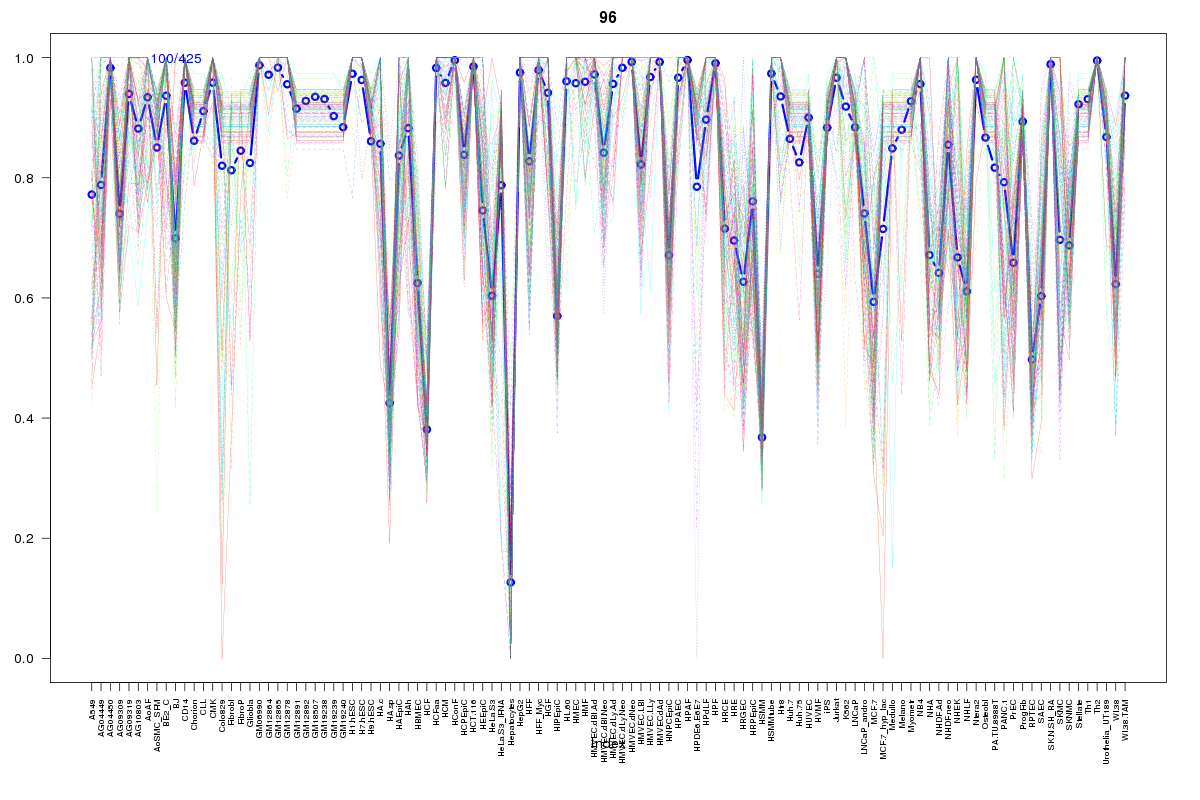 | 96 | 1 |
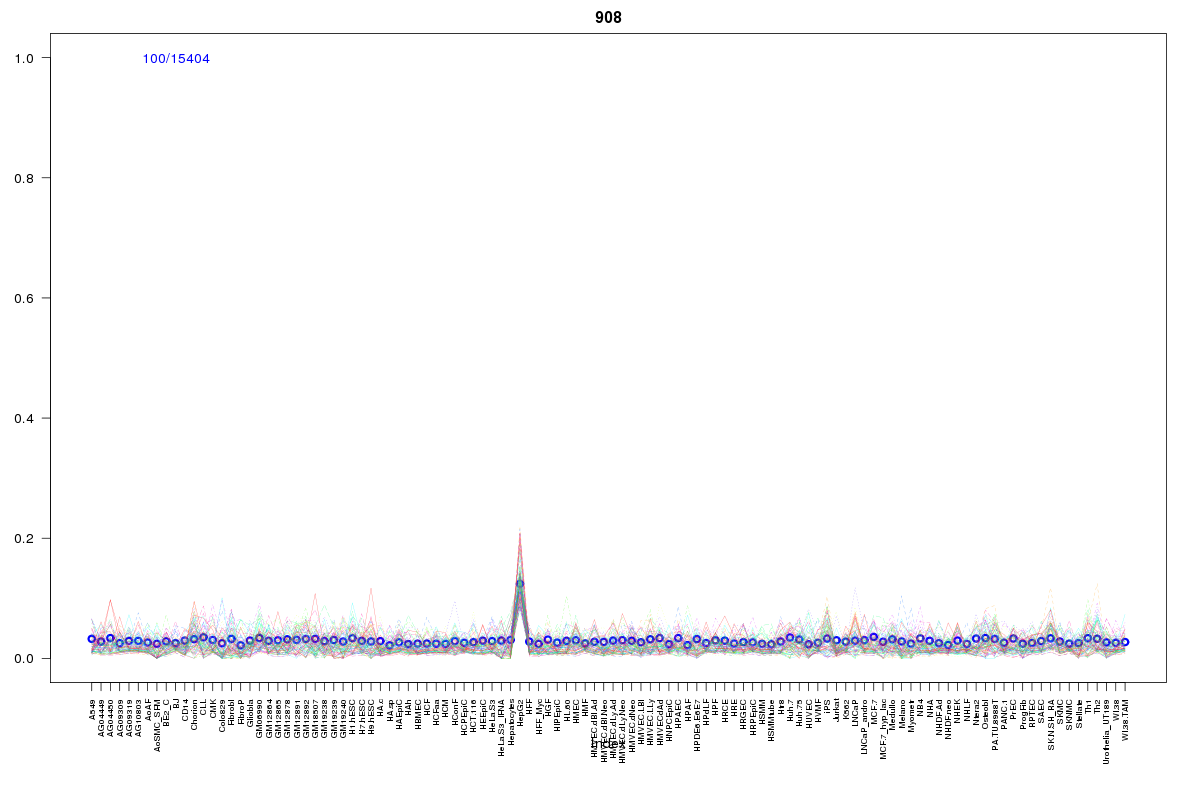 | 908 | 1 |
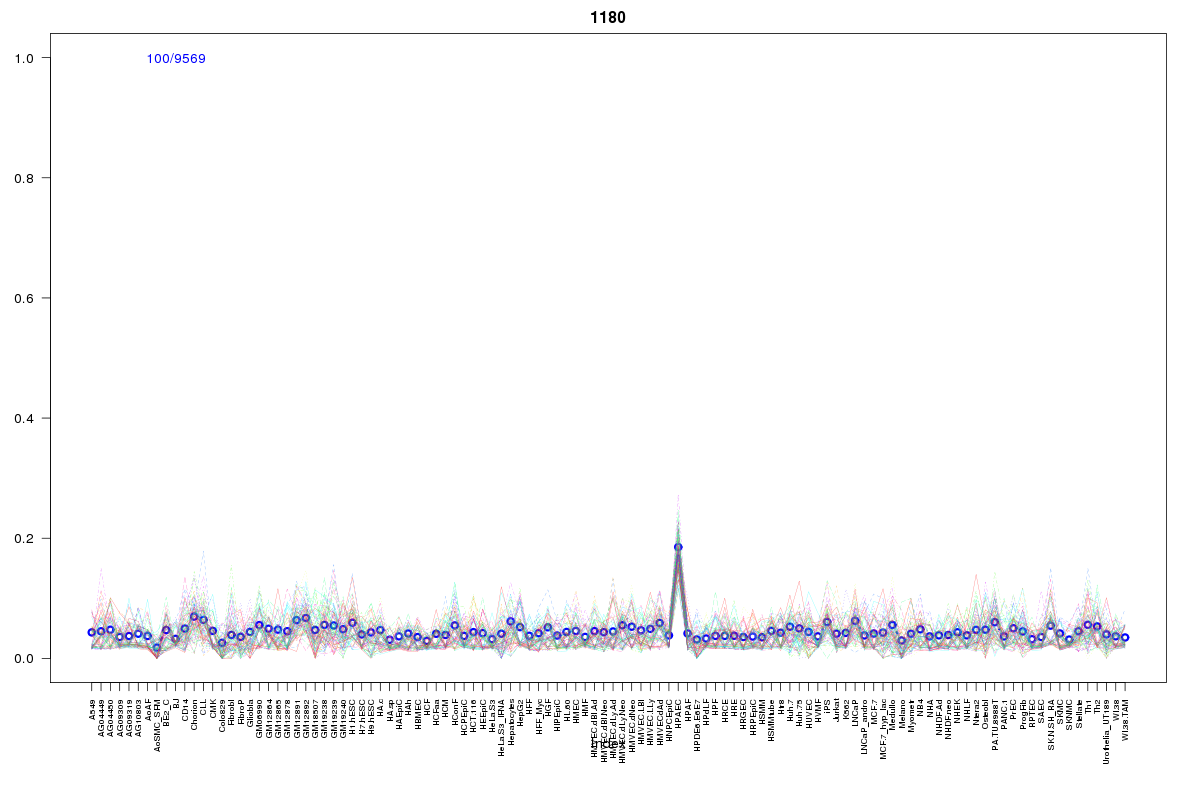 | 1180 | 1 |
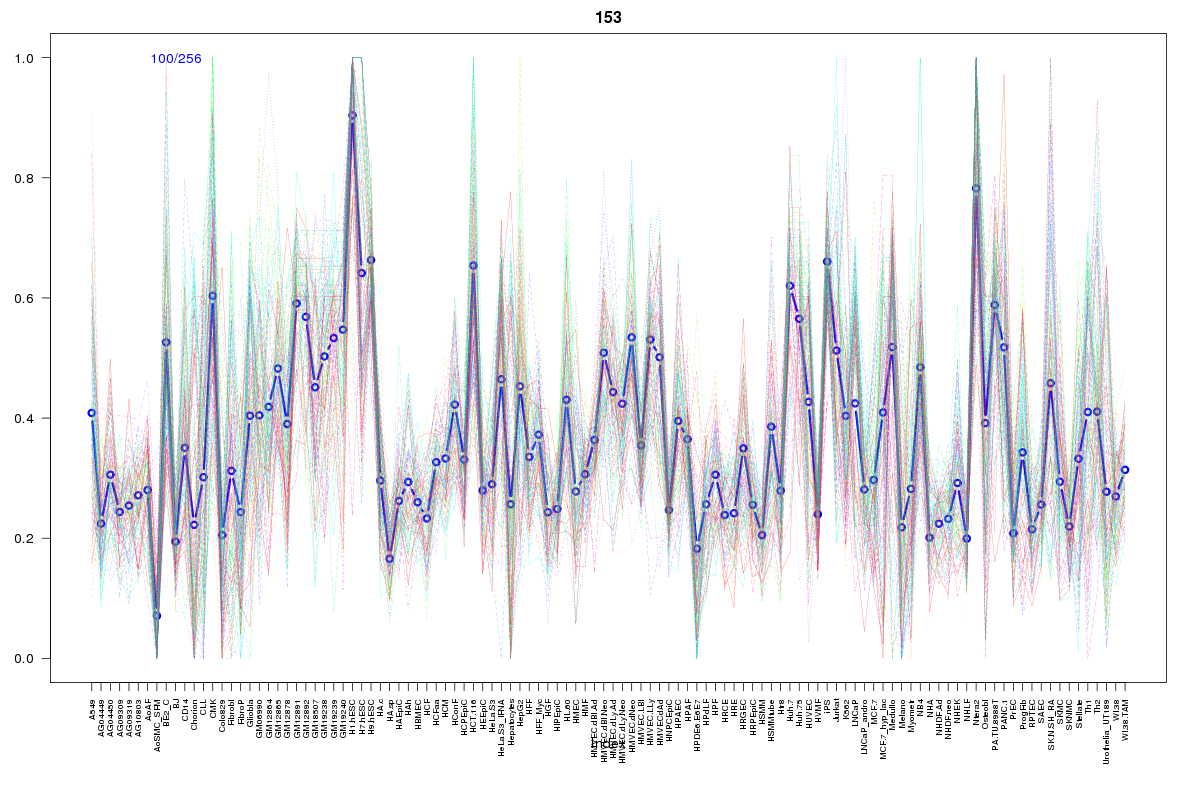 | 153 | 1 |
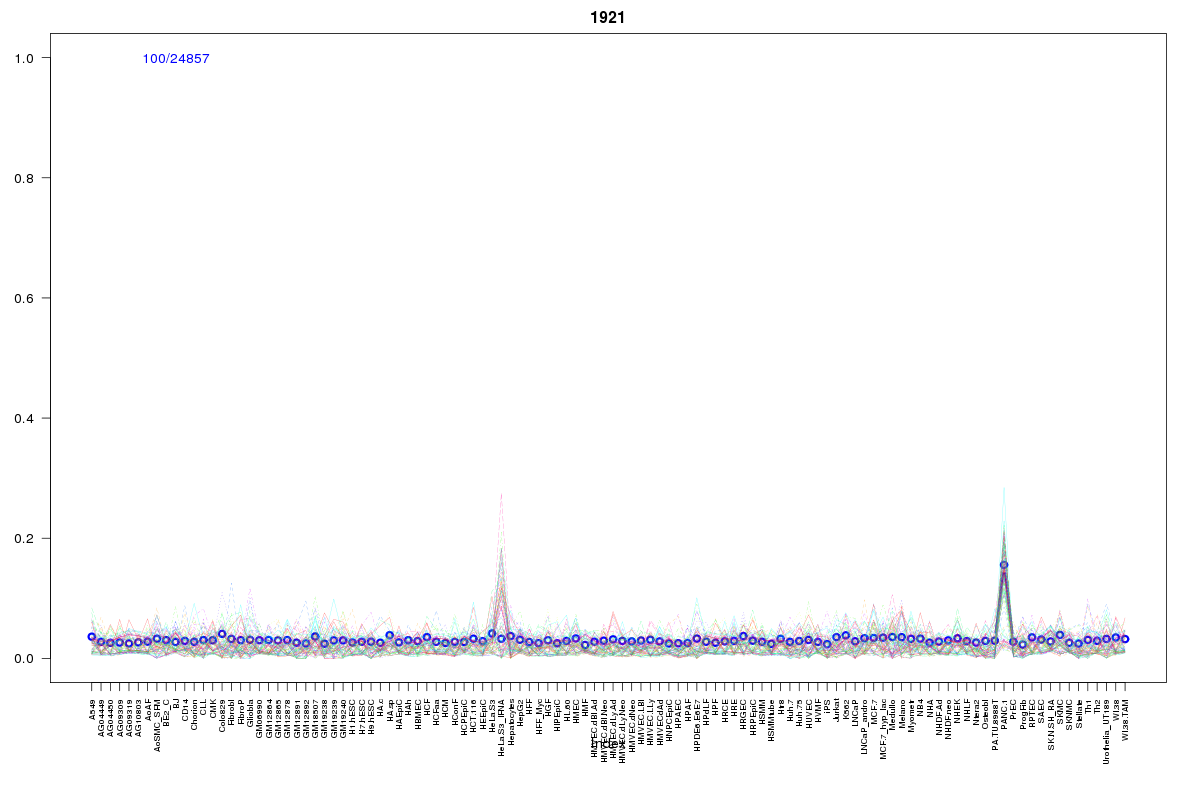 | 1921 | 1 |
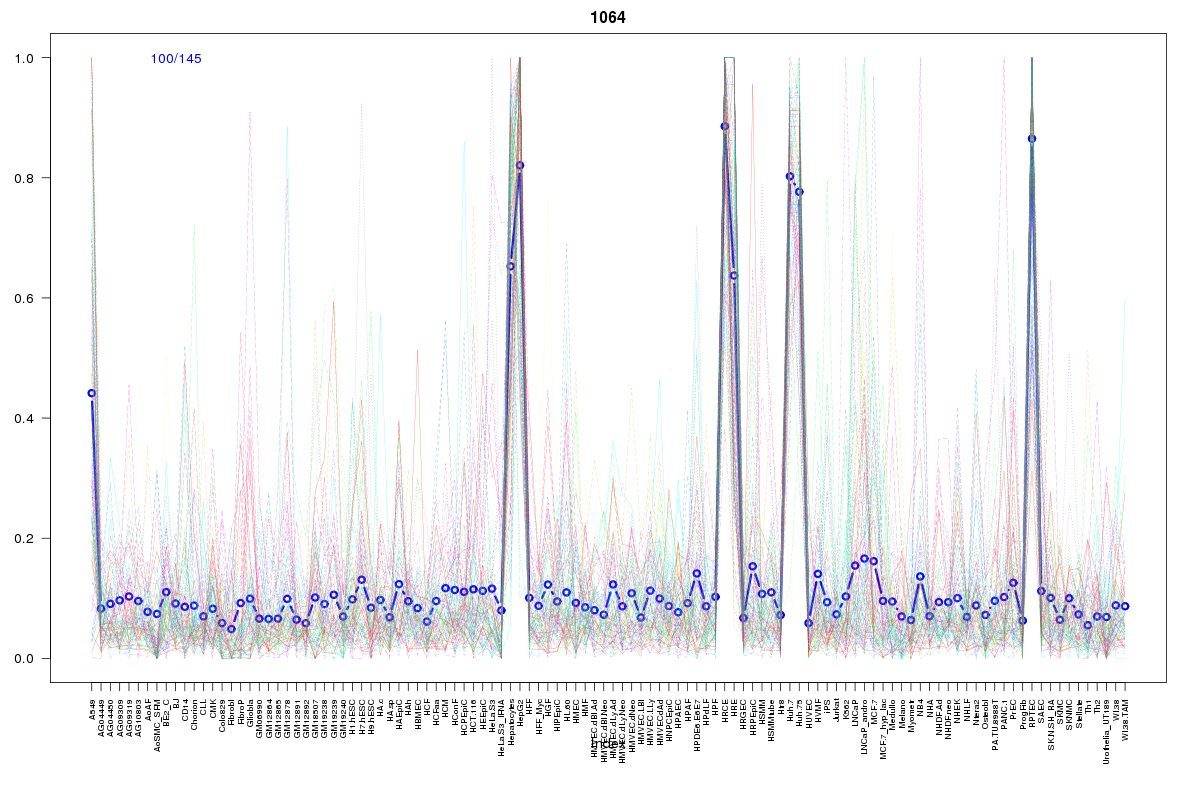 | 1064 | 1 |
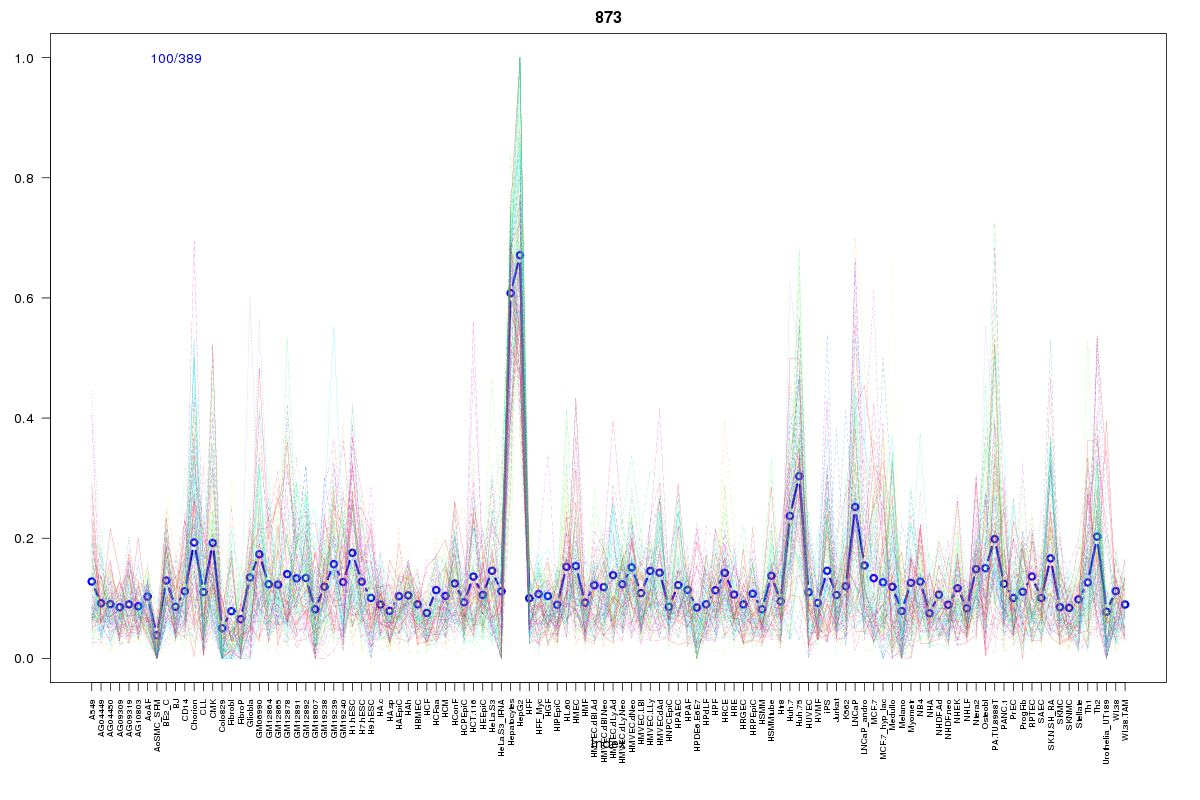 | 873 | 1 |
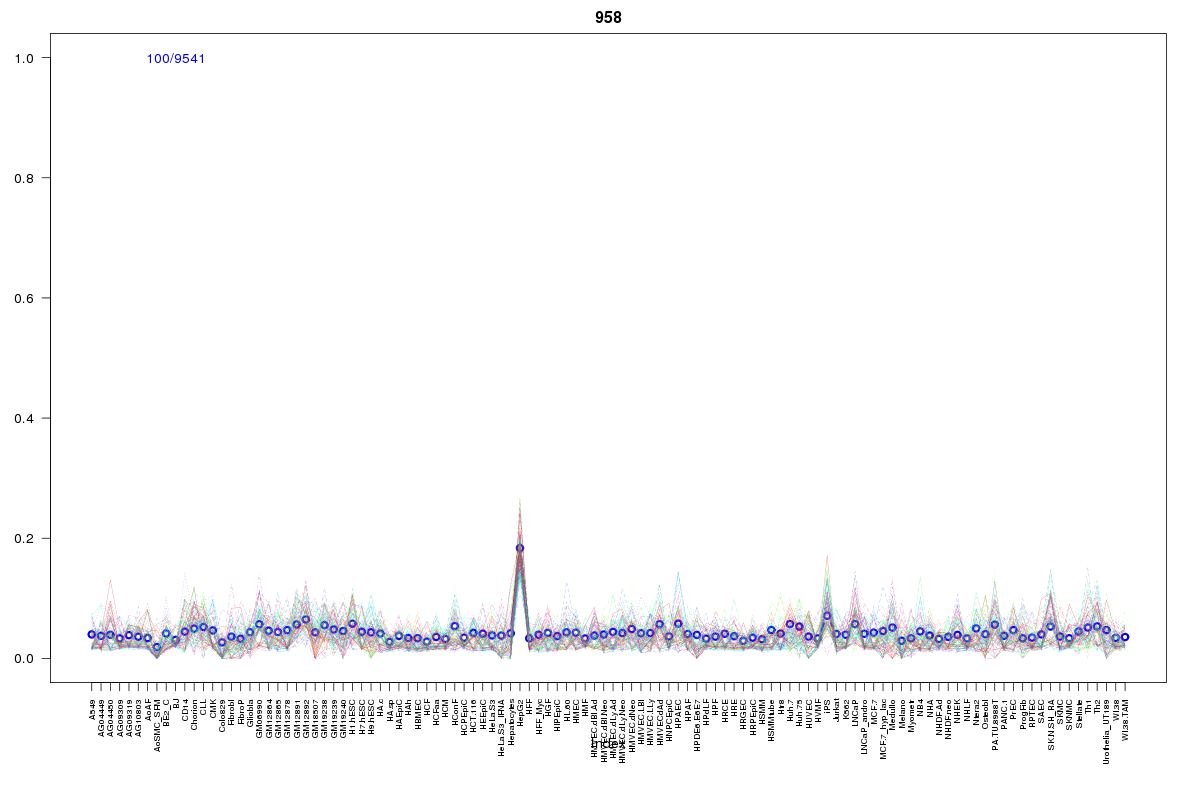 | 958 | 1 |
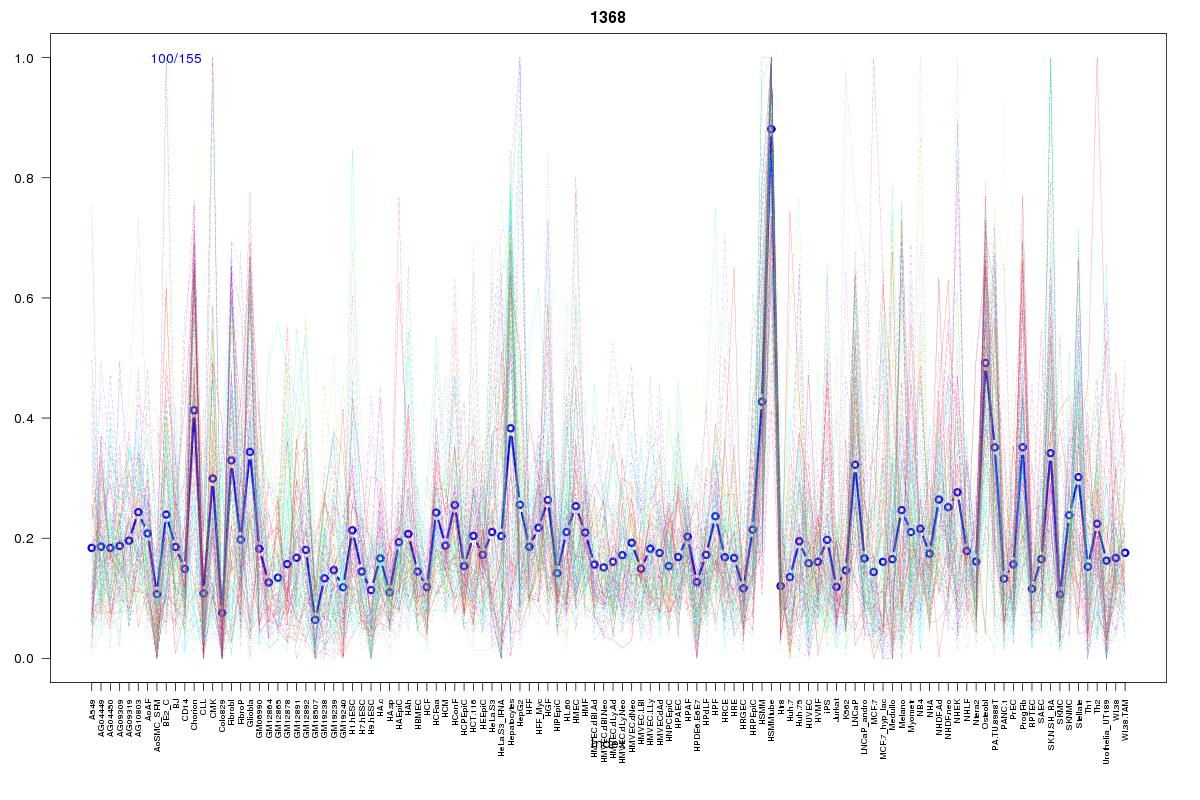 | 1368 | 1 |
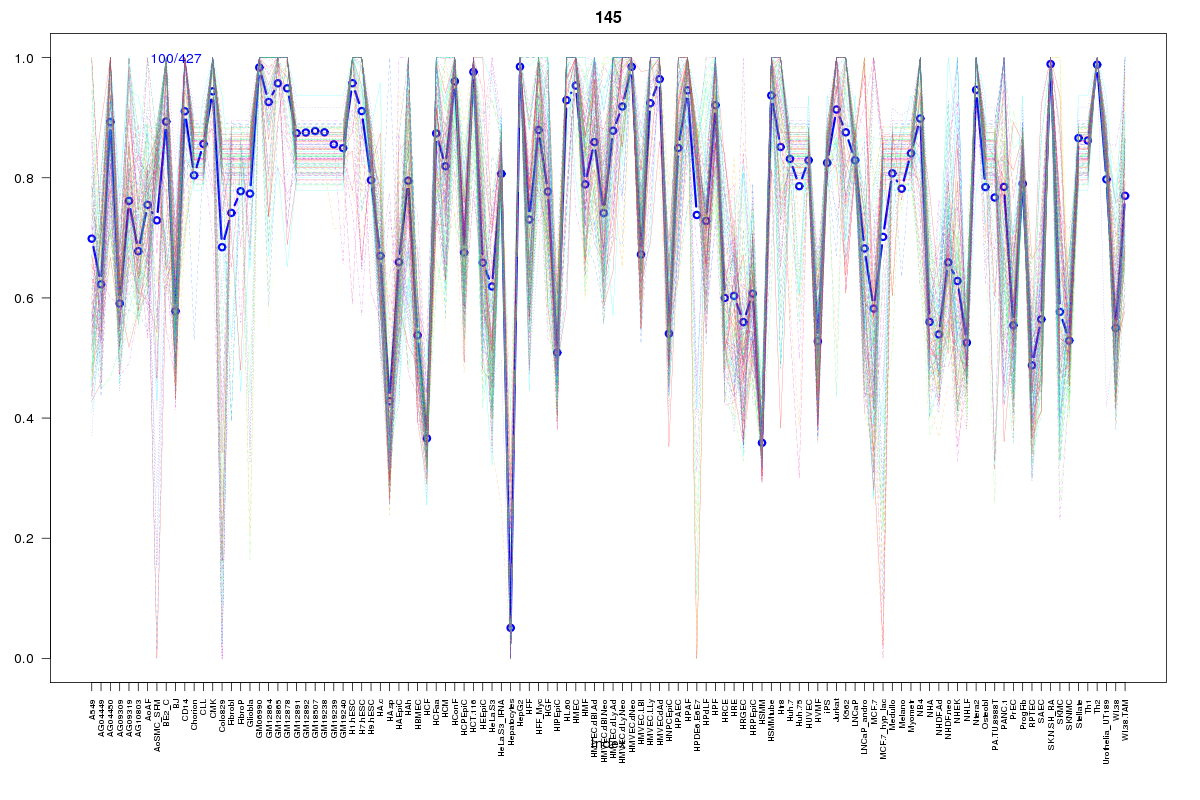 | 145 | 1 |
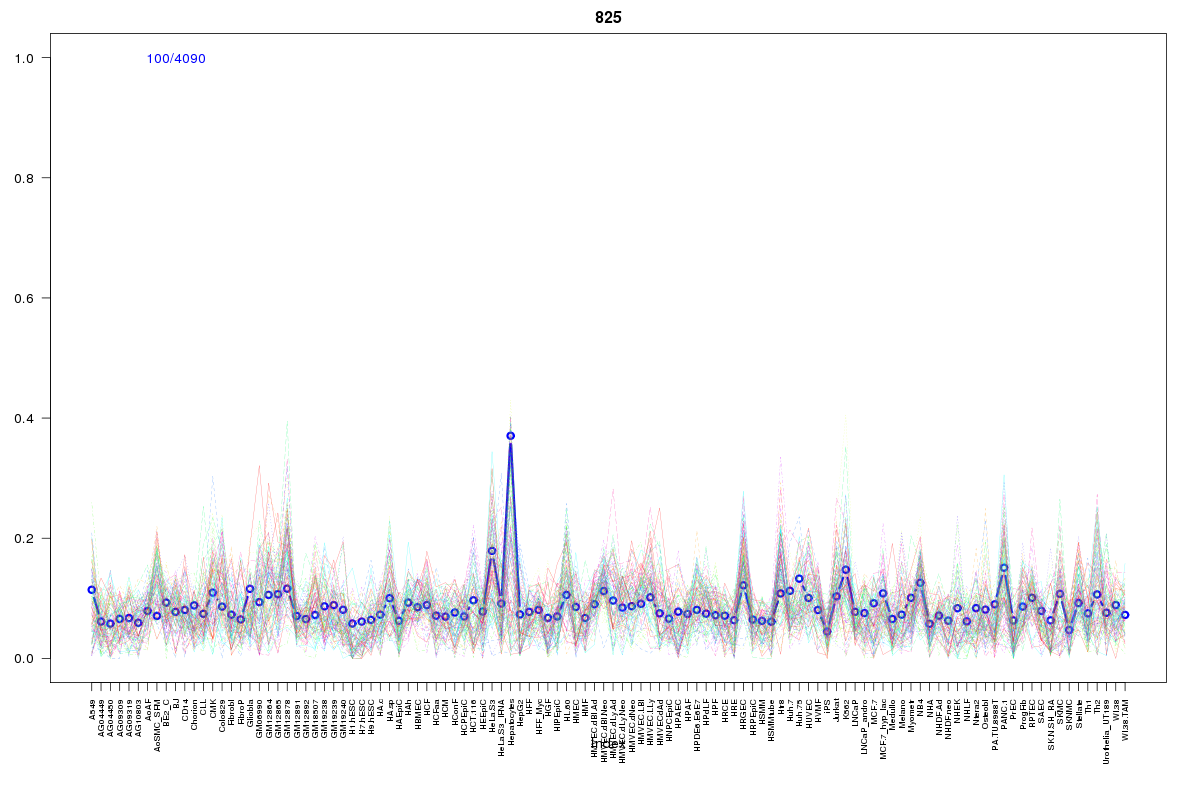 | 825 | 1 |
Resources
BED file downloads
Connects to 31 DHS sitesTop 10 Correlated DHS Sites
p-values indiciate significant higher or lower correlation| Location | Cluster | P-value |
|---|---|---|
| chr3:52878365-52878515 | 927 | 0.005 |
| chr3:52847885-52848035 | 1180 | 0.005 |
| chr3:52828425-52828575 | 1010 | 0.007 |
| chr3:52740865-52741015 | 825 | 0.007 |
| chr3:52865065-52865215 | 927 | 0.007 |
| chr3:52845065-52845215 | 1010 | 0.008 |
| chr3:52828680-52828830 | 1022 | 0.008 |
| chr3:52808505-52808655 | 908 | 0.008 |
| chr3:52828140-52828290 | 1355 | 0.011 |
| chr3:52845885-52846035 | 1022 | 0.011 |
| chr3:52863585-52863735 | 958 | 0.011 |
External Databases
UCSCEnsembl (ENSG00000055957)