Gene: ATP9A
chr20: 50213052-50385173Expression Profile
(log scale)
Graphical Connections
Distribution of linked clusters:
You may find it interesting if many of the connected DHS sites belong to the same cluster.| Cluster Profile | Cluster ID | Number of DHS sites in this cluster |
|---|---|---|
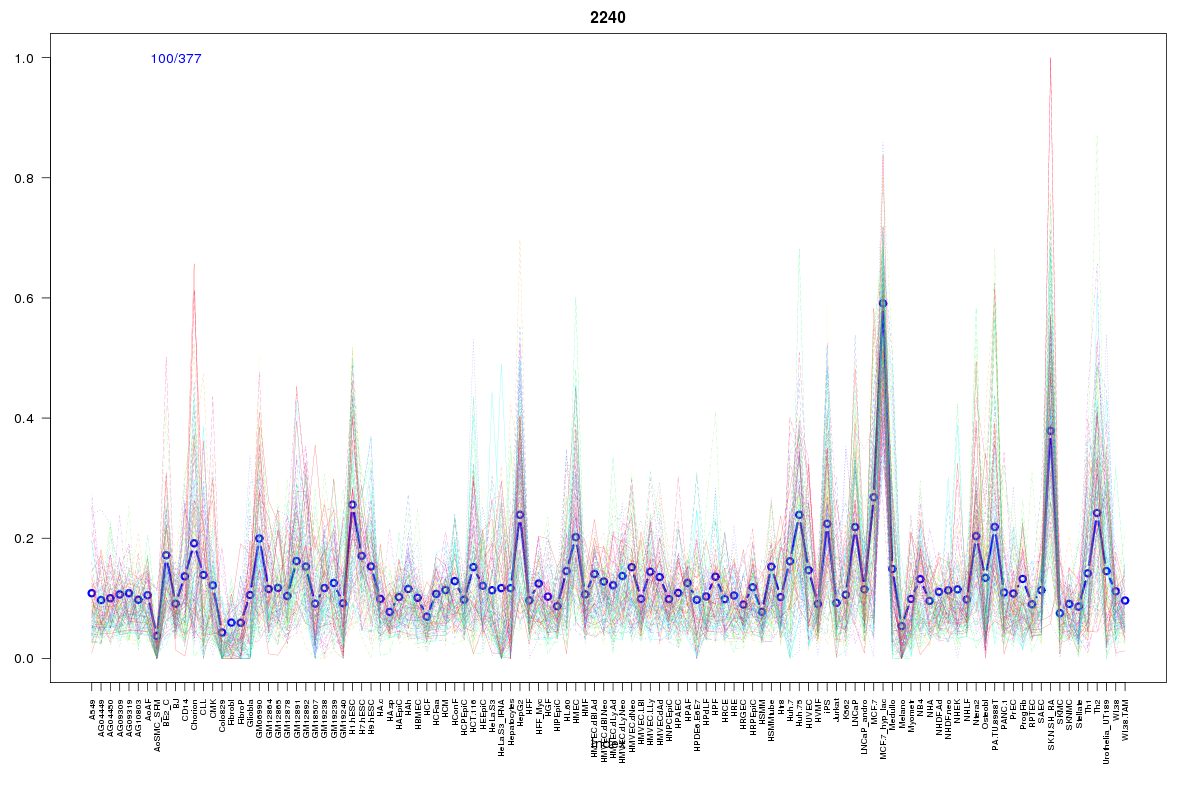 | 2240 | 4 |
 | 1605 | 3 |
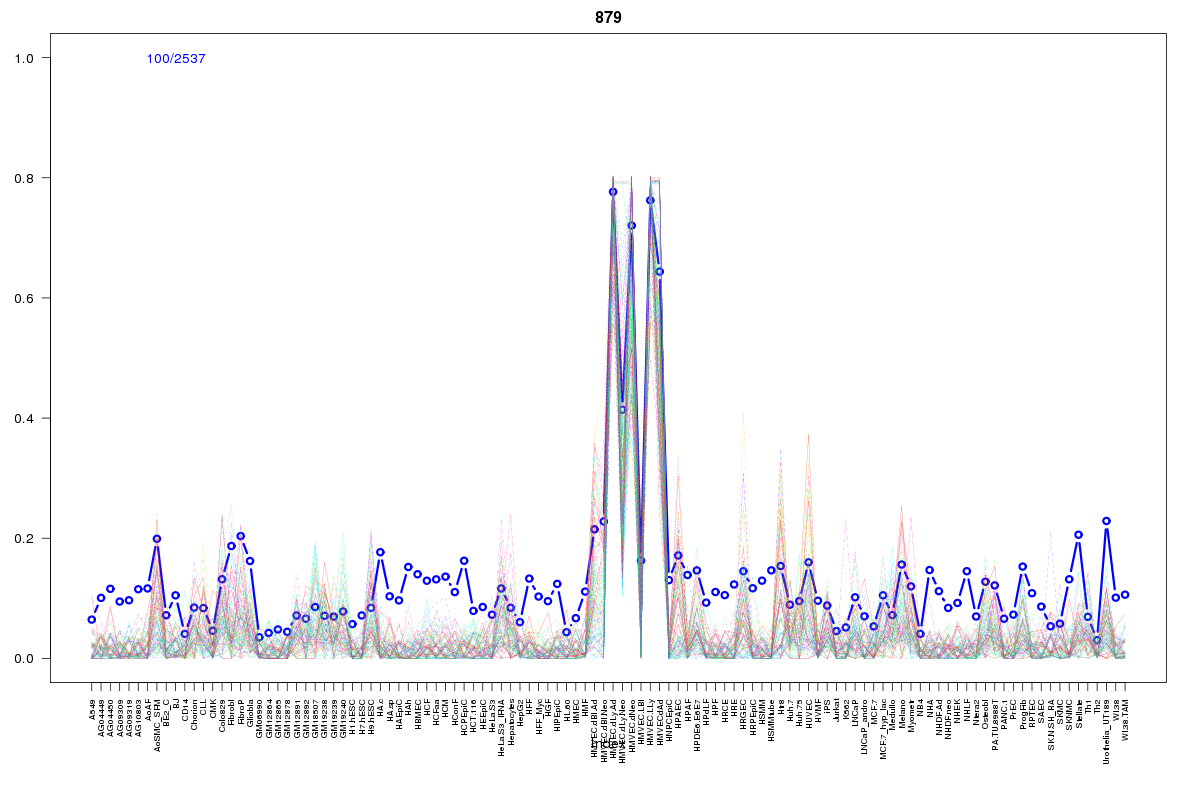 | 879 | 3 |
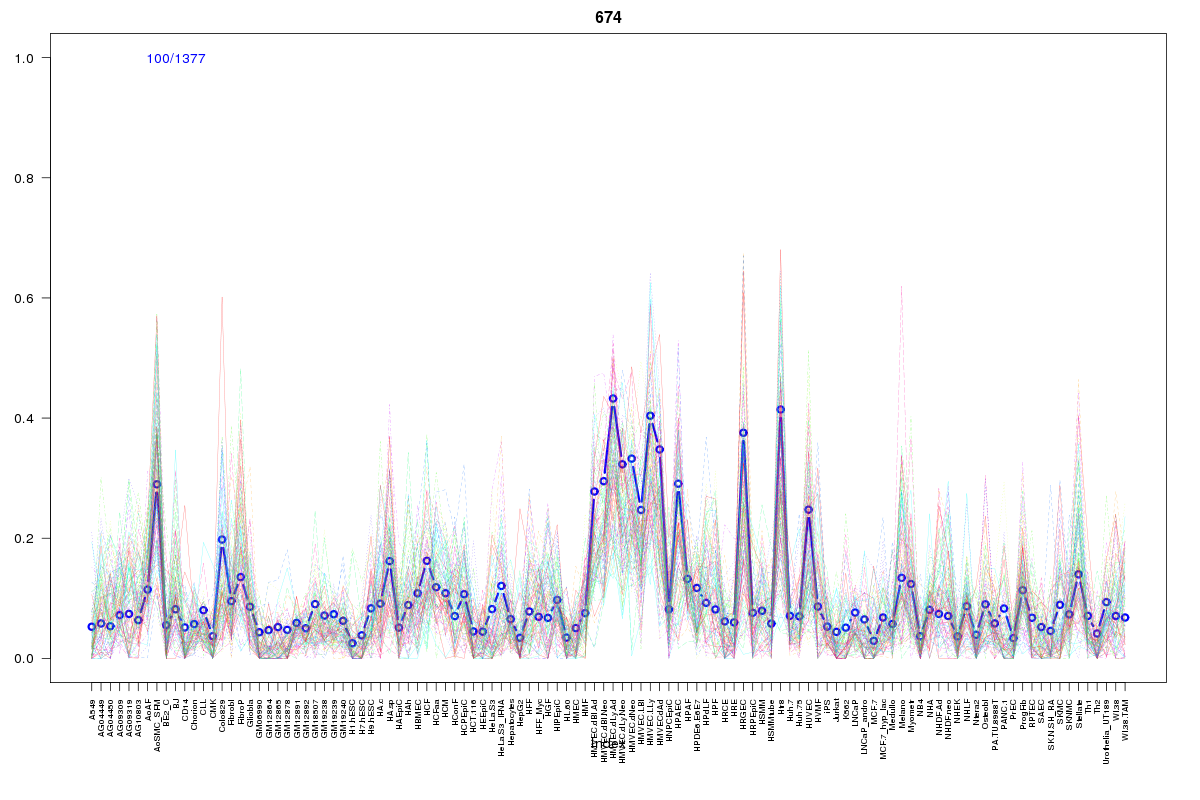 | 674 | 3 |
 | 687 | 2 |
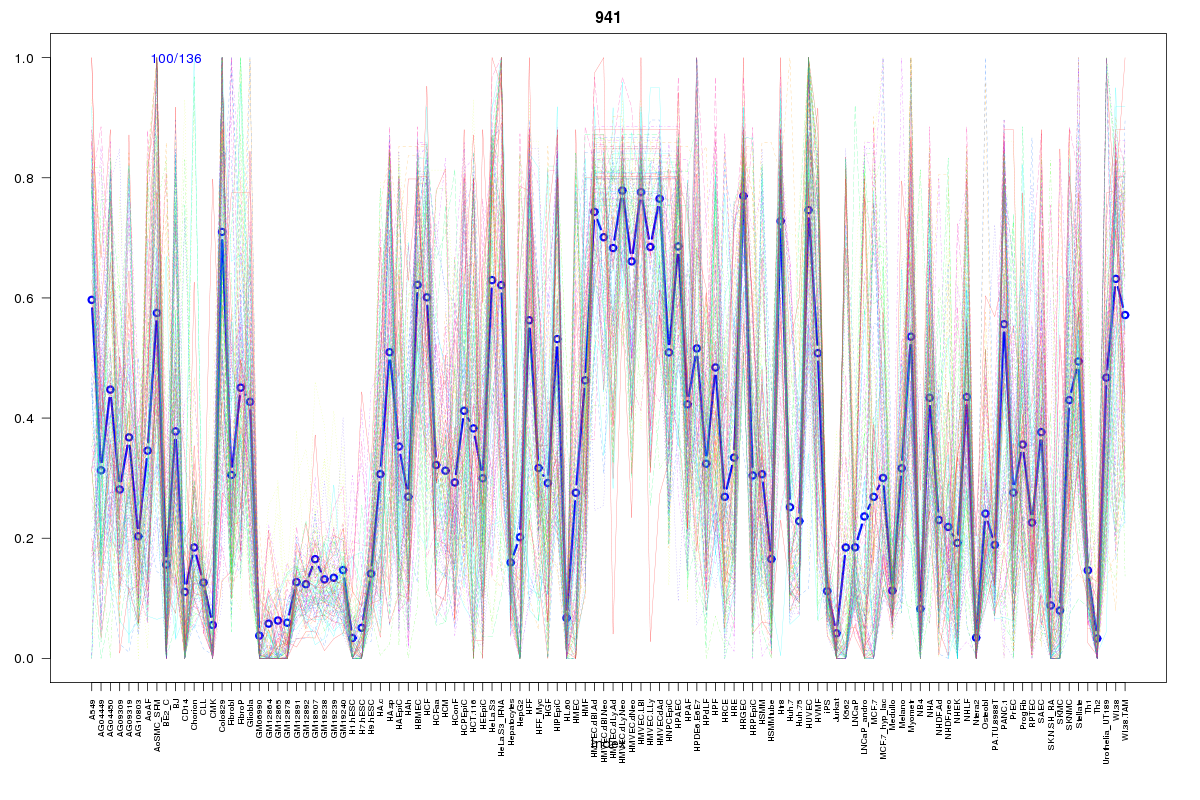 | 941 | 2 |
 | 2201 | 2 |
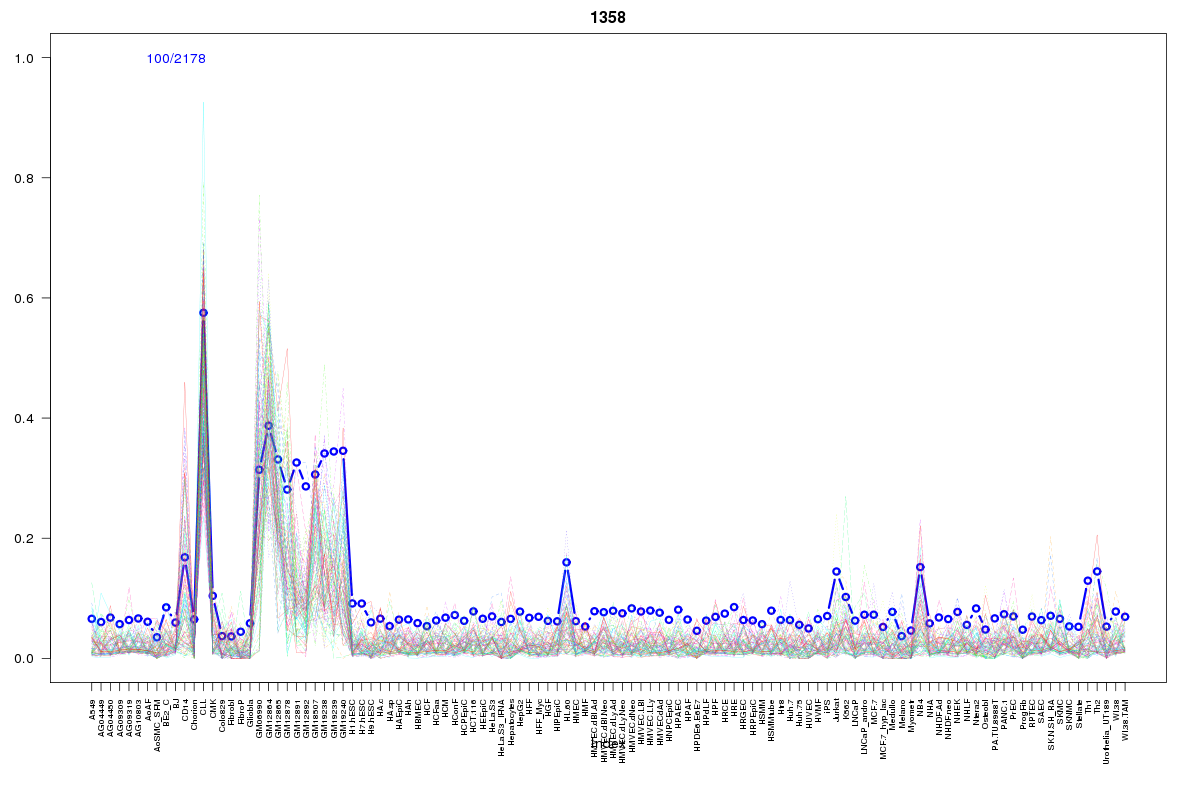 | 1358 | 2 |
 | 979 | 2 |
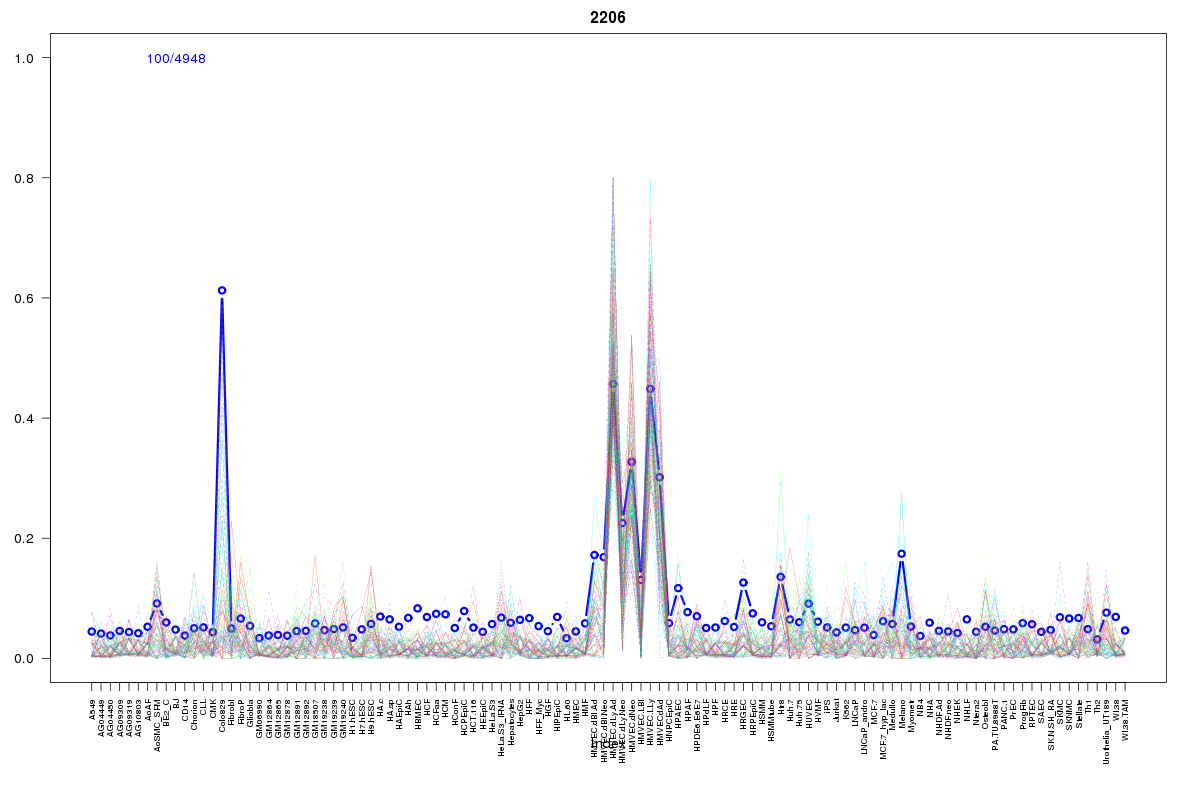 | 2206 | 2 |
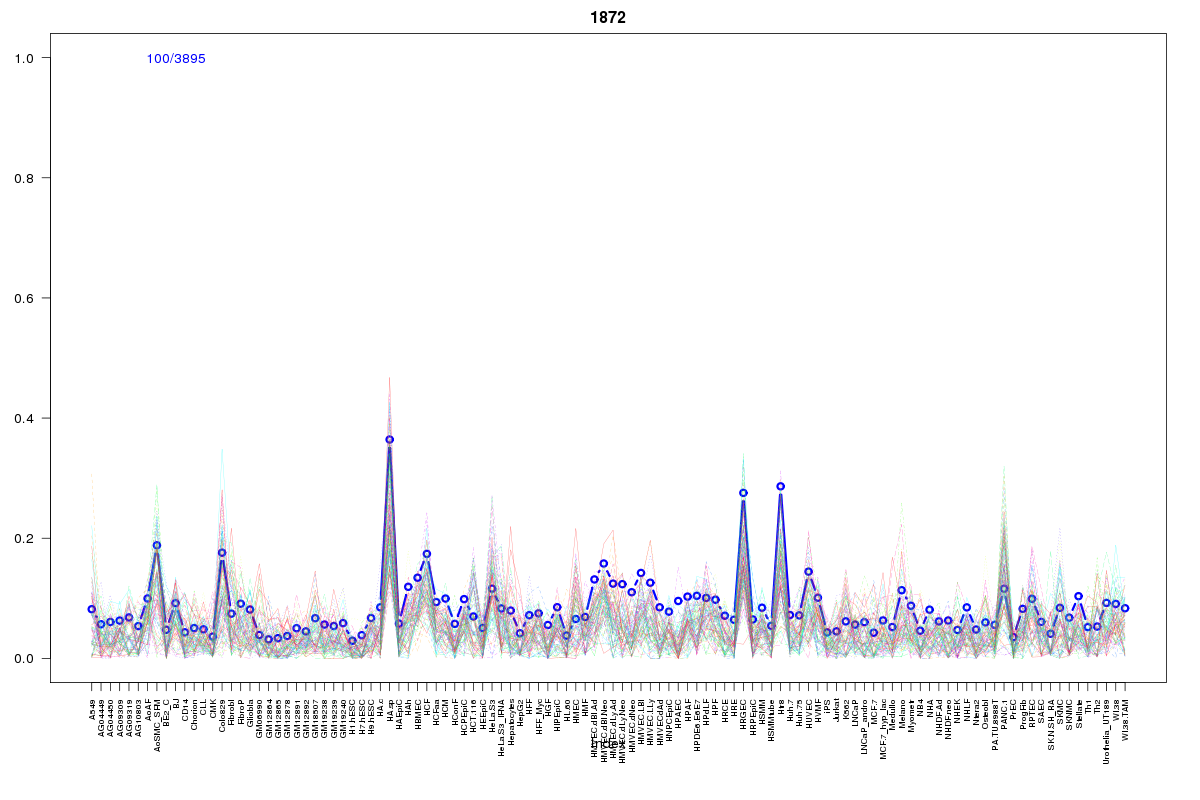 | 1872 | 2 |
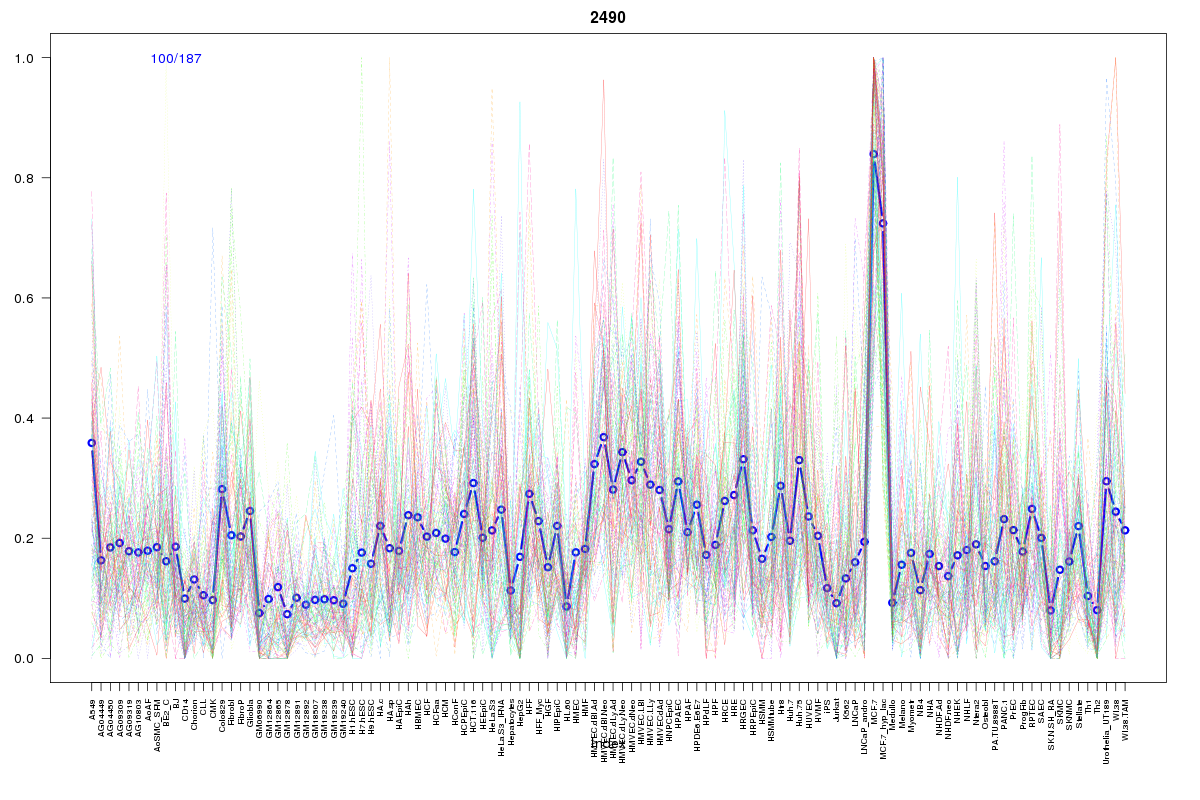 | 2490 | 2 |
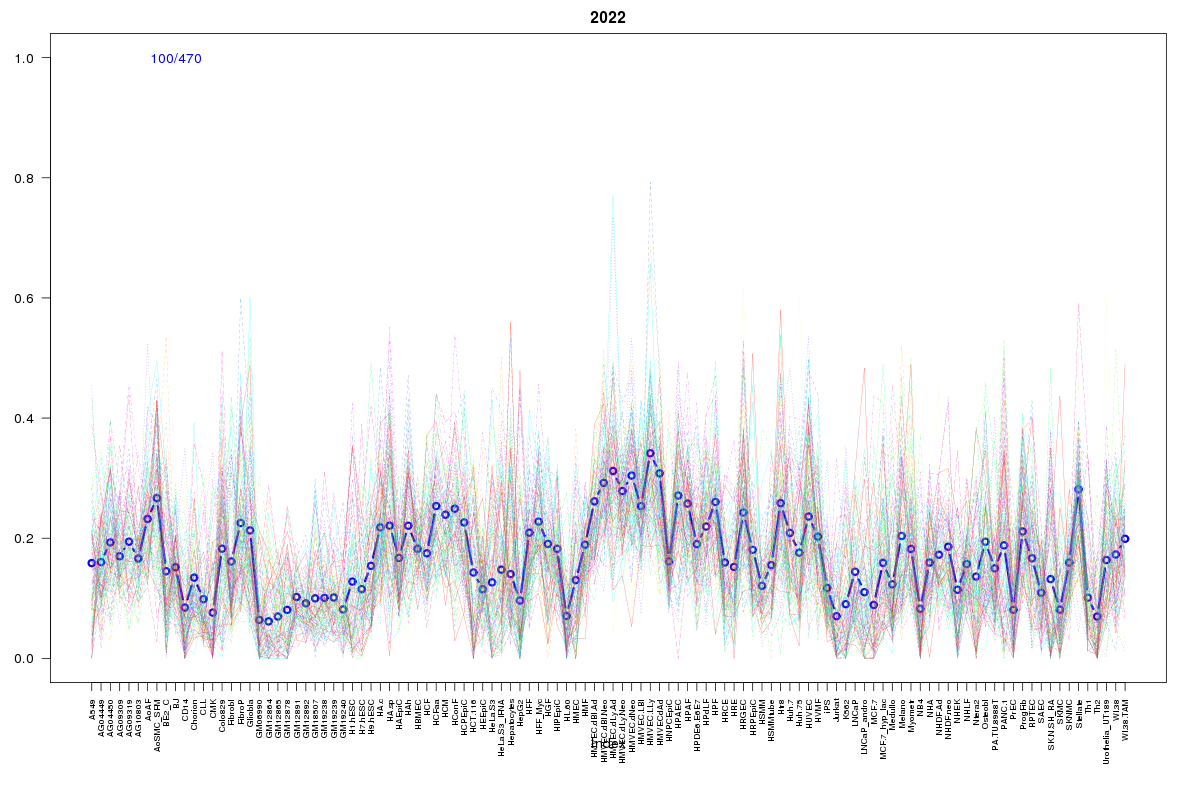 | 2022 | 2 |
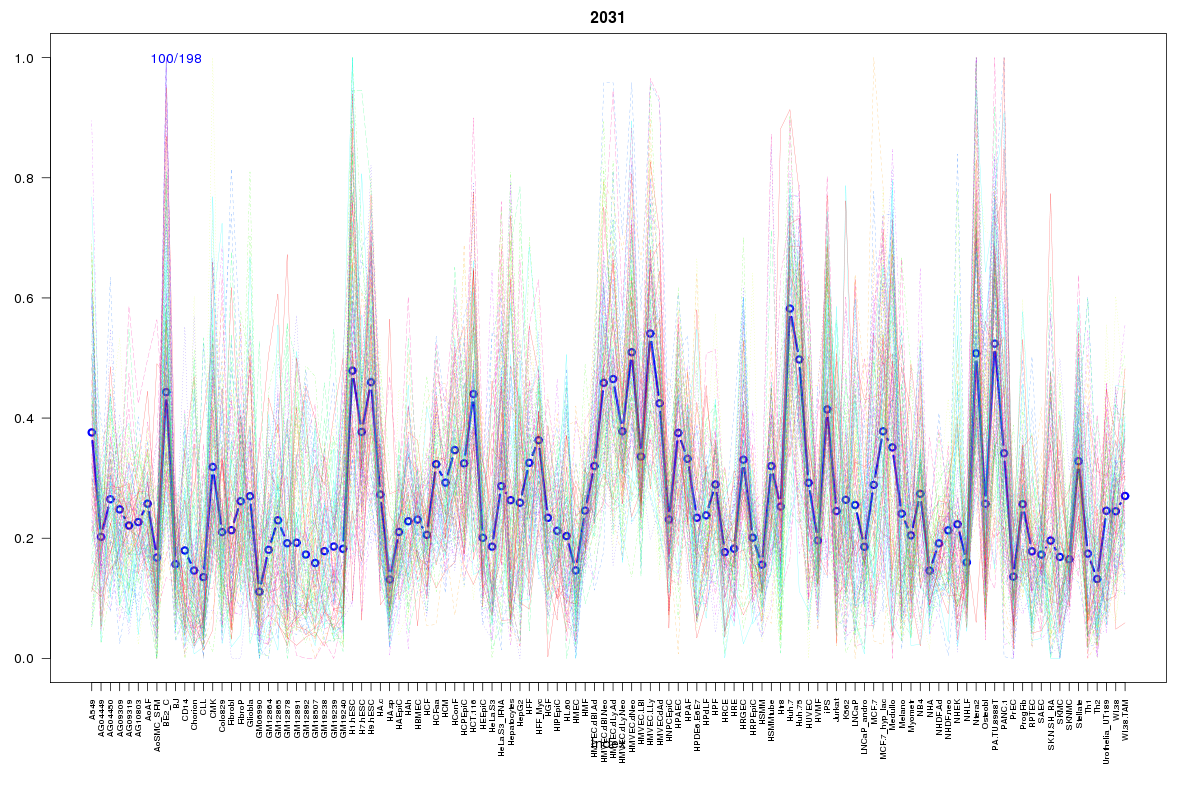 | 2031 | 2 |
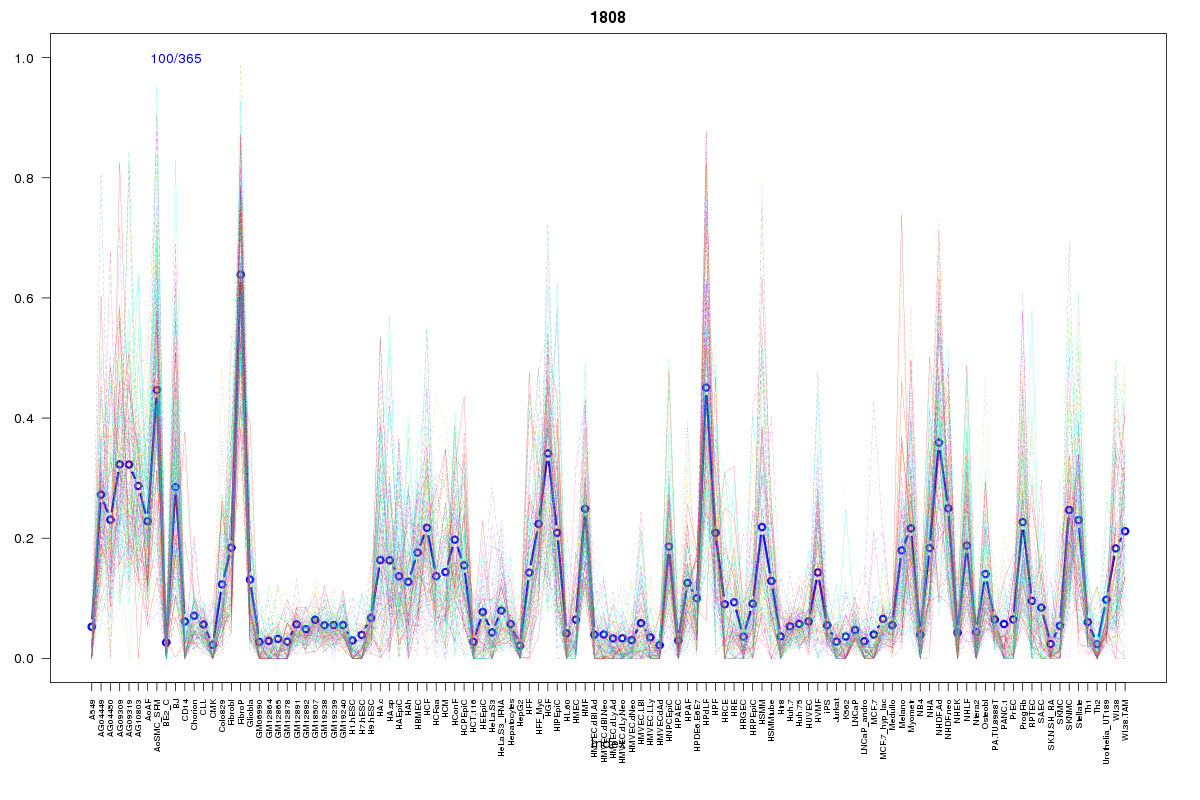 | 1808 | 2 |
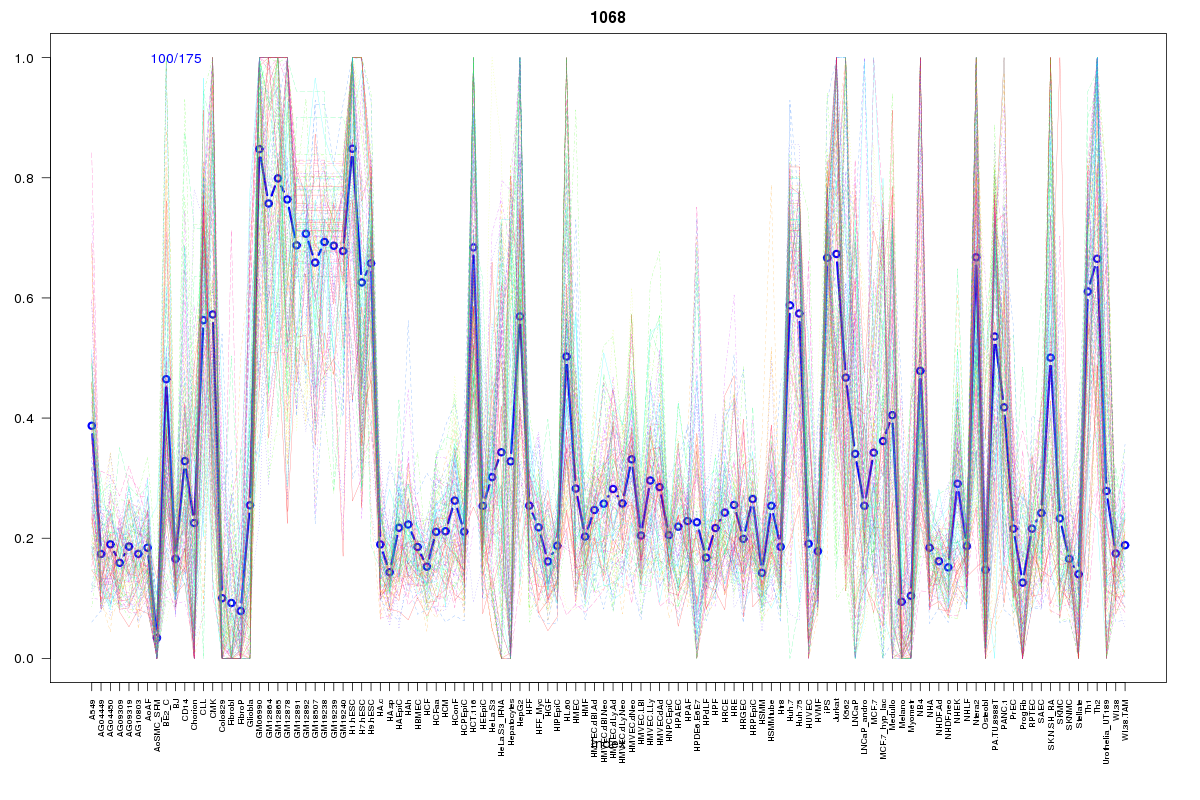 | 1068 | 1 |
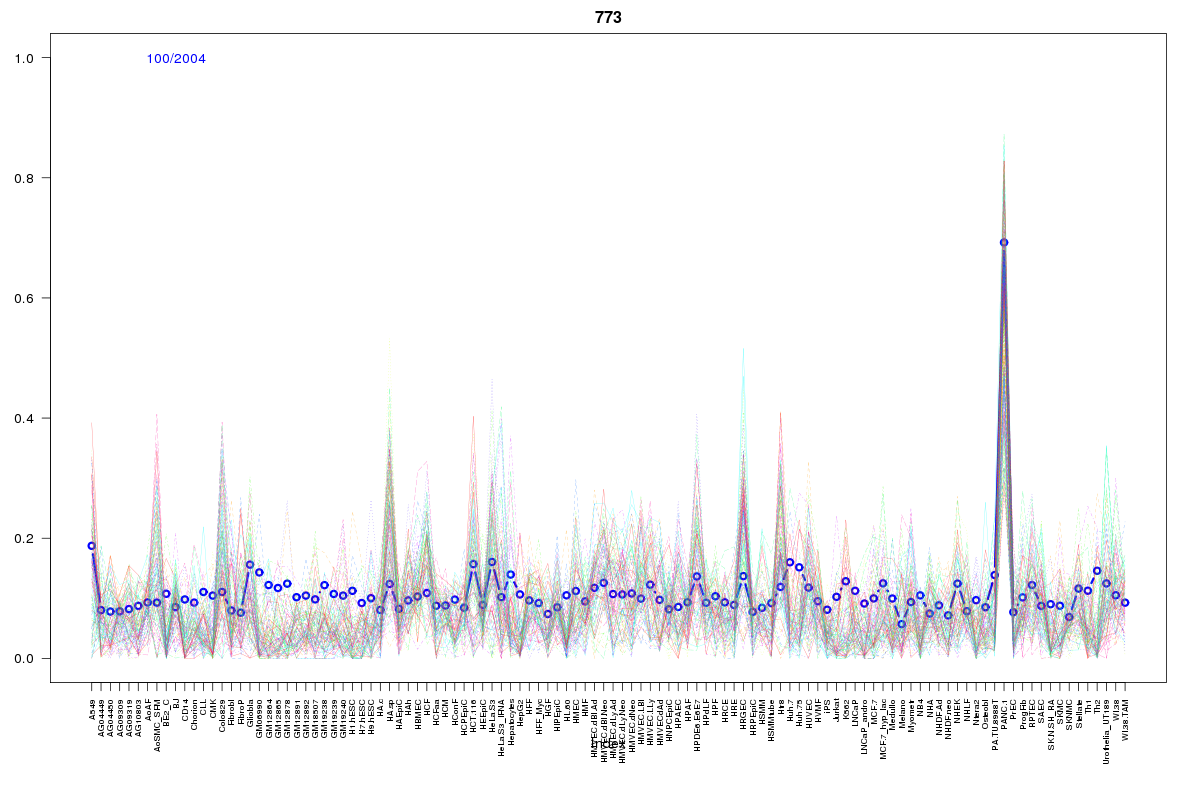 | 773 | 1 |
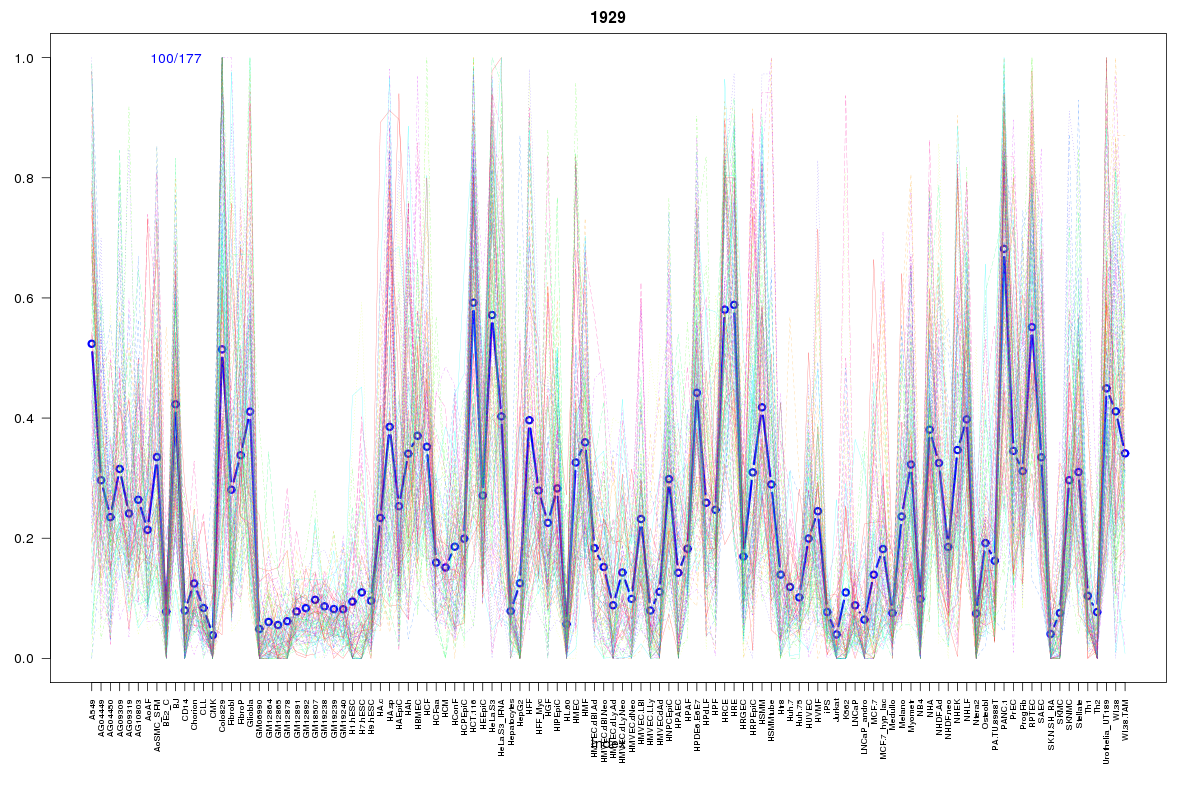 | 1929 | 1 |
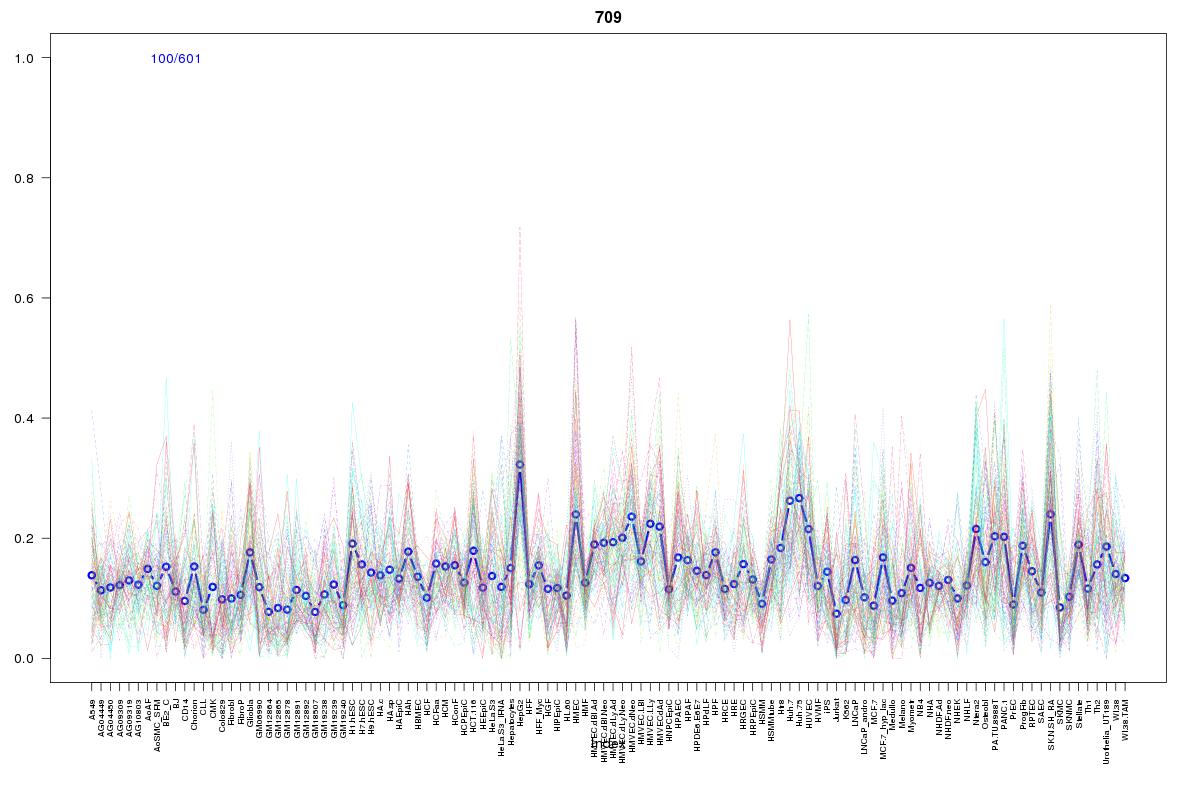 | 709 | 1 |
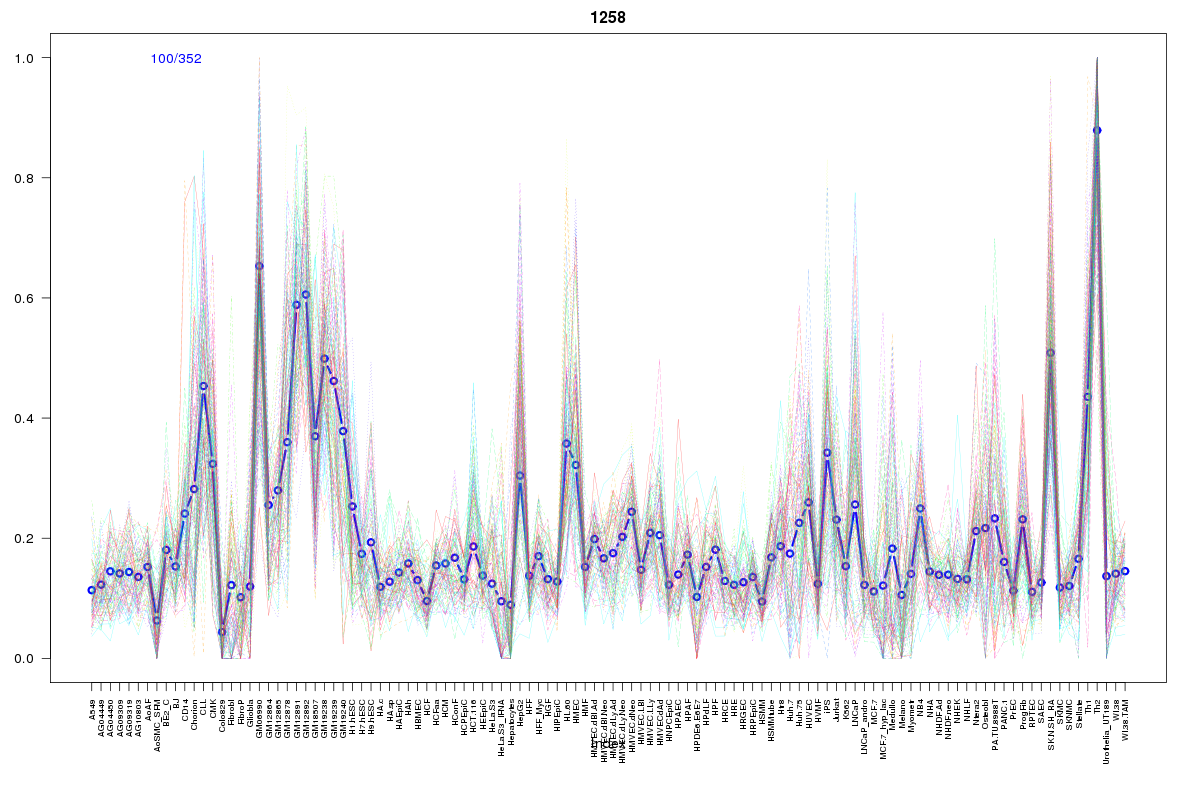 | 1258 | 1 |
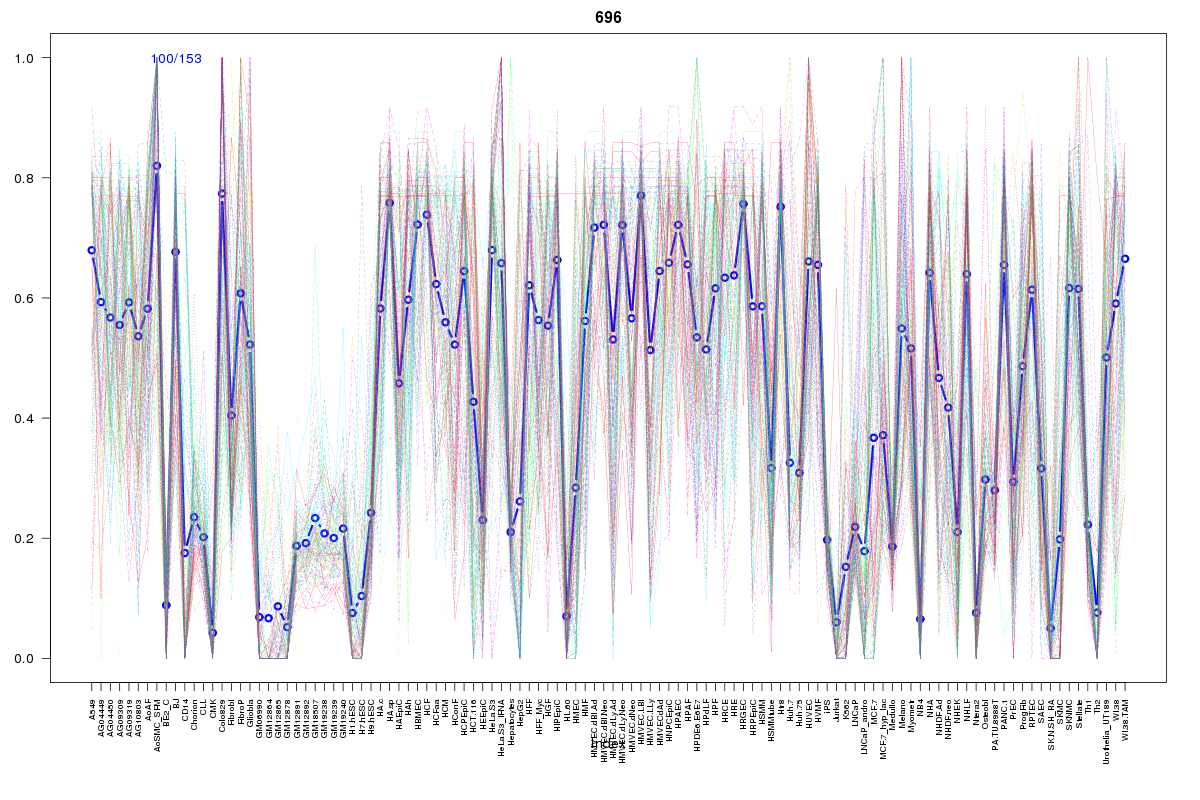 | 696 | 1 |
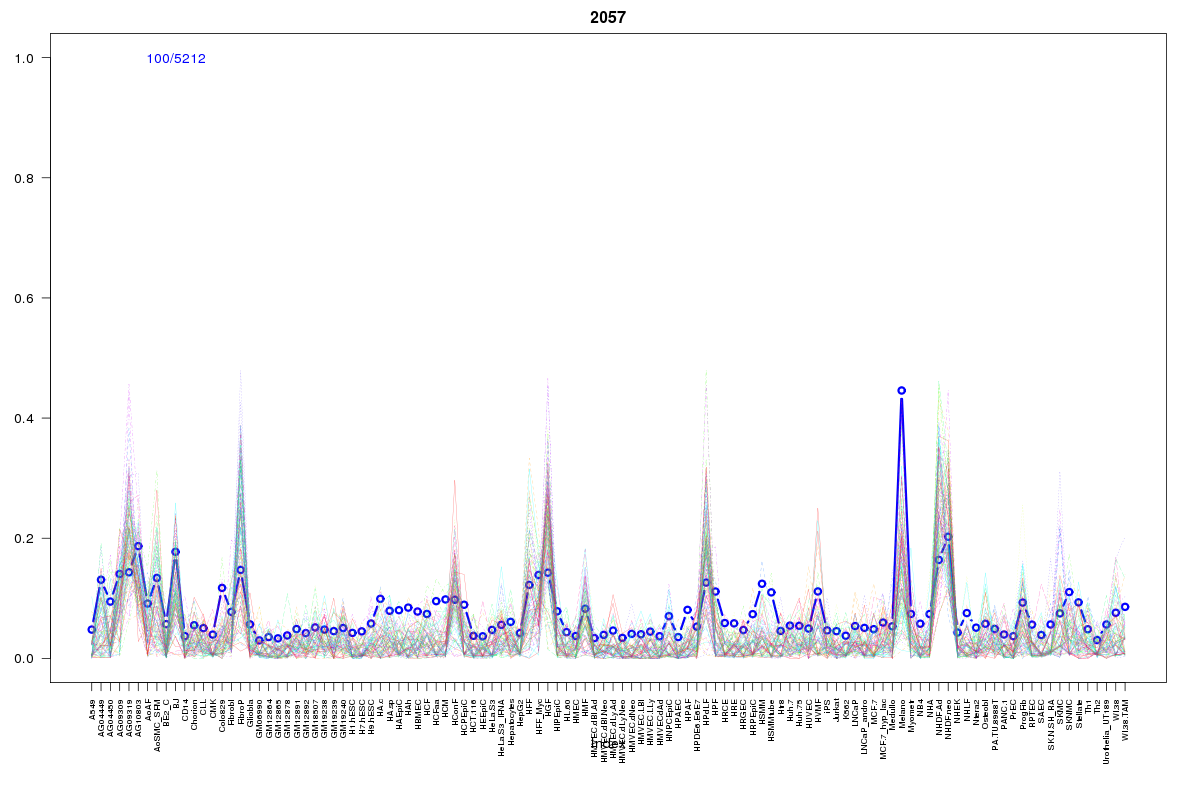 | 2057 | 1 |
 | 550 | 1 |
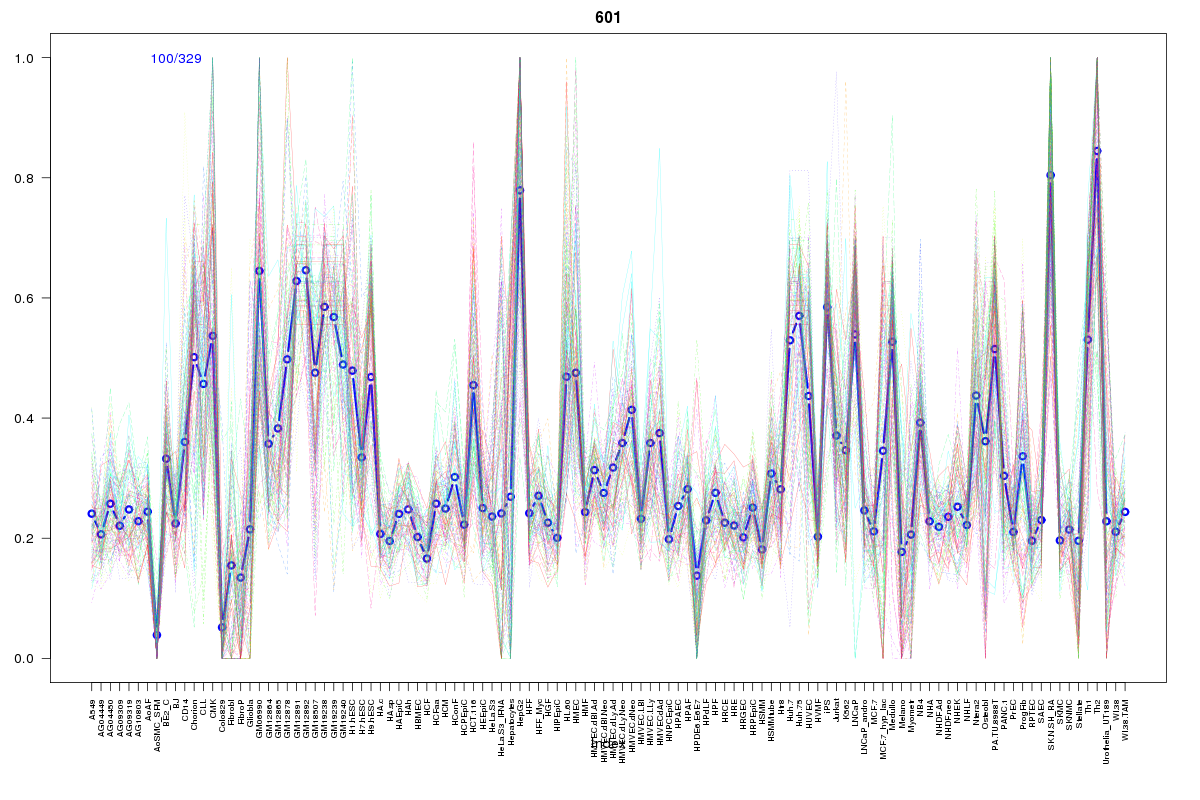 | 601 | 1 |
 | 957 | 1 |
 | 1345 | 1 |
 | 2391 | 1 |
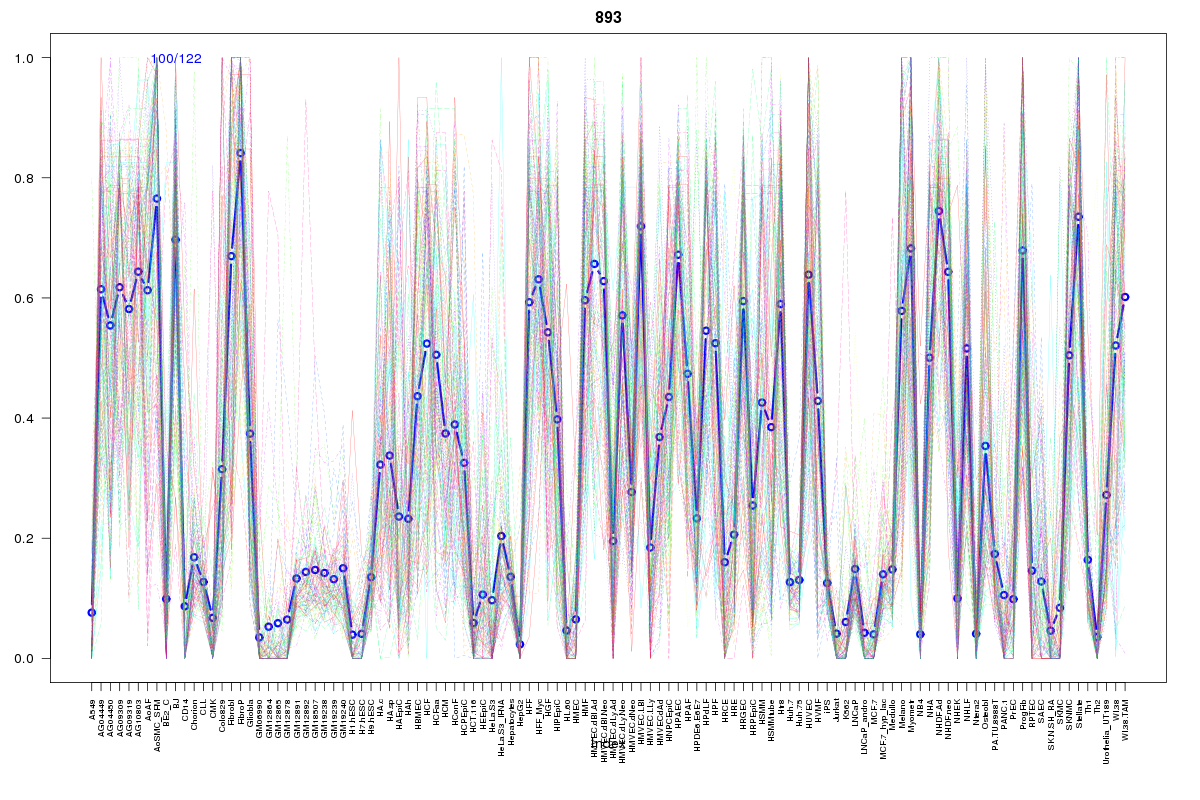 | 893 | 1 |
 | 1975 | 1 |
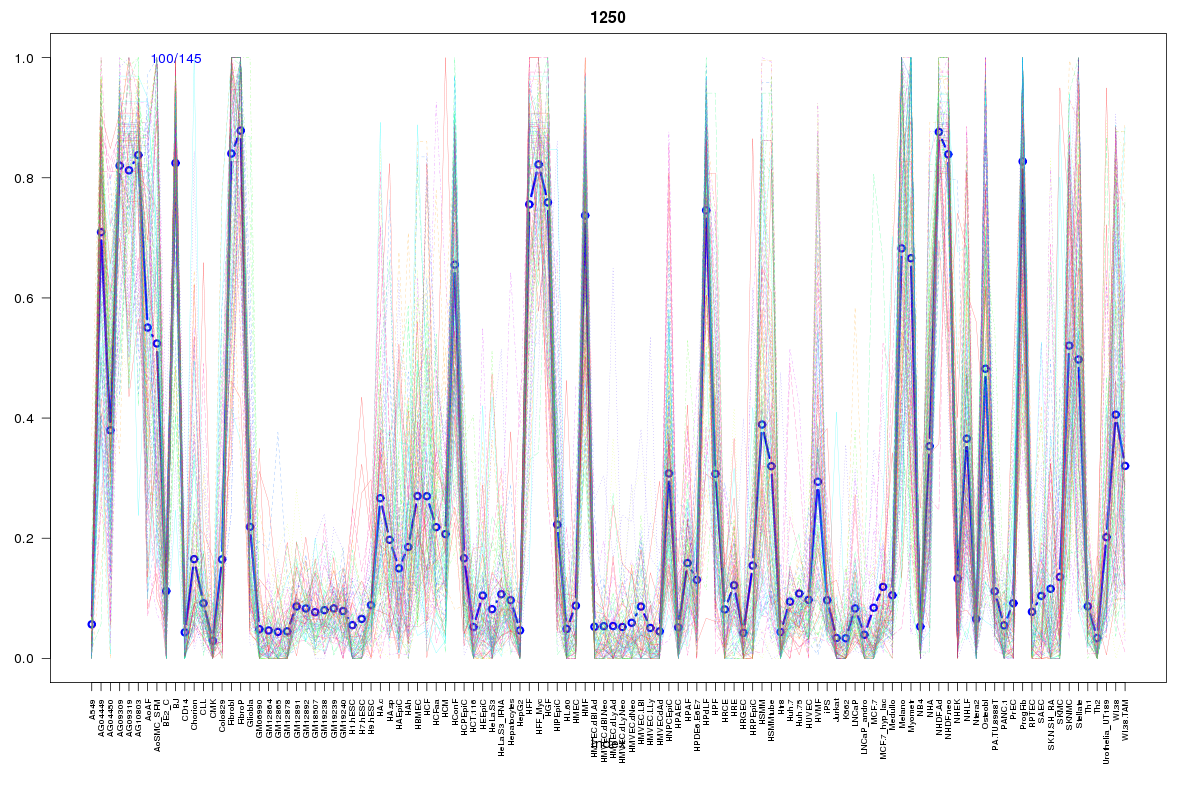 | 1250 | 1 |
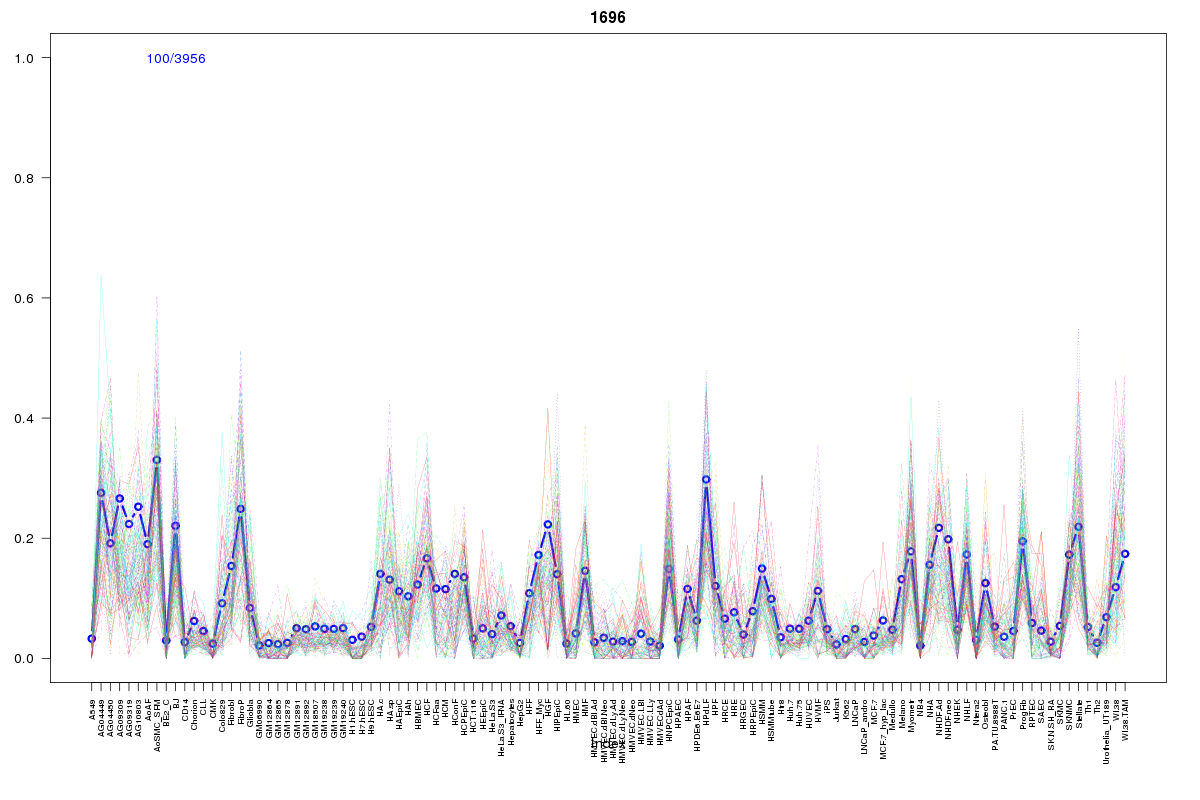 | 1696 | 1 |
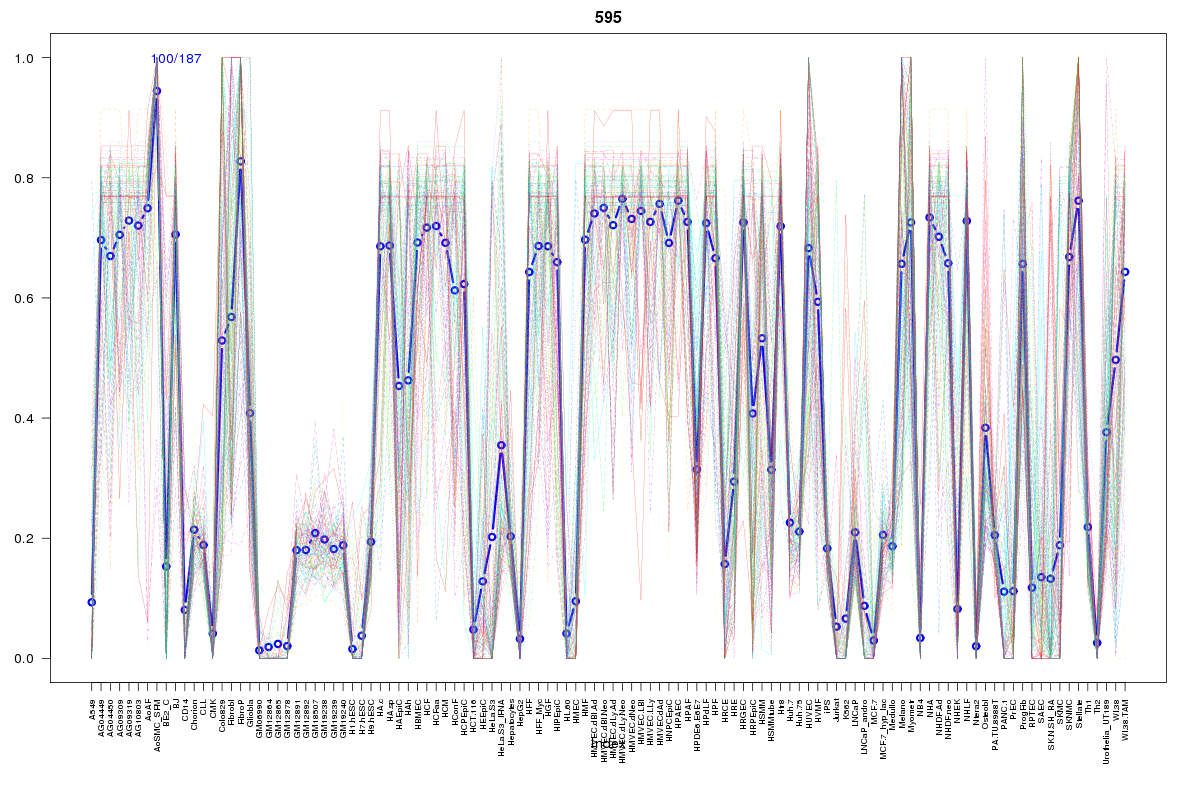 | 595 | 1 |
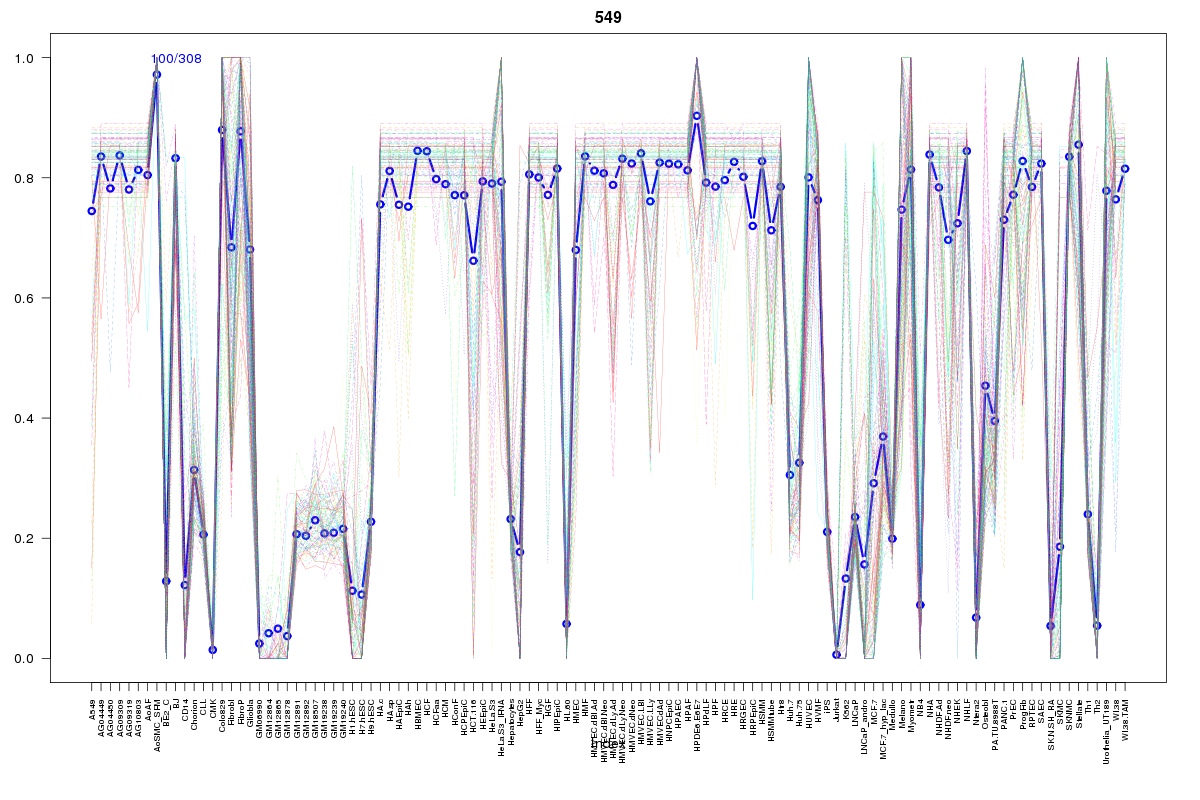 | 549 | 1 |
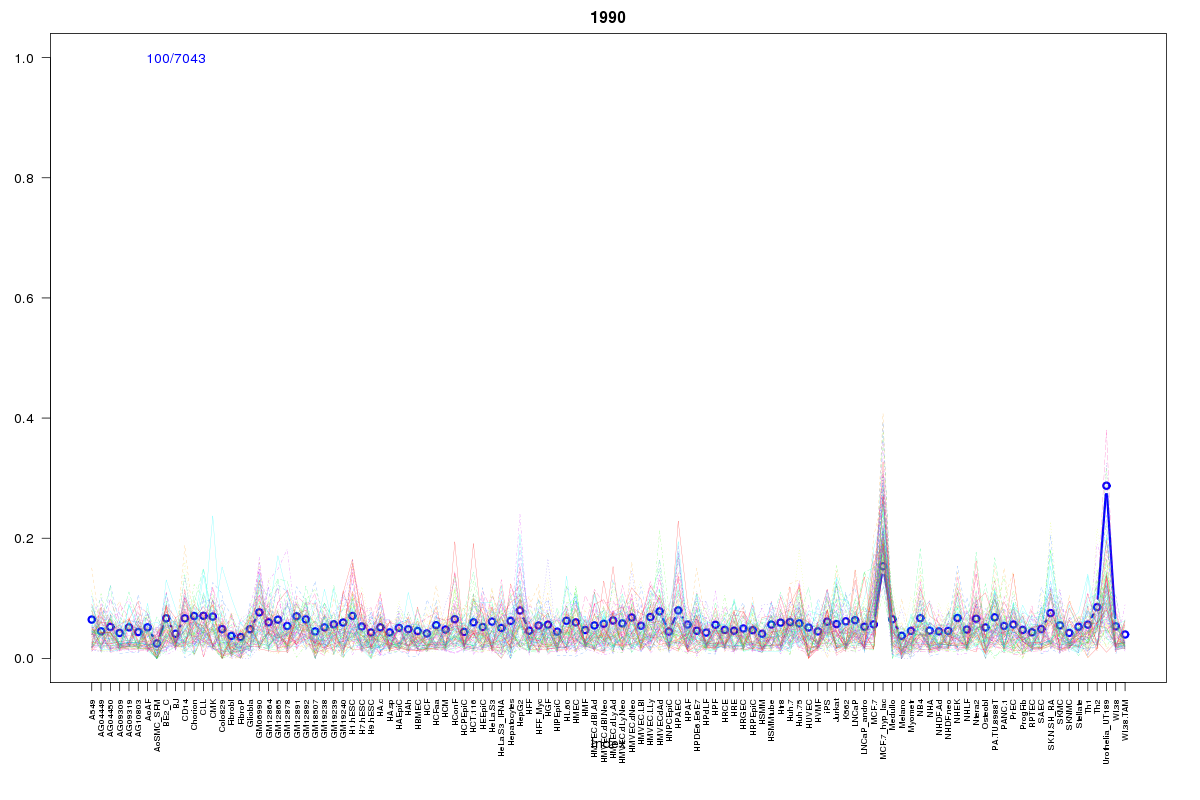 | 1990 | 1 |
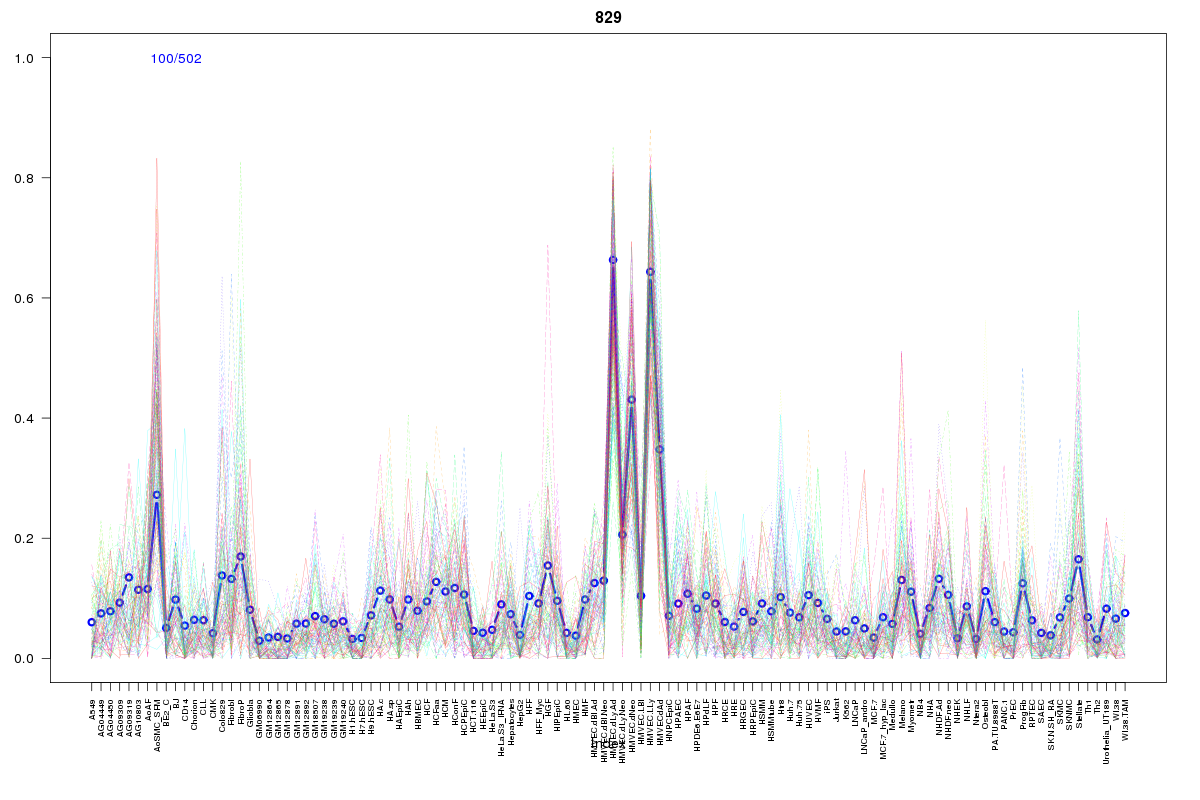 | 829 | 1 |
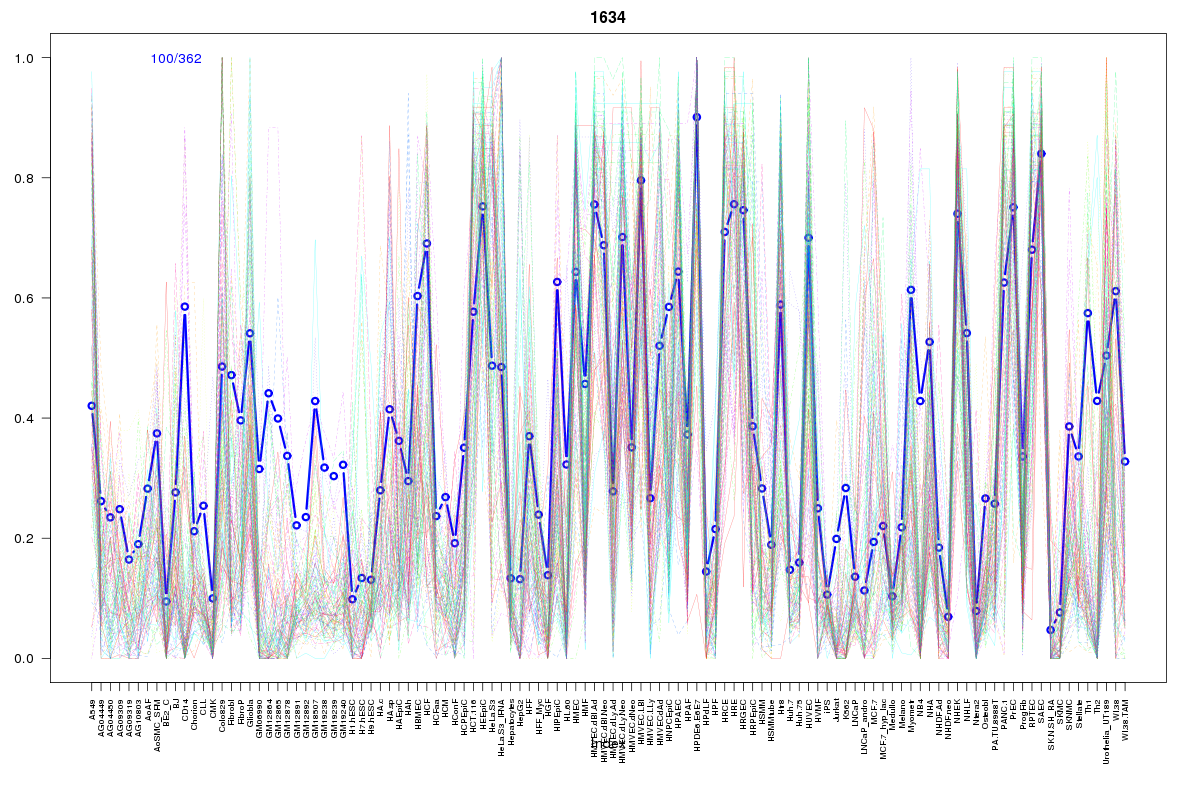 | 1634 | 1 |
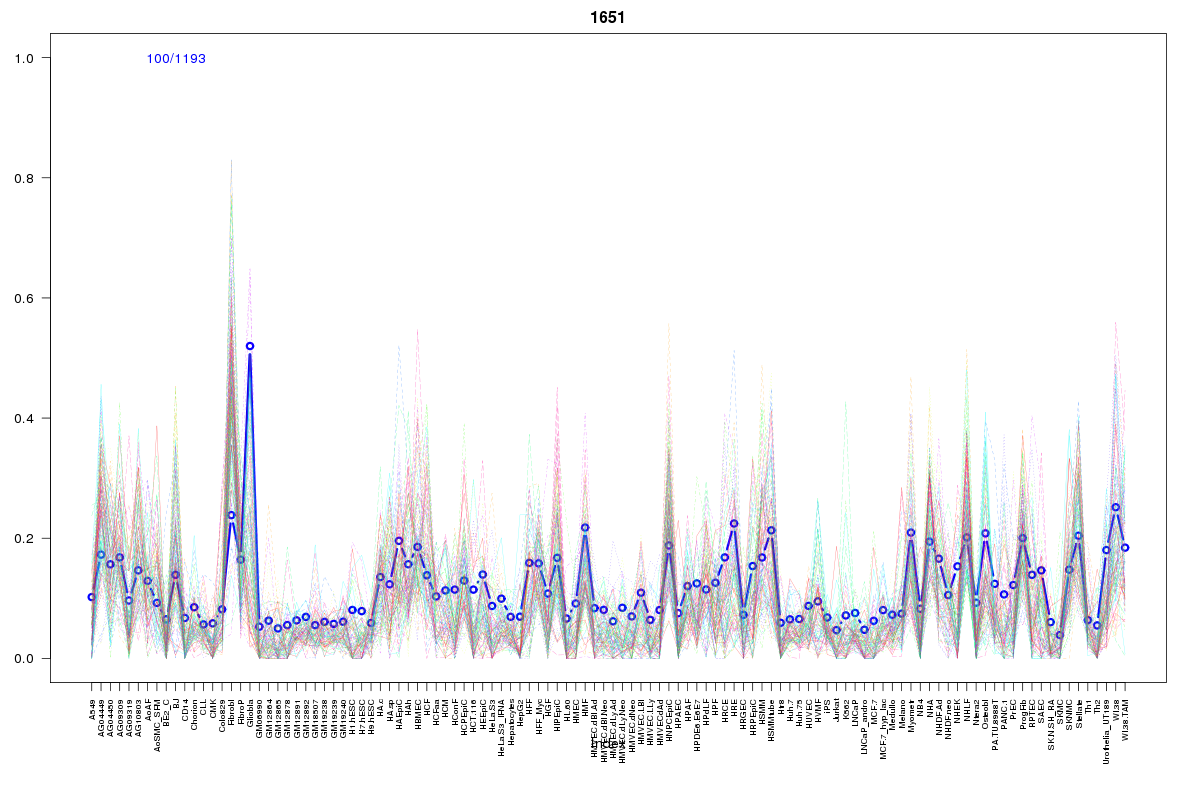 | 1651 | 1 |
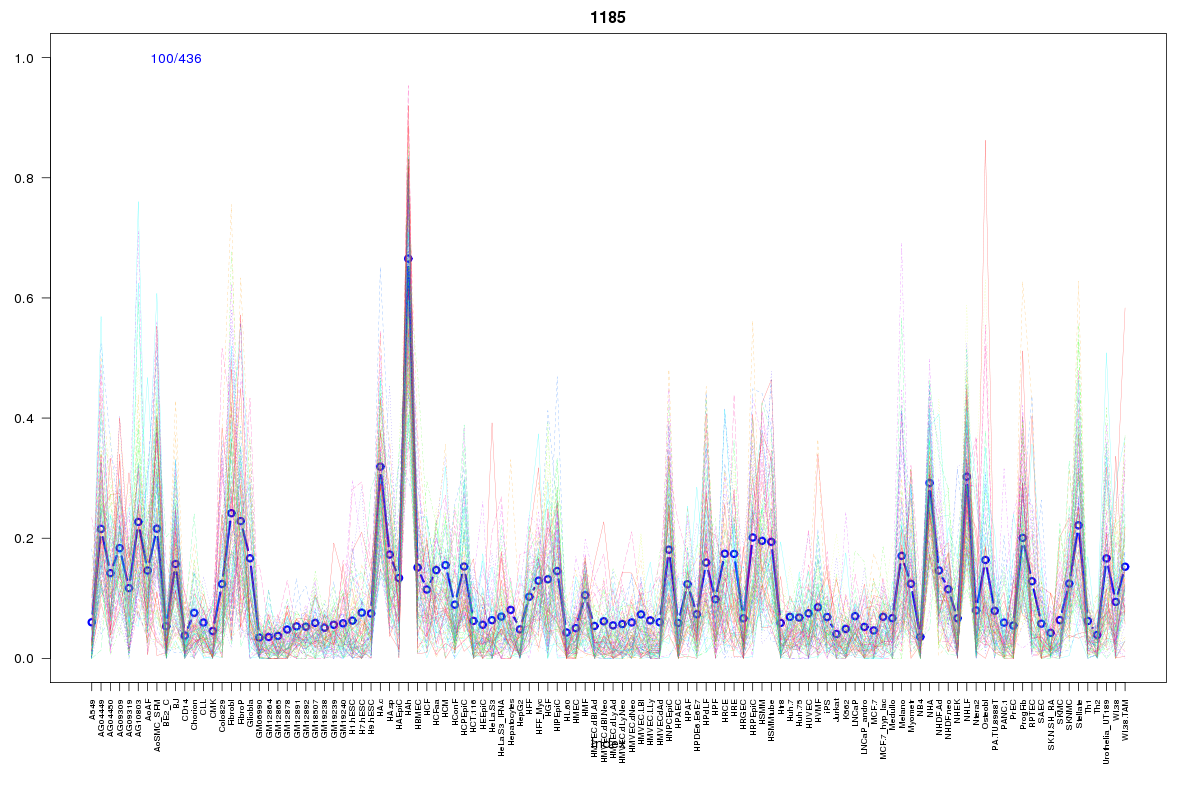 | 1185 | 1 |
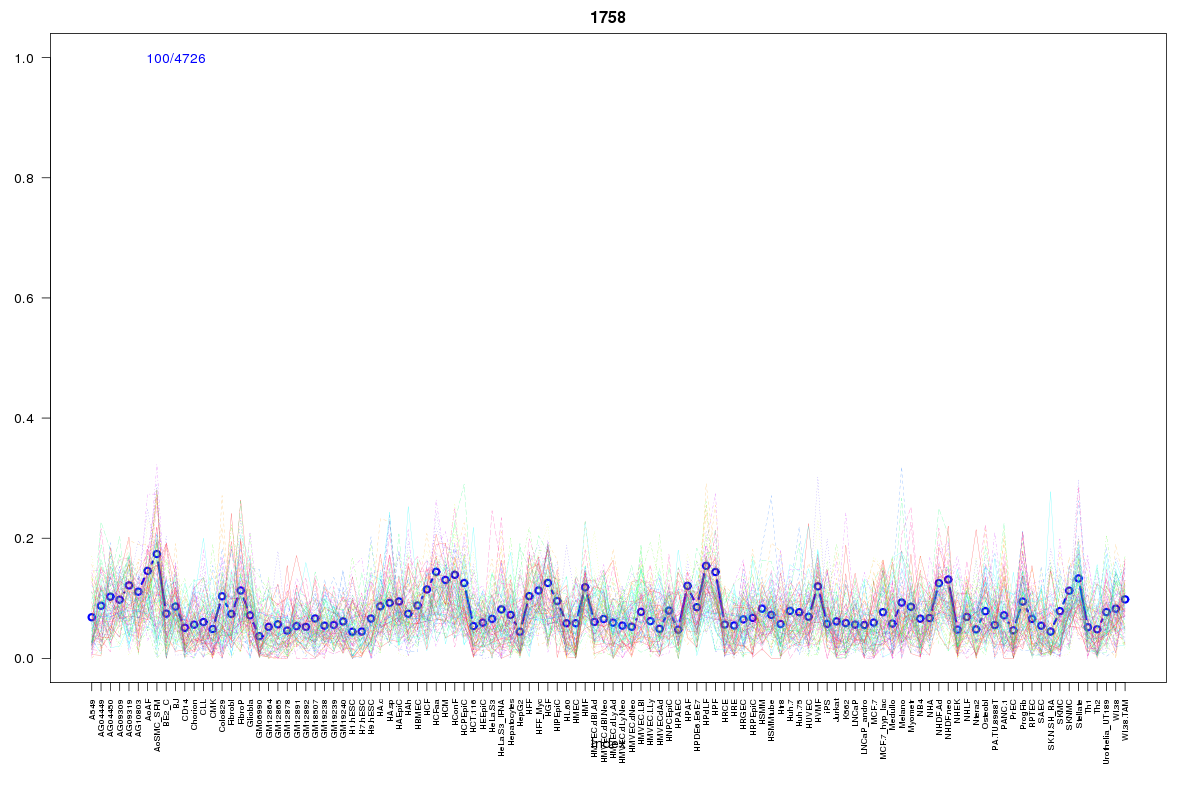 | 1758 | 1 |
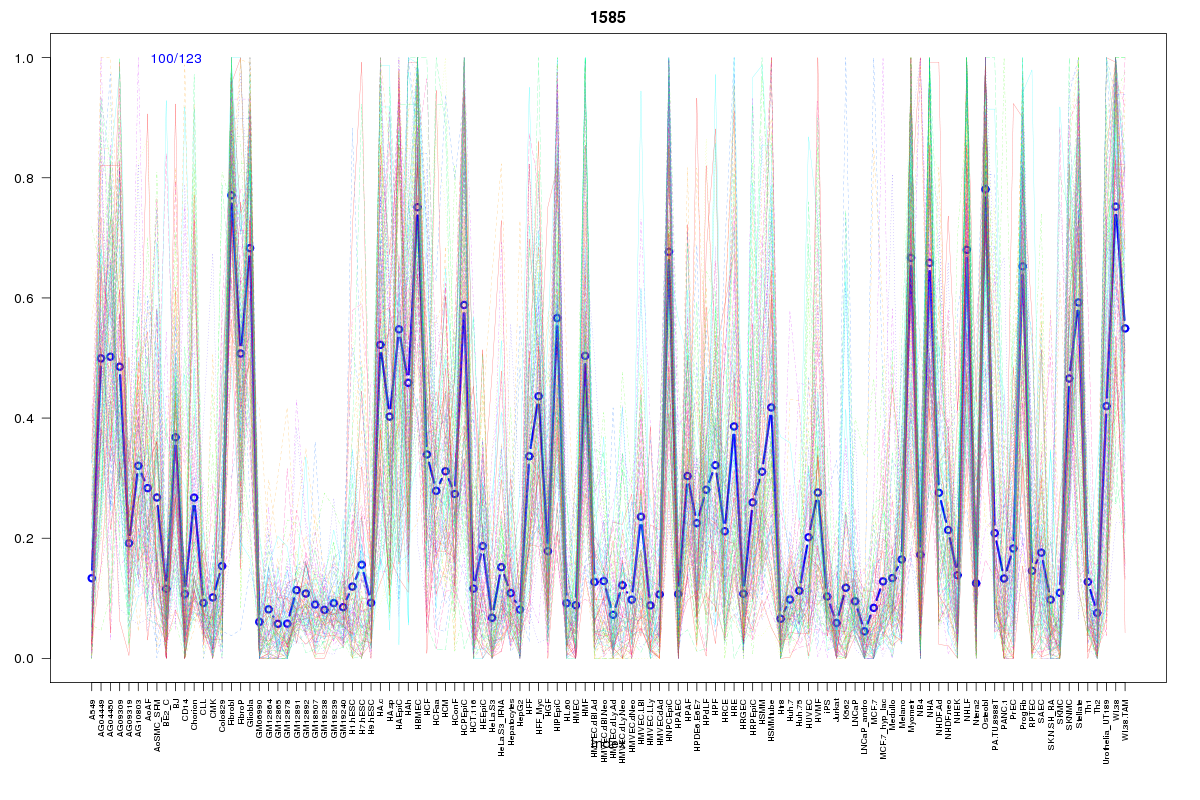 | 1585 | 1 |
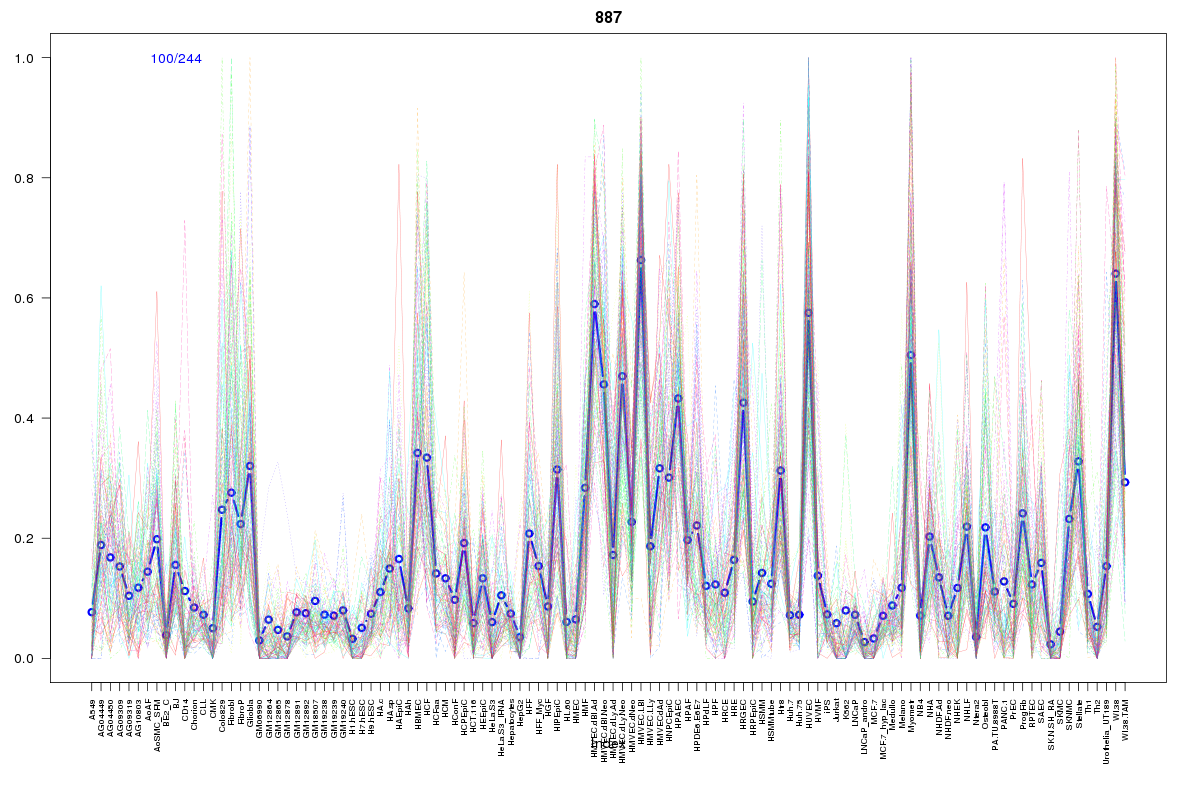 | 887 | 1 |
 | 2178 | 1 |
 | 309 | 1 |
 | 1095 | 1 |
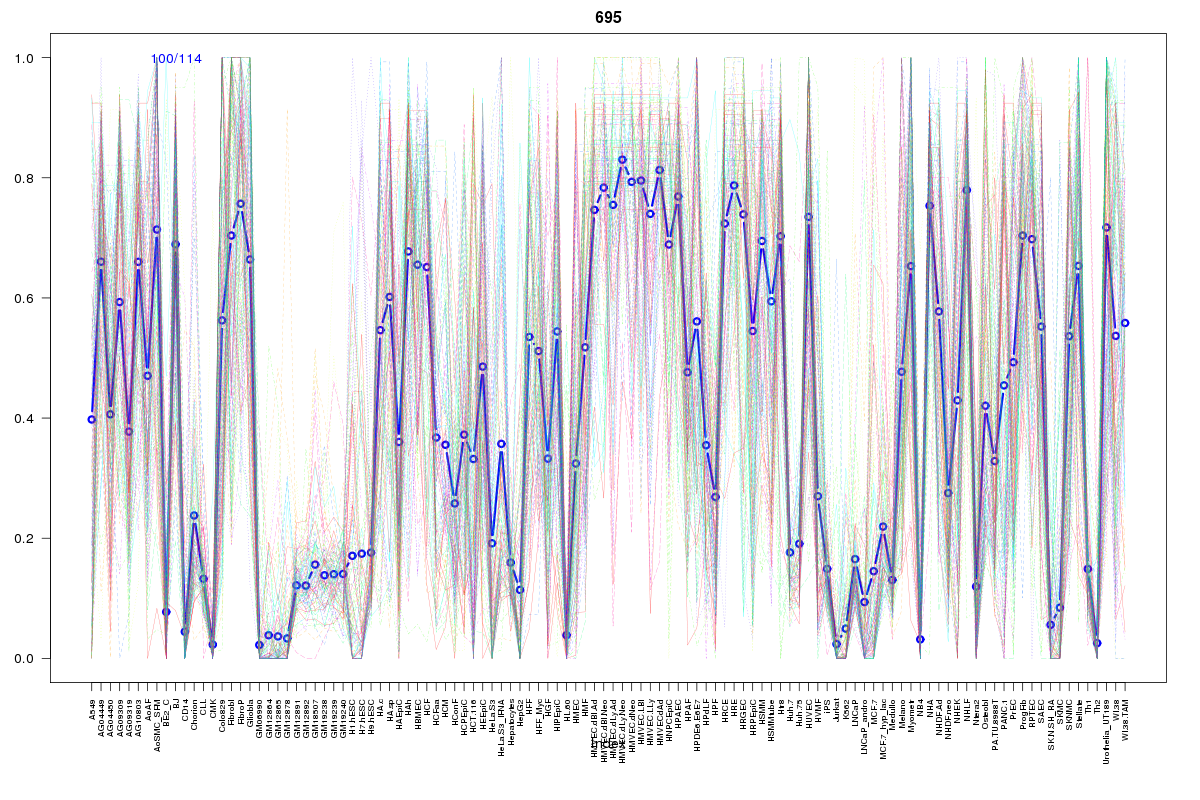 | 695 | 1 |
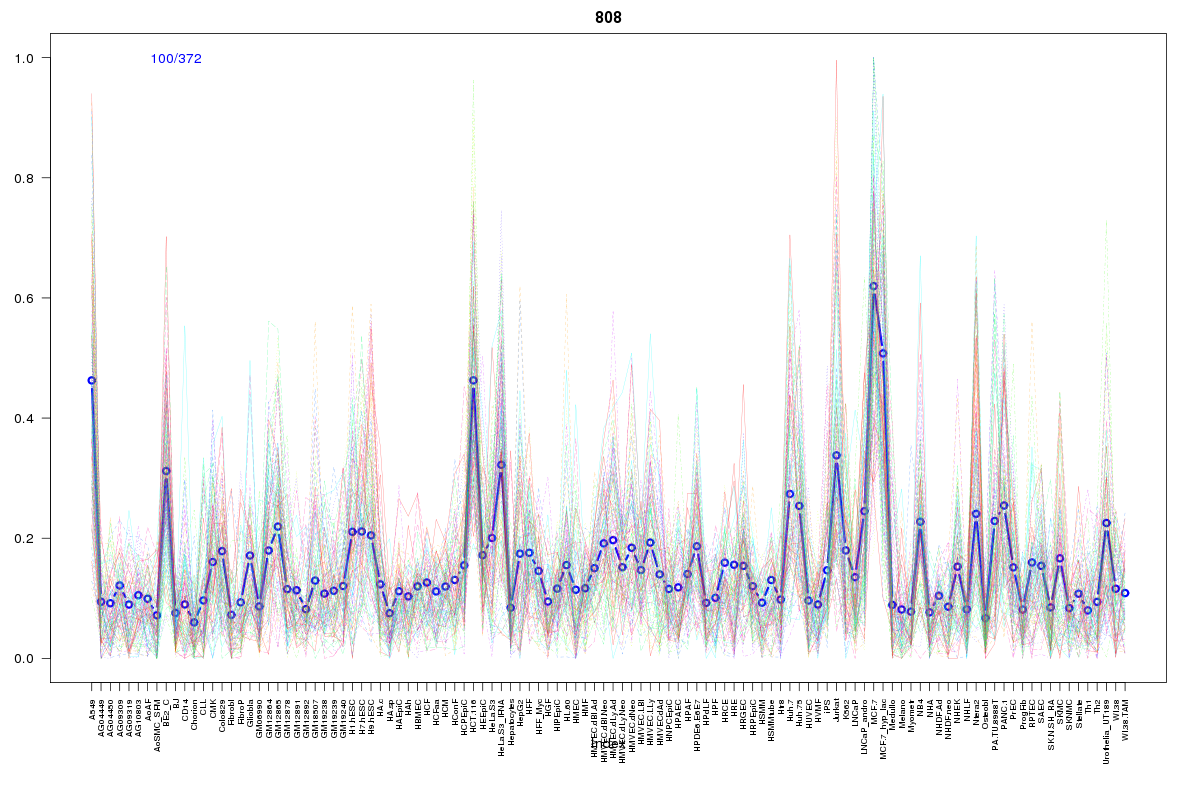 | 808 | 1 |
 | 2068 | 1 |
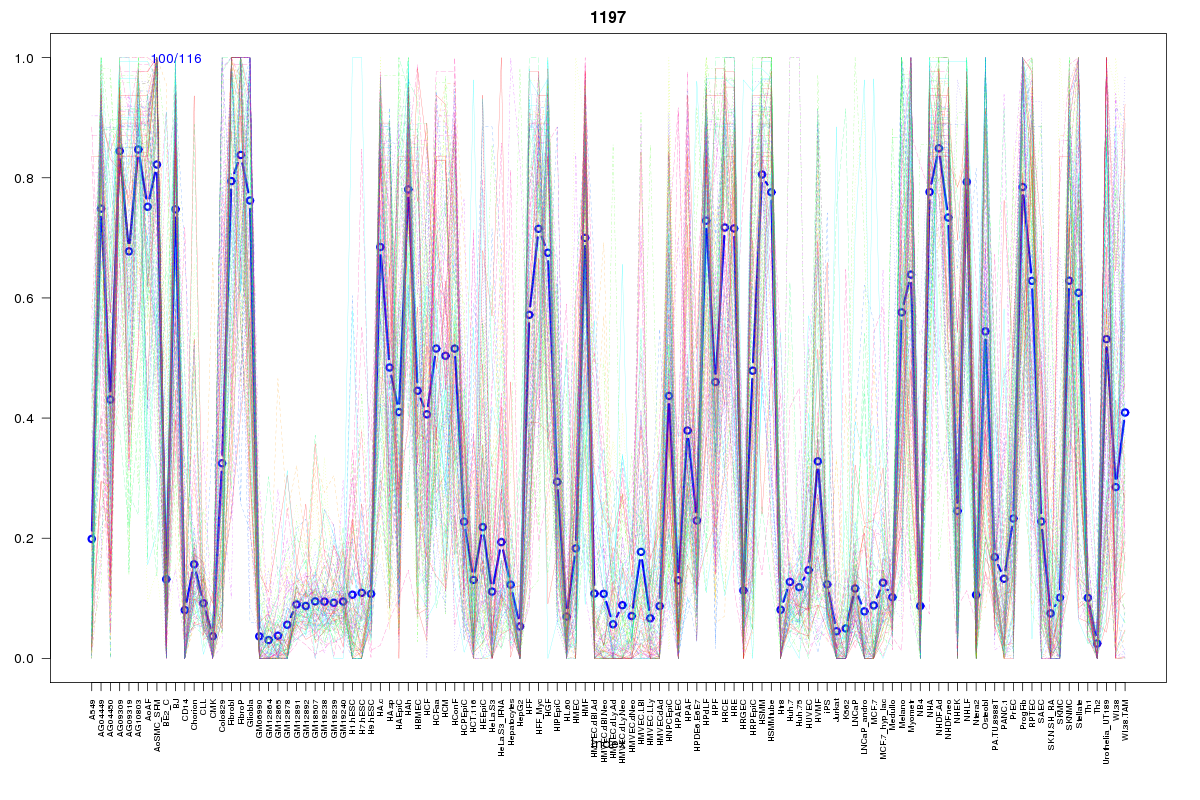 | 1197 | 1 |
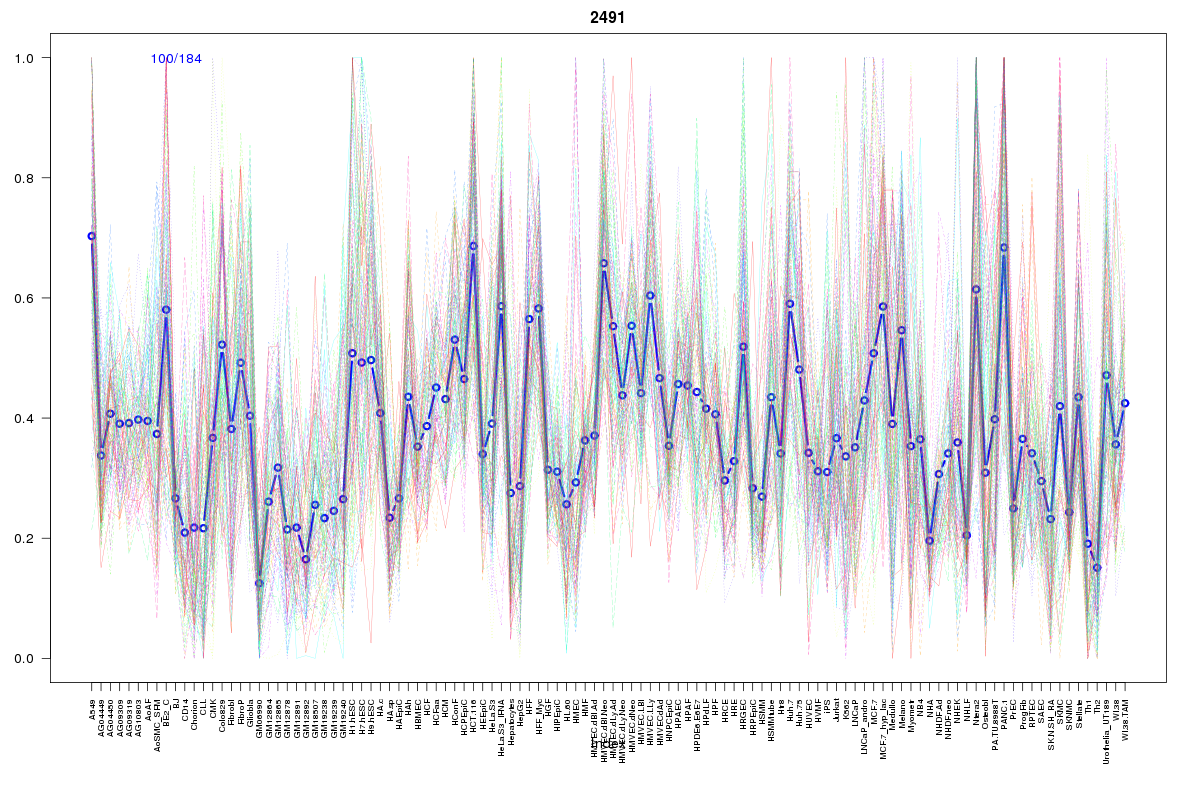 | 2491 | 1 |
 | 387 | 1 |
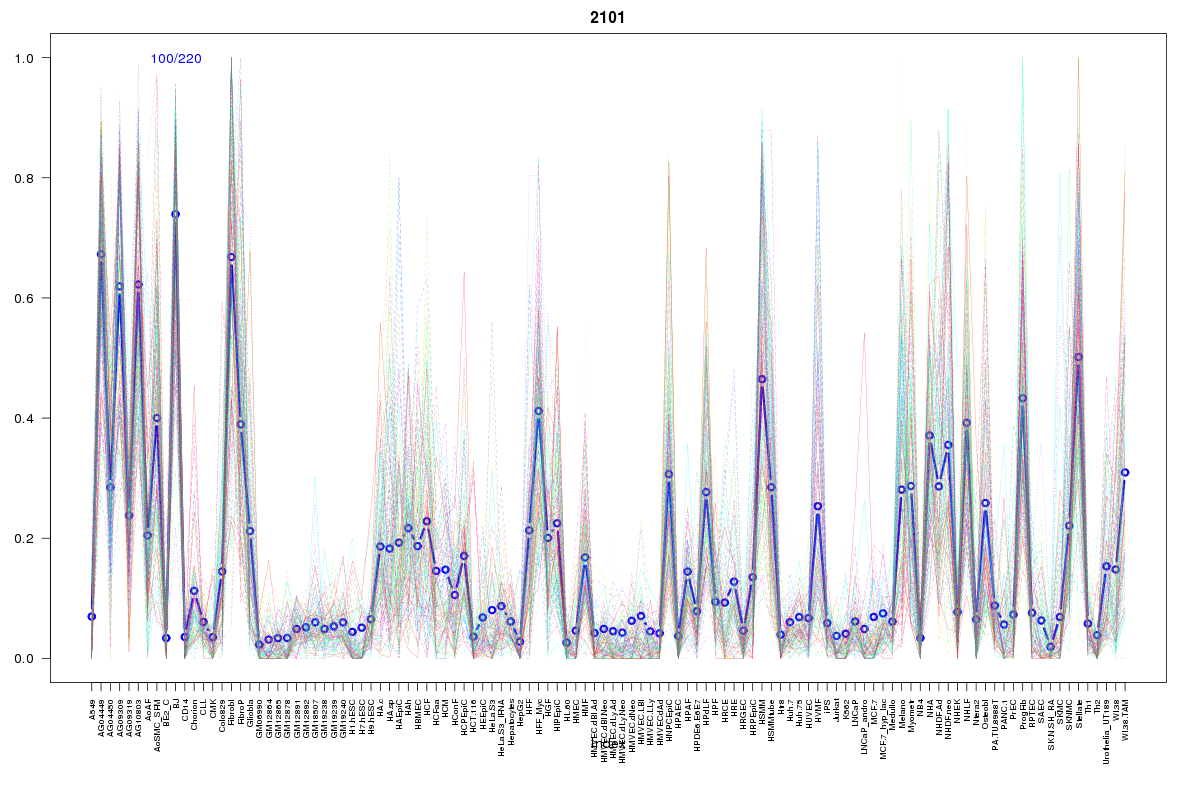 | 2101 | 1 |
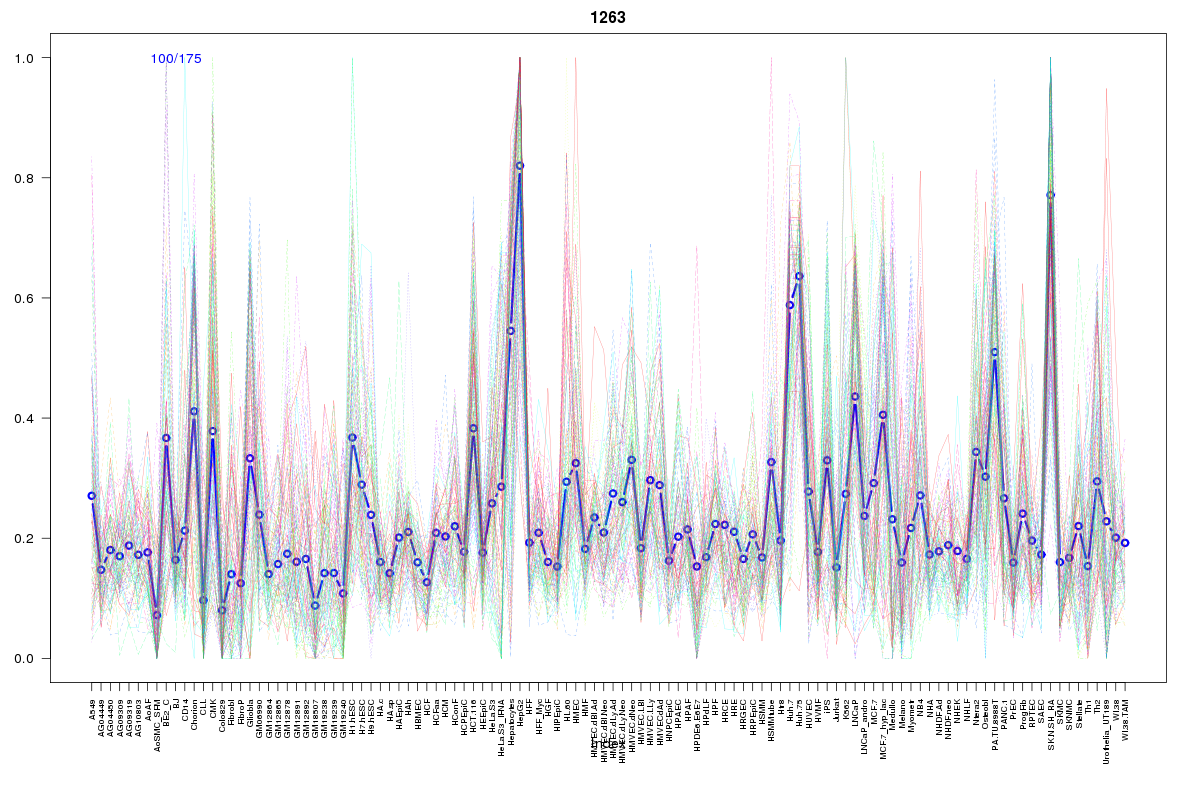 | 1263 | 1 |
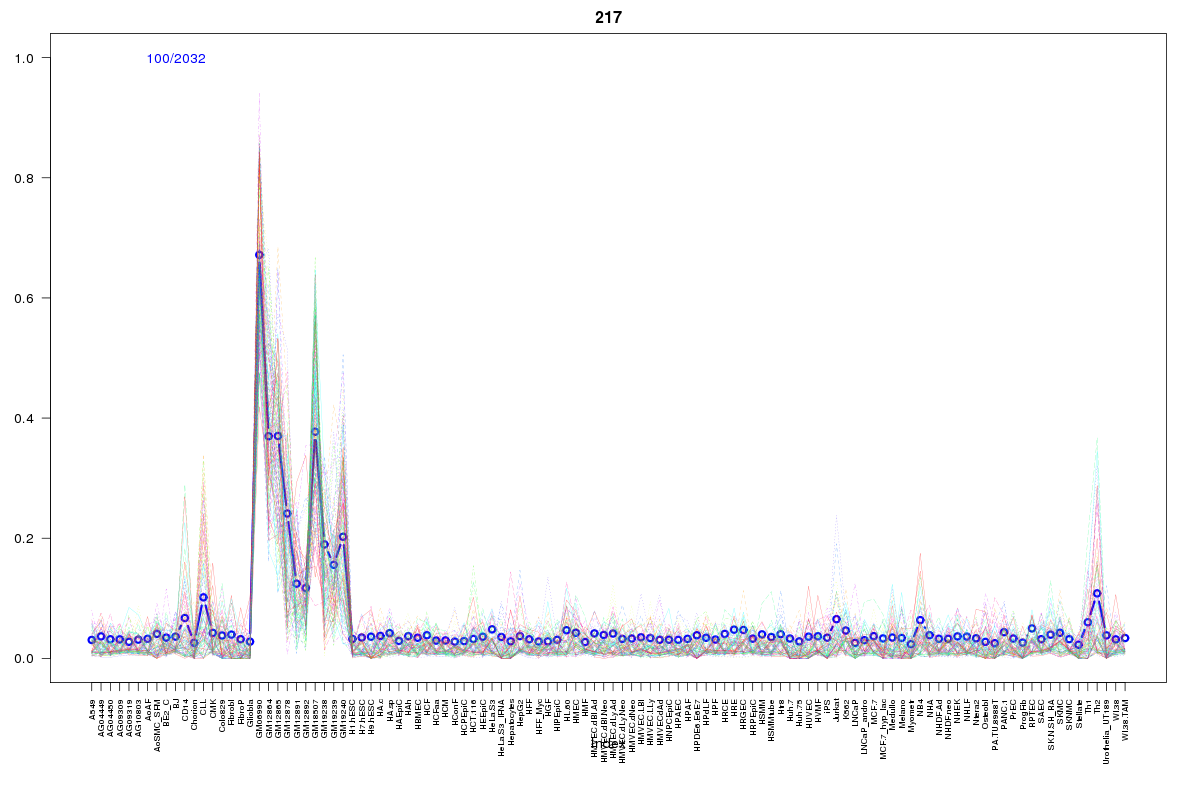 | 217 | 1 |
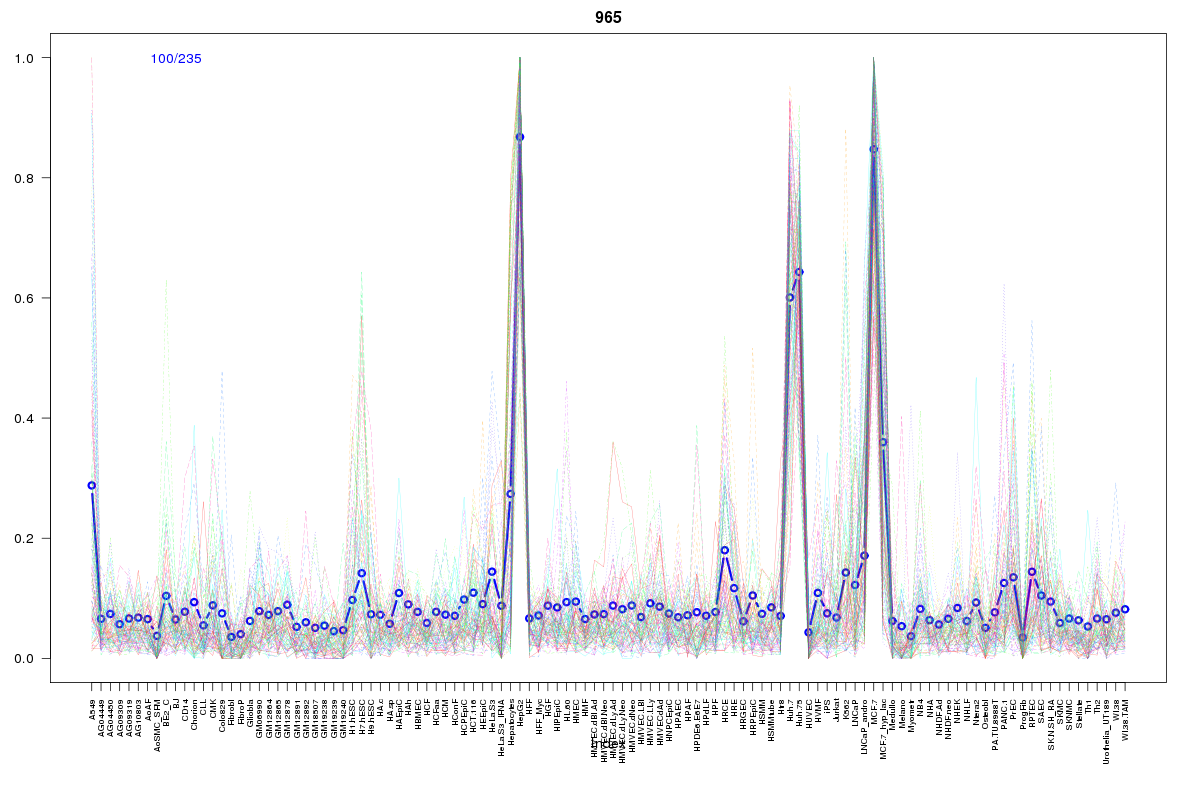 | 965 | 1 |
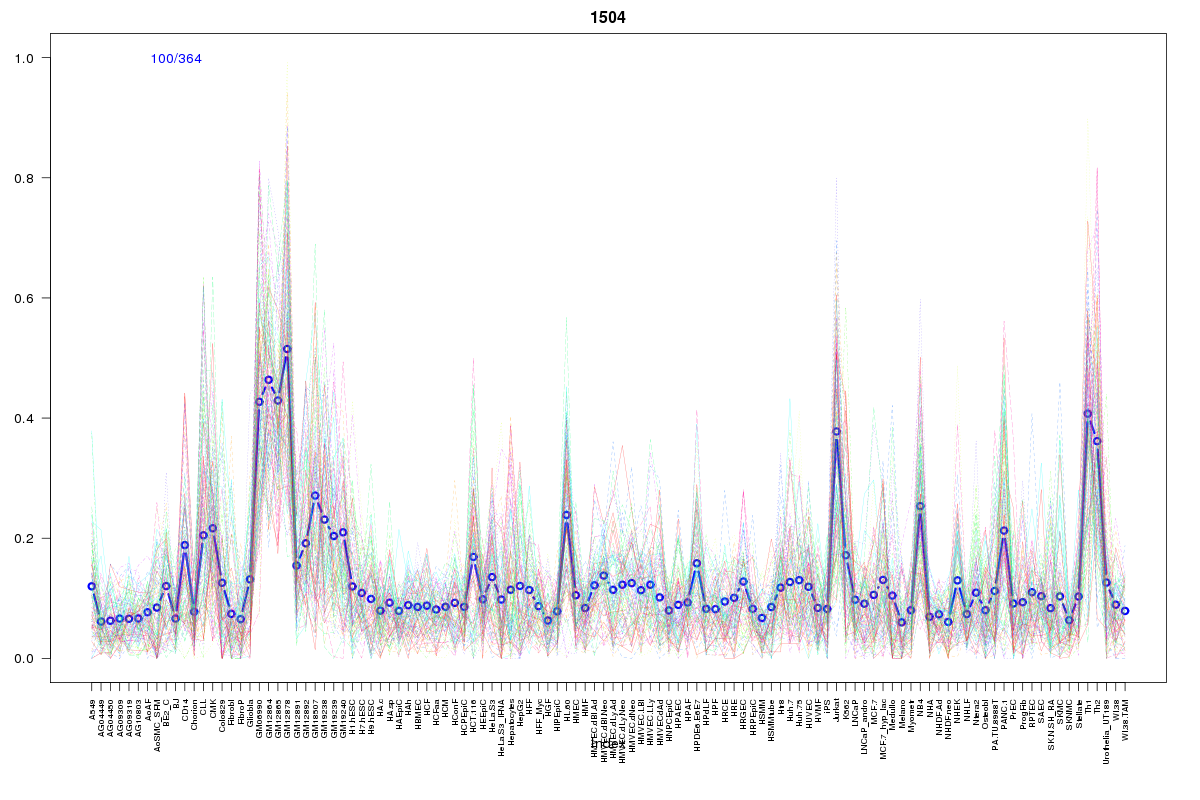 | 1504 | 1 |
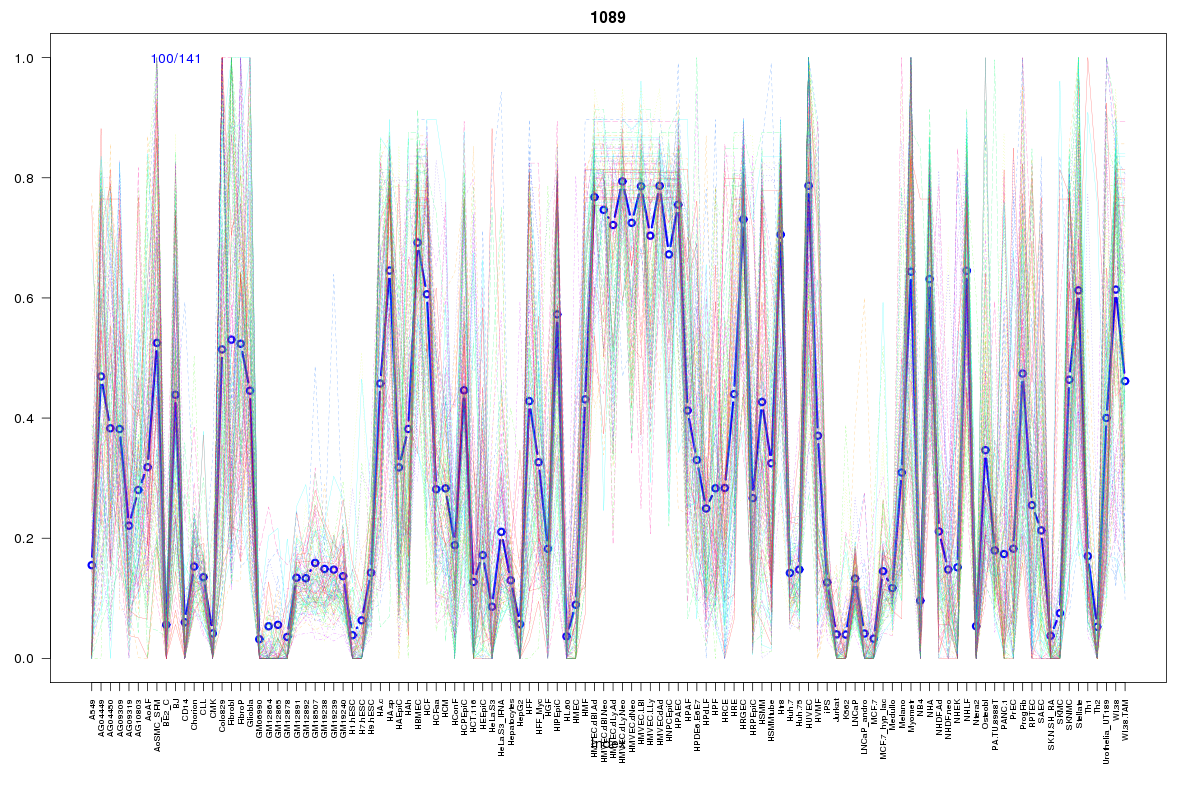 | 1089 | 1 |
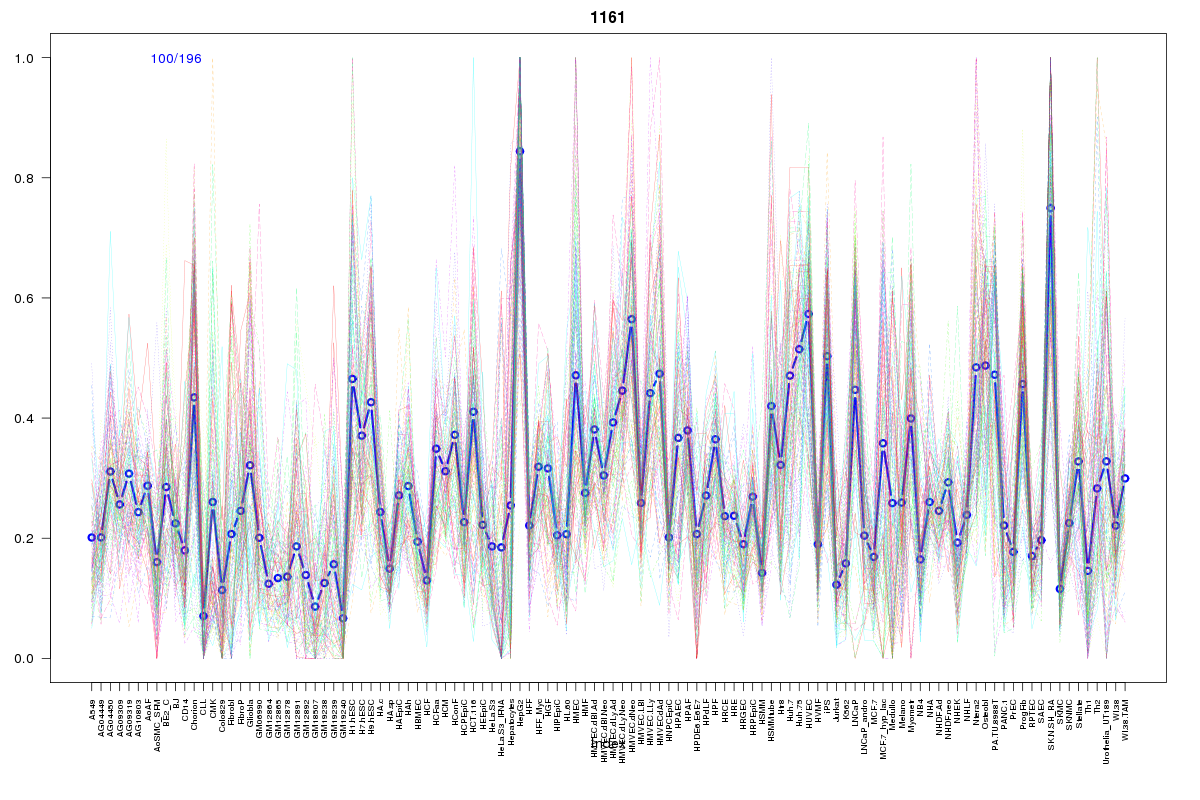 | 1161 | 1 |
 | 2218 | 1 |
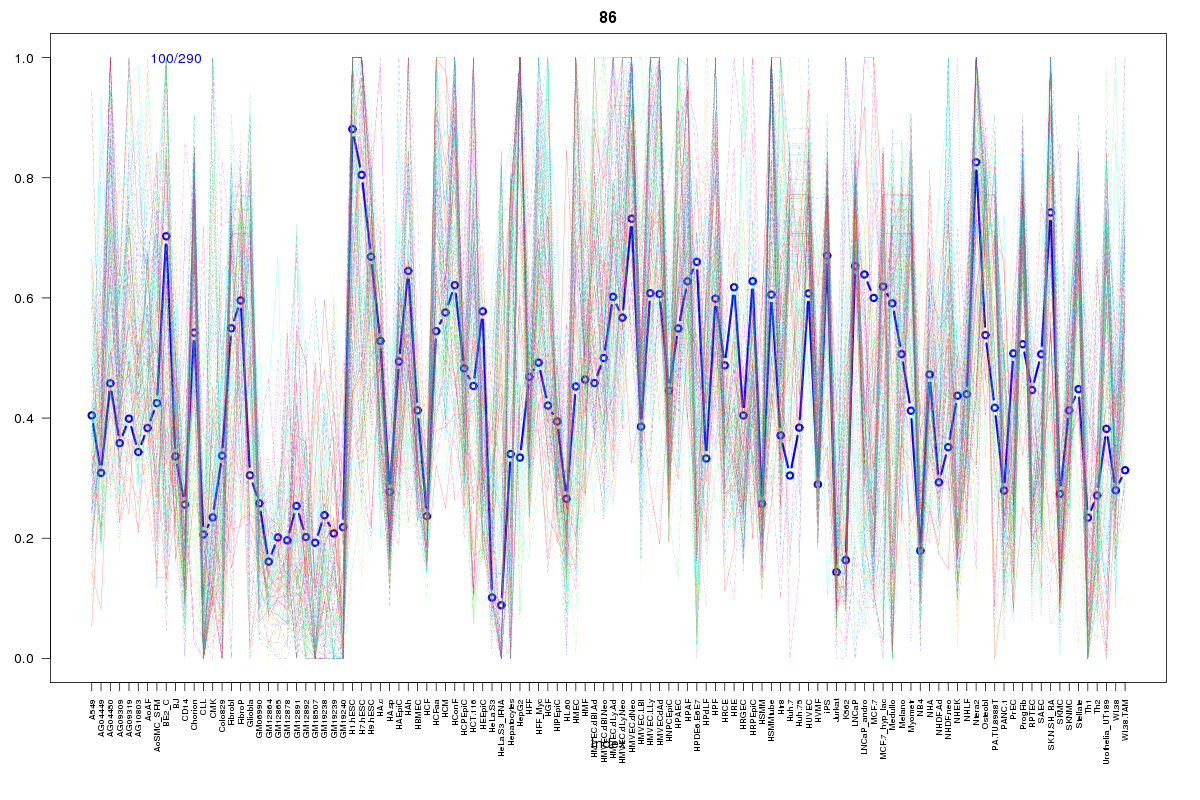 | 86 | 1 |
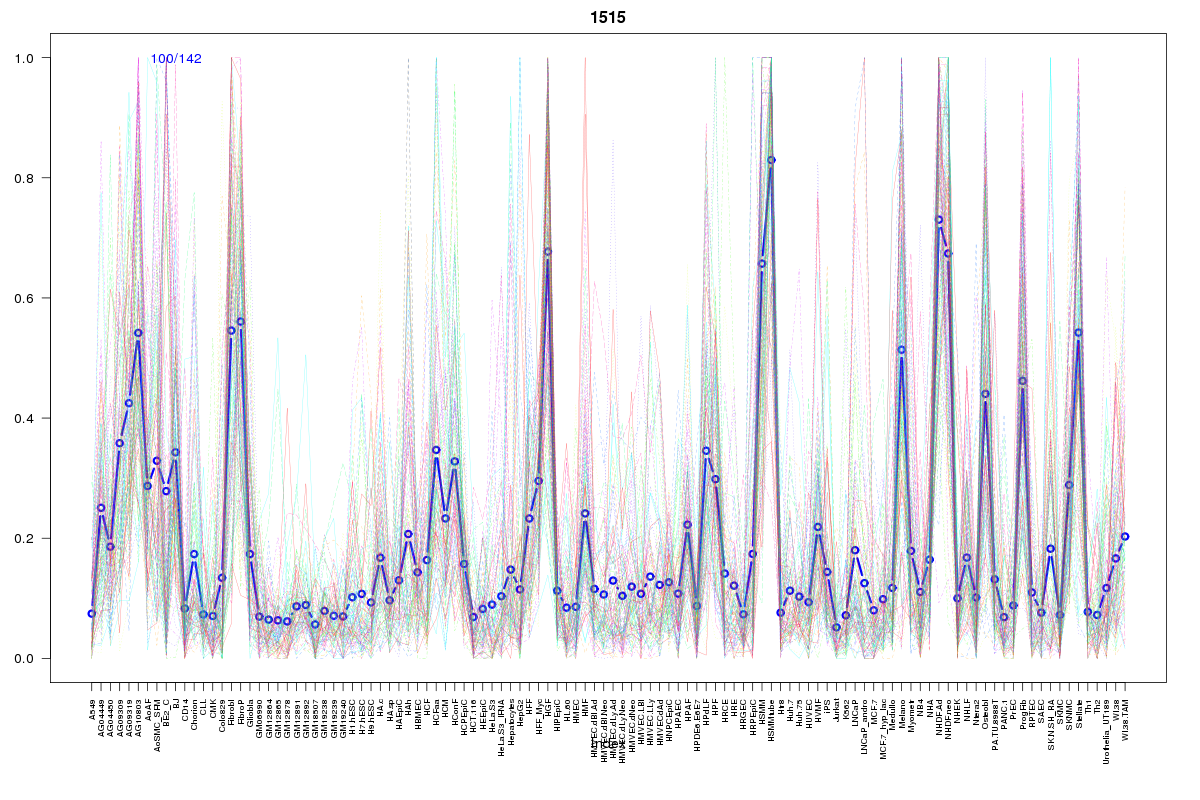 | 1515 | 1 |
 | 1113 | 1 |
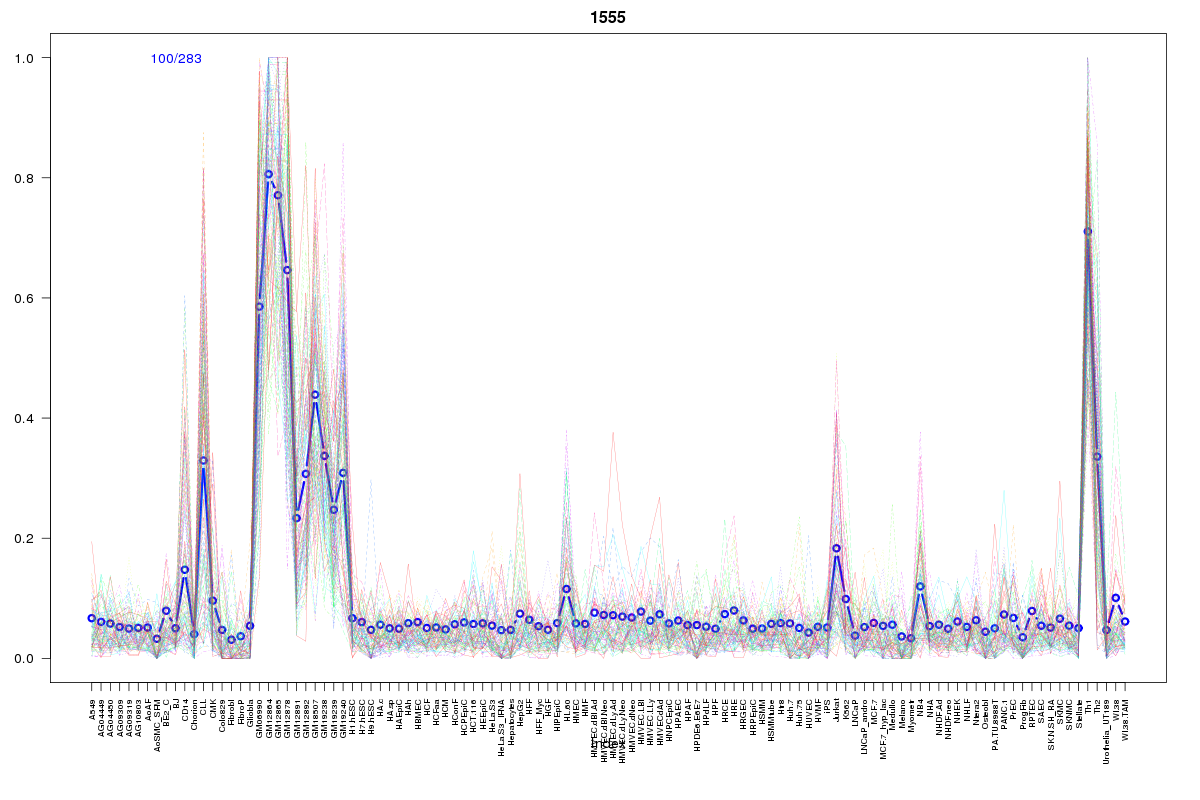 | 1555 | 1 |
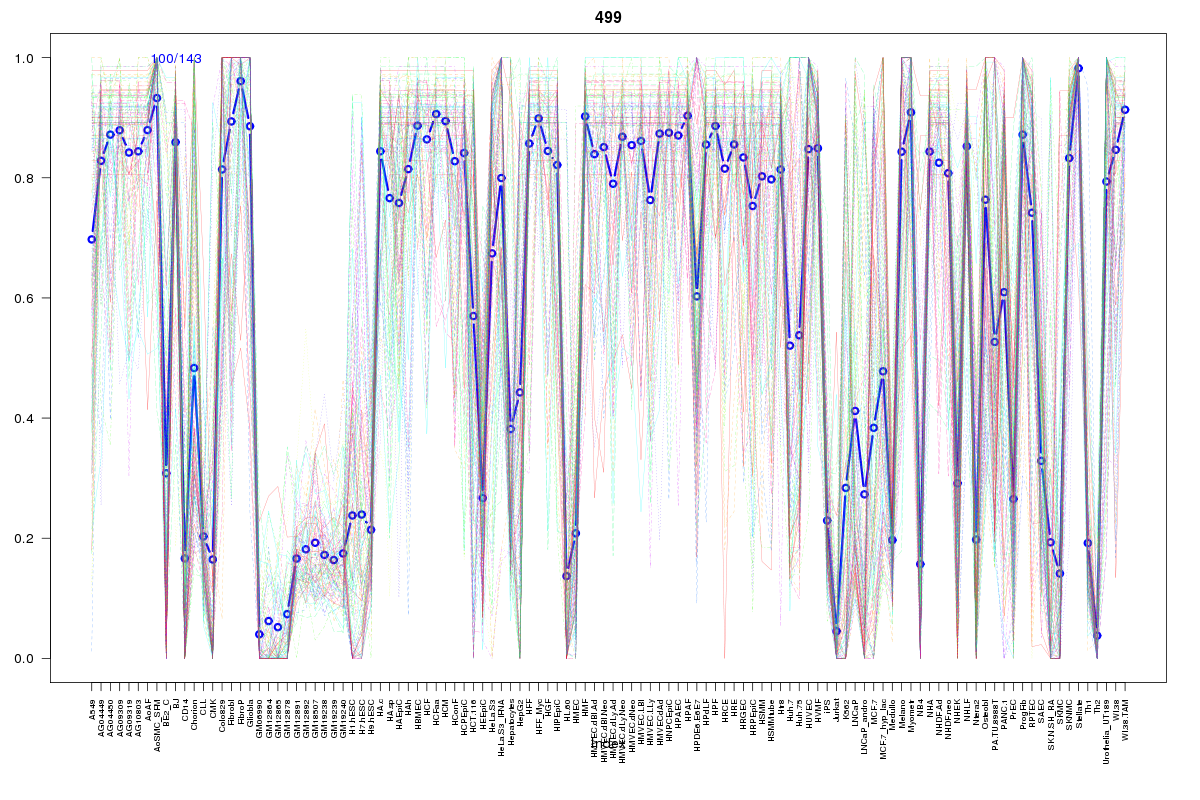 | 499 | 1 |
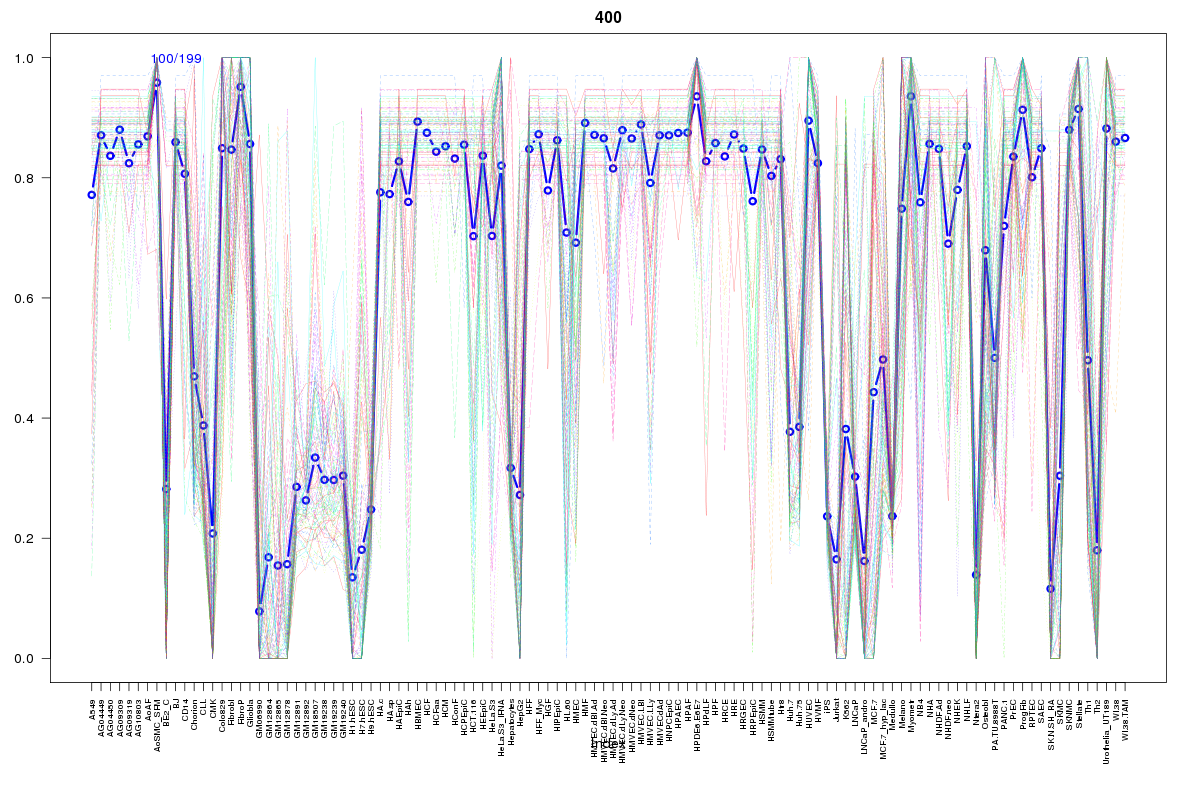 | 400 | 1 |
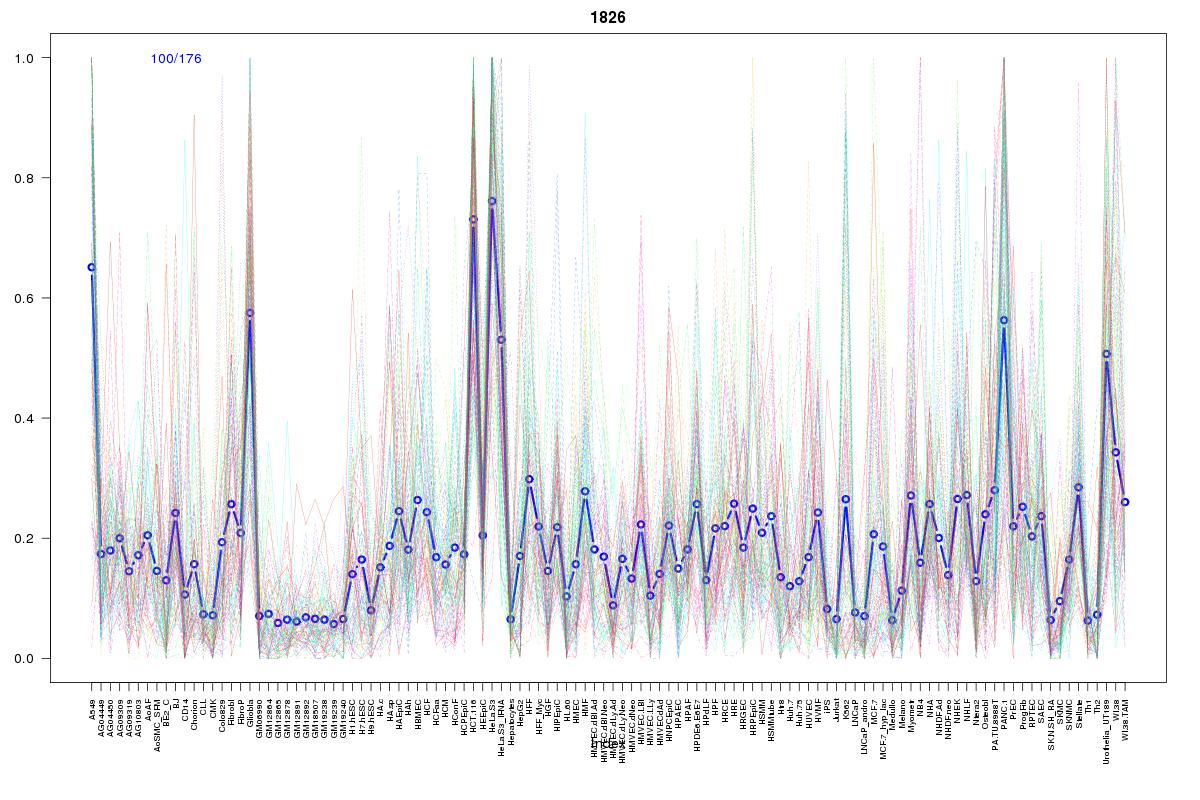 | 1826 | 1 |
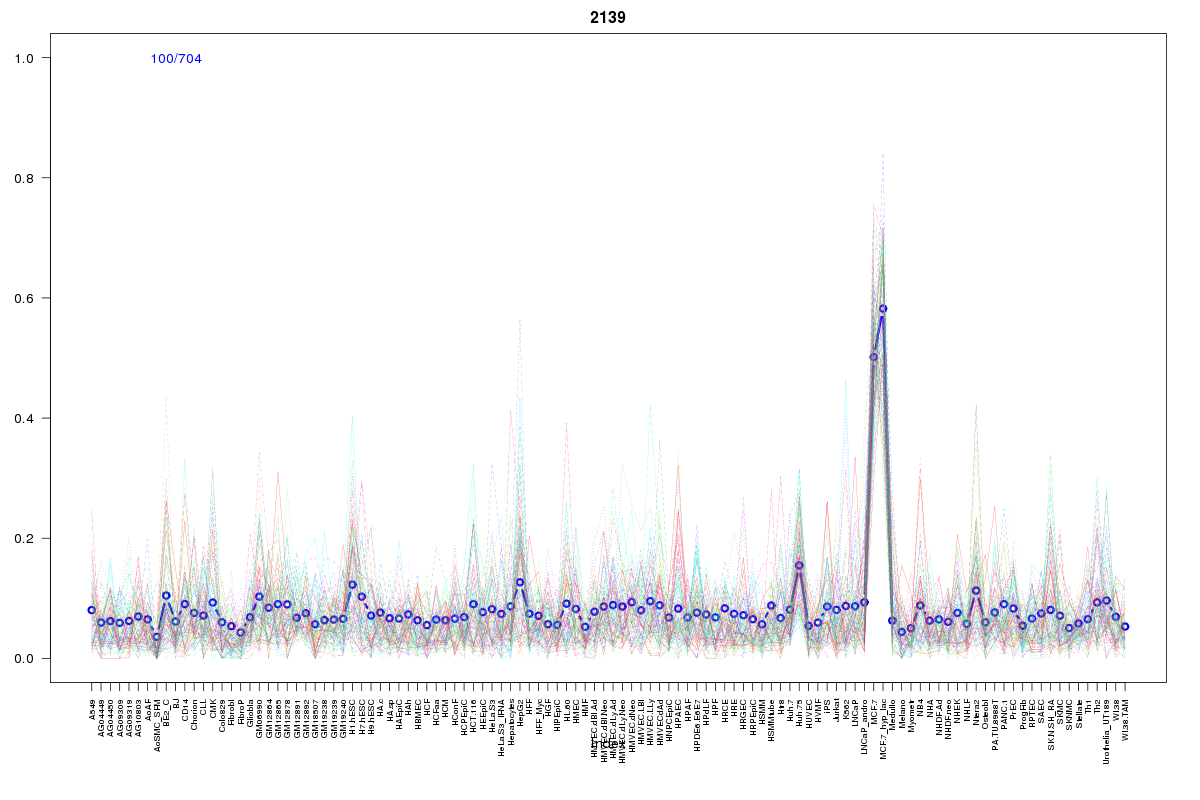 | 2139 | 1 |
 | 1779 | 1 |
 | 2107 | 1 |
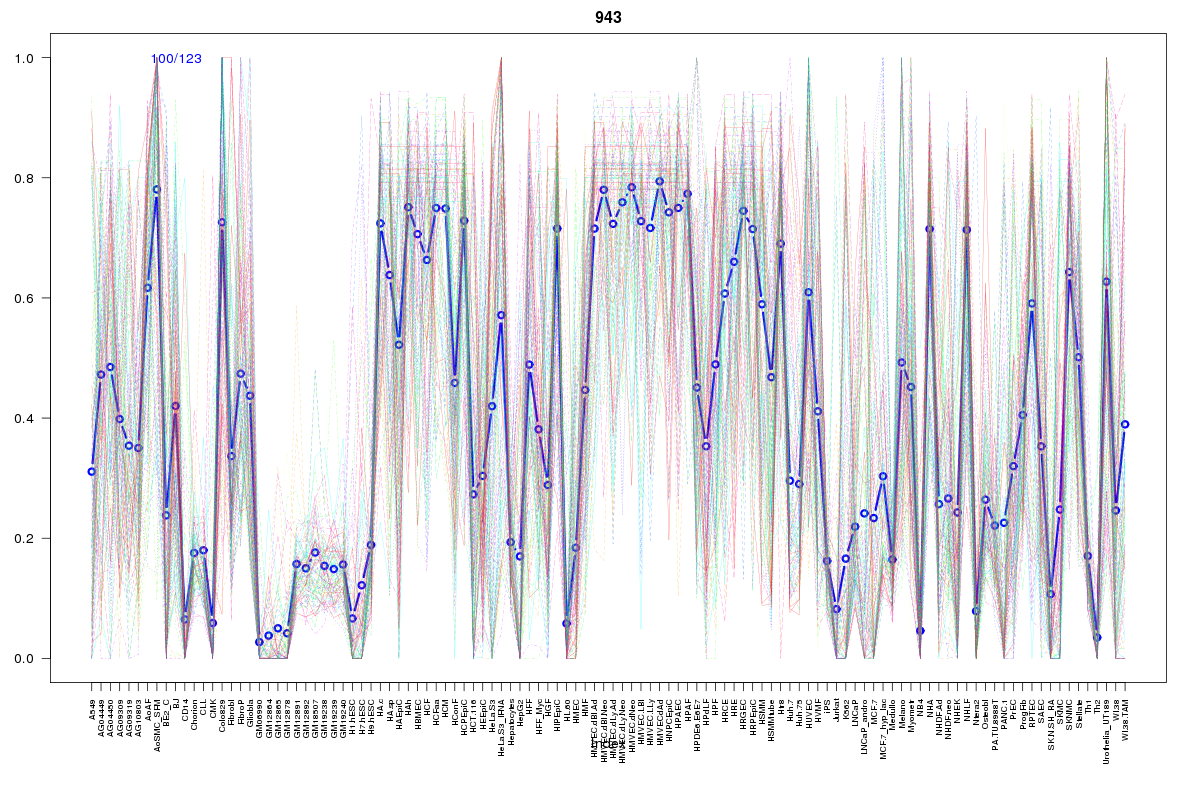 | 943 | 1 |
 | 1825 | 1 |
 | 2028 | 1 |
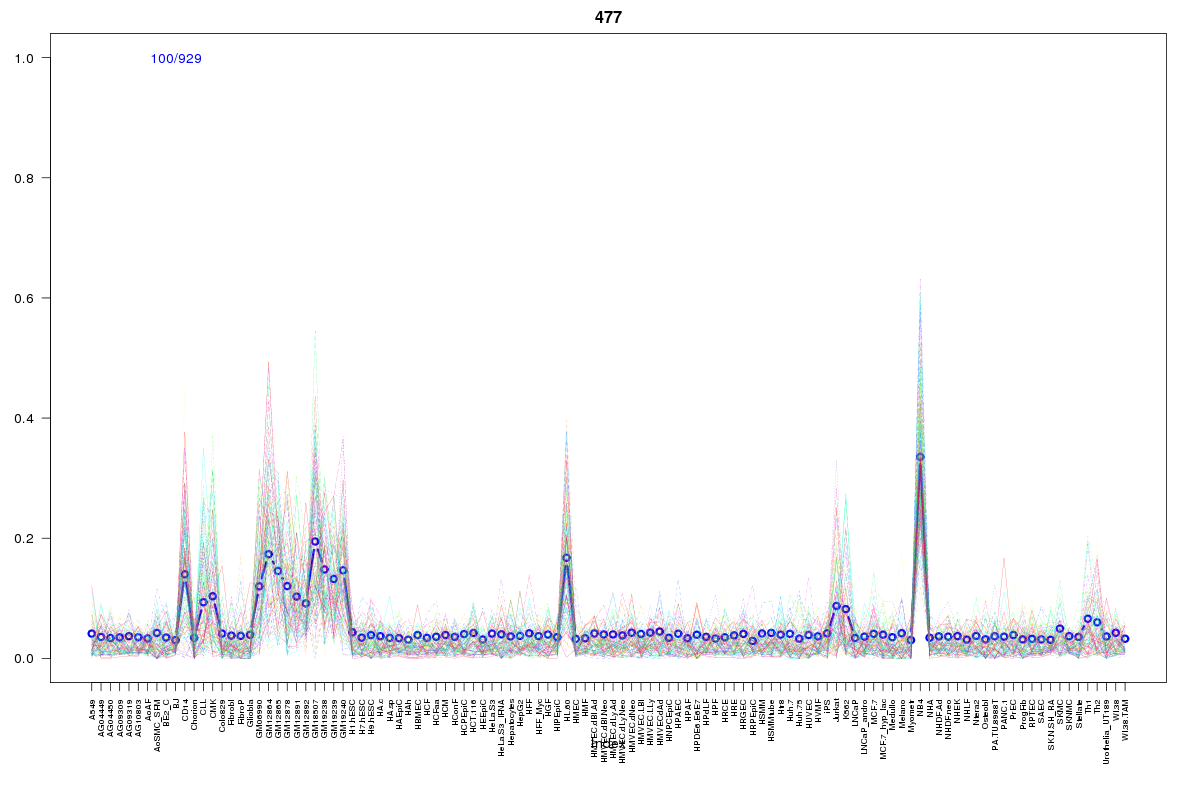 | 477 | 1 |
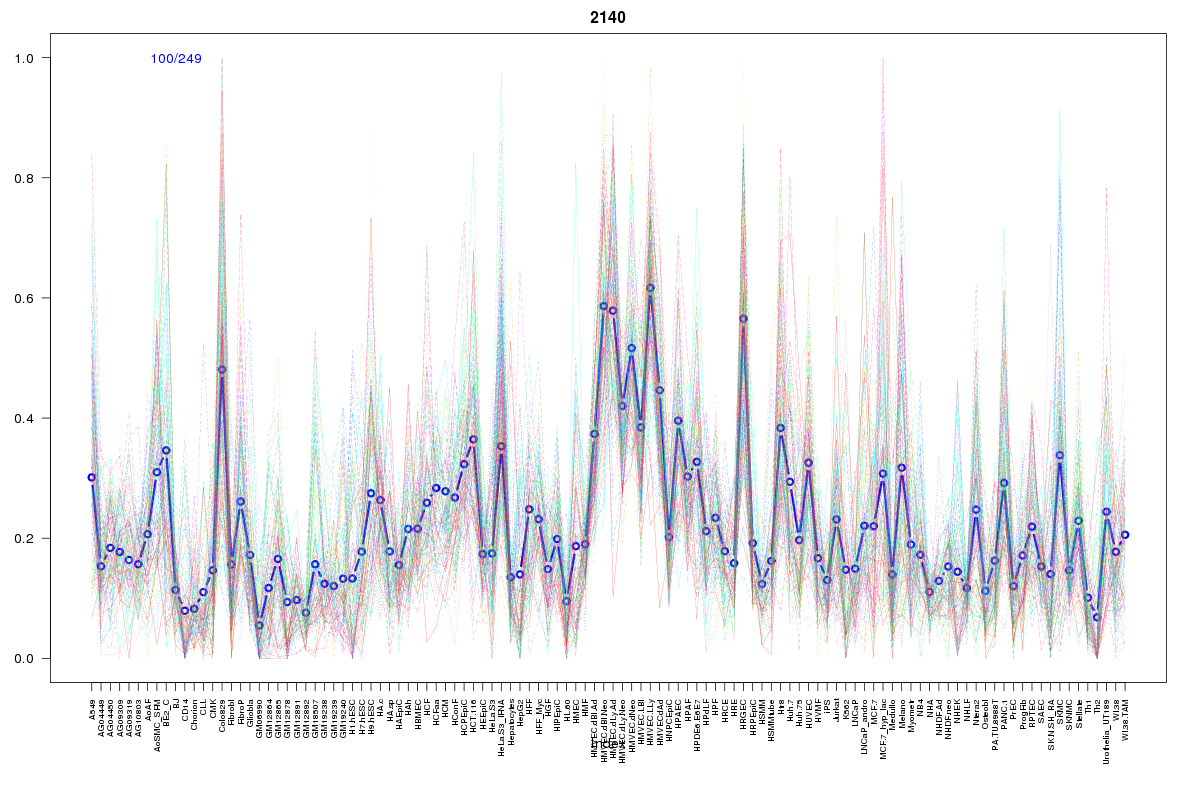 | 2140 | 1 |
 | 795 | 1 |
 | 1589 | 1 |
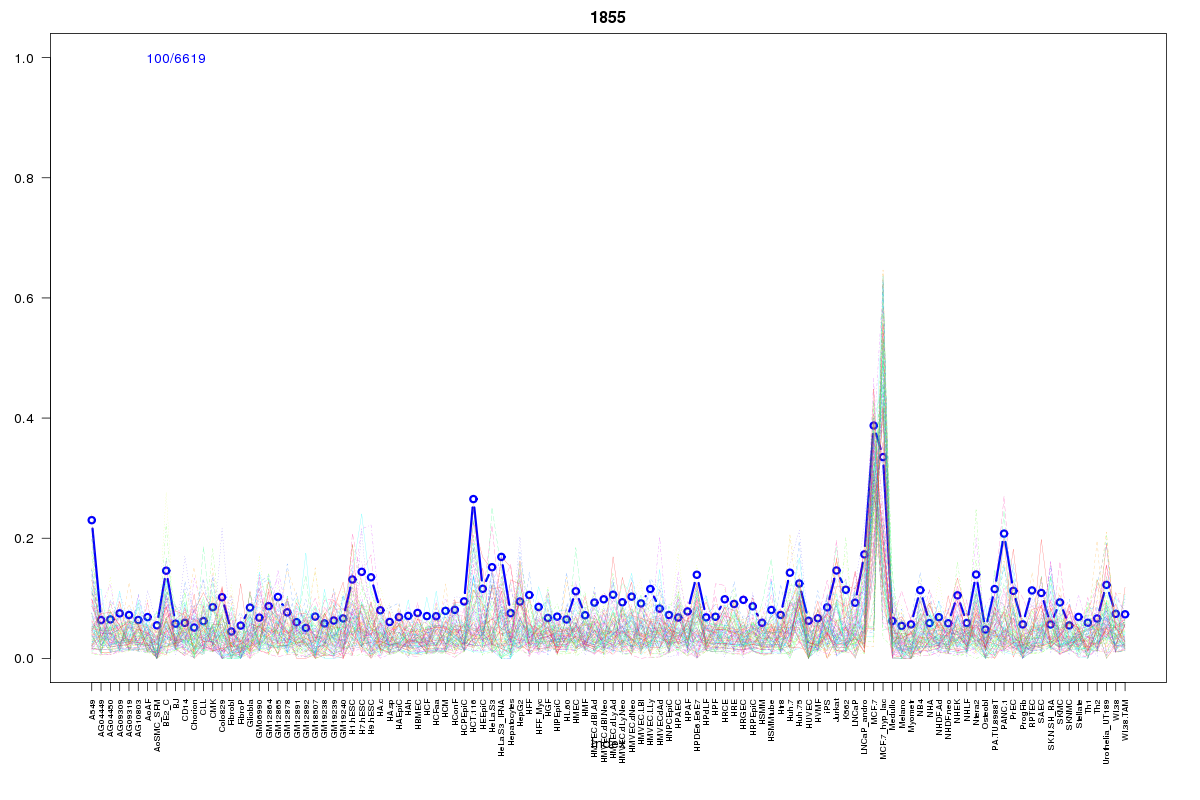 | 1855 | 1 |
Resources
BED file downloads
Connects to 96 DHS sitesTop 10 Correlated DHS Sites
p-values indiciate significant higher or lower correlation| Location | Cluster | P-value |
|---|---|---|
| chr20:50366800-50366950 | 550 | 0 |
| chr20:50179400-50179550 | 499 | 0.001 |
| chr20:50369000-50369150 | 549 | 0.001 |
| chr20:50369220-50369370 | 2490 | 0.002 |
| chr20:50312260-50312410 | 695 | 0.002 |
| chr20:50368845-50368995 | 941 | 0.002 |
| chr20:50377720-50377870 | 941 | 0.003 |
| chr20:50179240-50179390 | 86 | 0.003 |
| chr20:50367105-50367255 | 2391 | 0.003 |
| chr20:50180440-50180590 | 696 | 0.003 |
| chr20:50248000-50248150 | 400 | 0.003 |
External Databases
UCSCEnsembl (ENSG00000054793)