Gene: LIMA1
chr12: 50569570-50677329Expression Profile
(log scale)
Graphical Connections
Distribution of linked clusters:
You may find it interesting if many of the connected DHS sites belong to the same cluster.| Cluster Profile | Cluster ID | Number of DHS sites in this cluster |
|---|---|---|
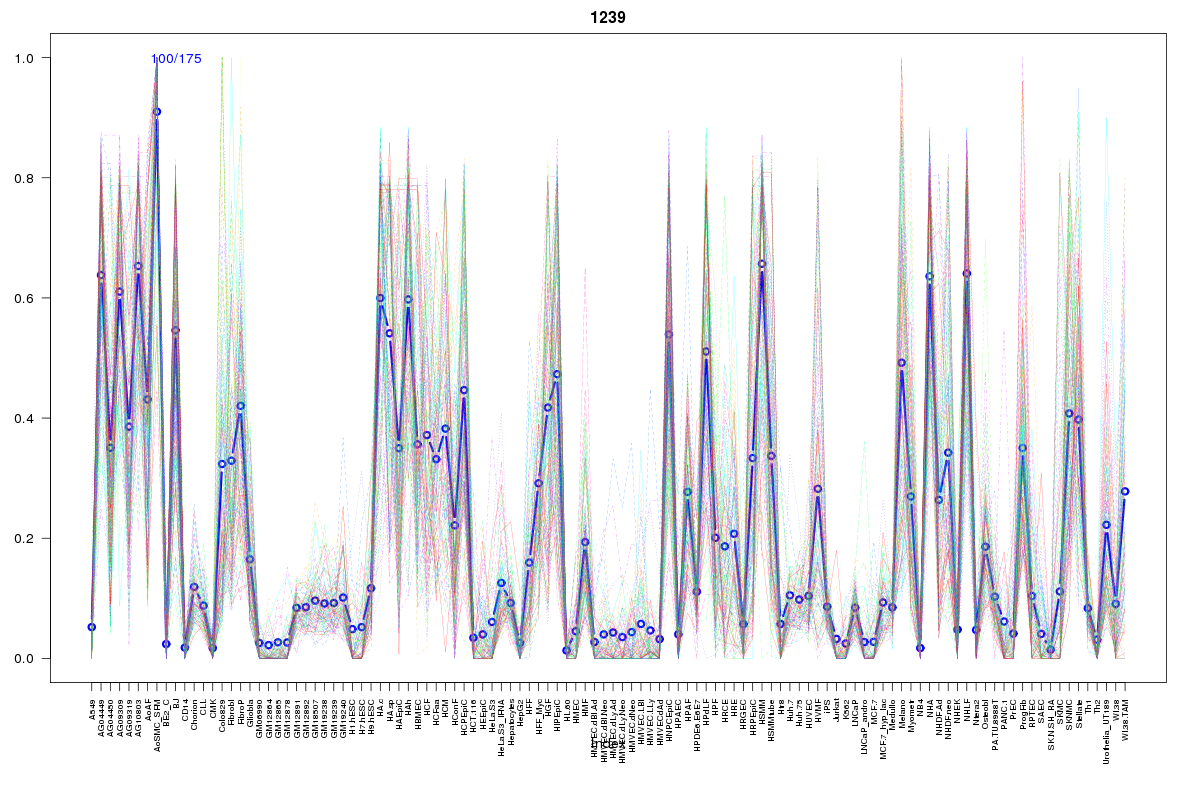 | 1239 | 2 |
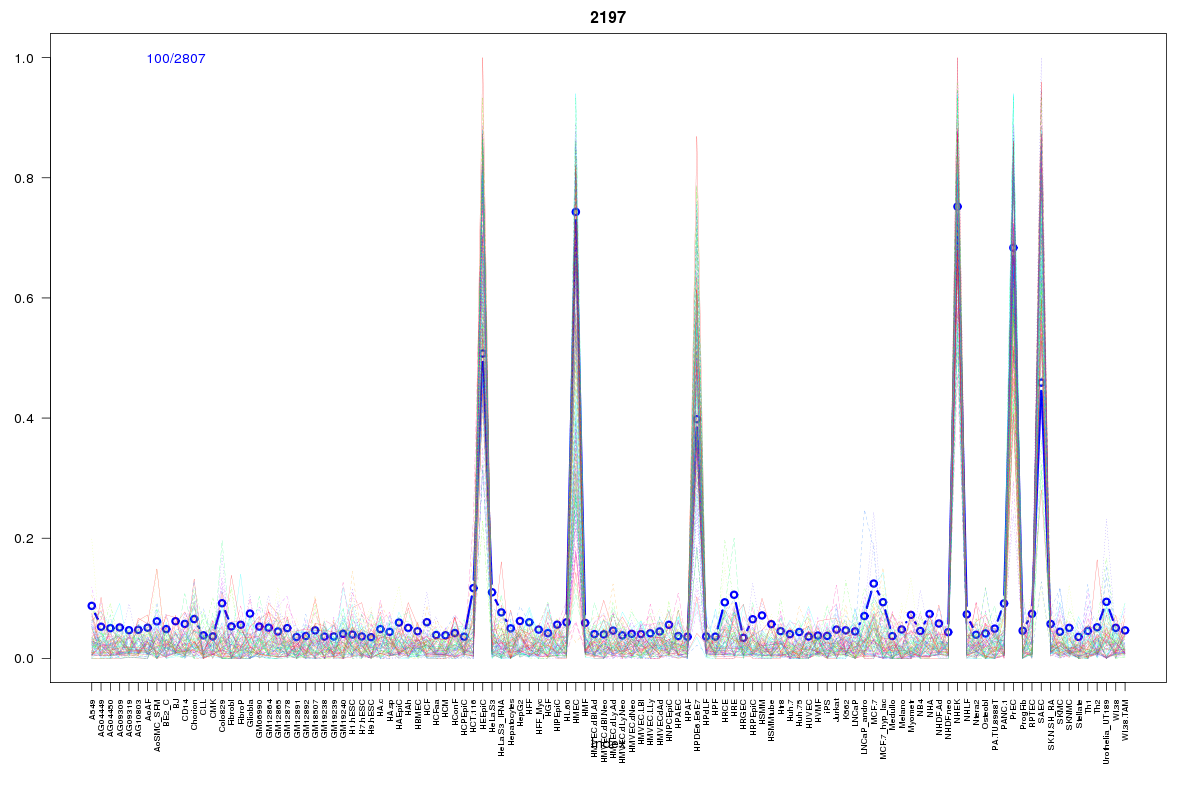 | 2197 | 2 |
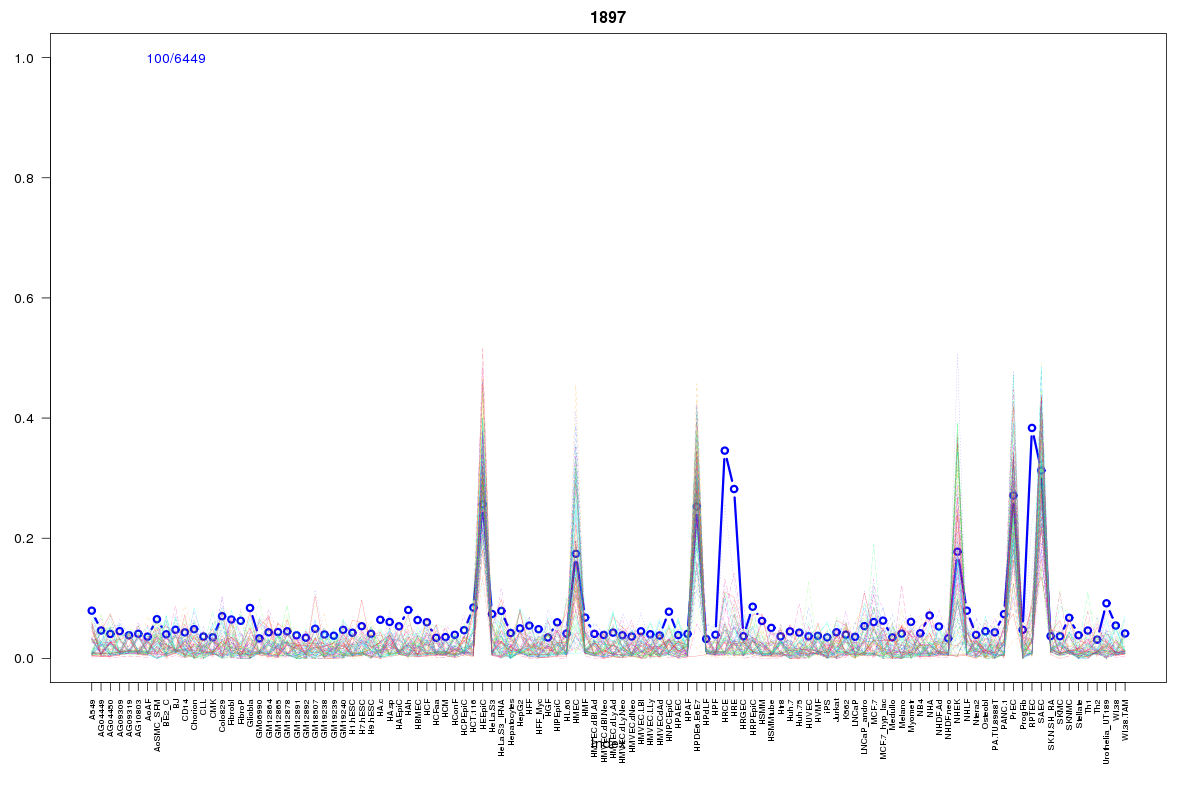 | 1897 | 2 |
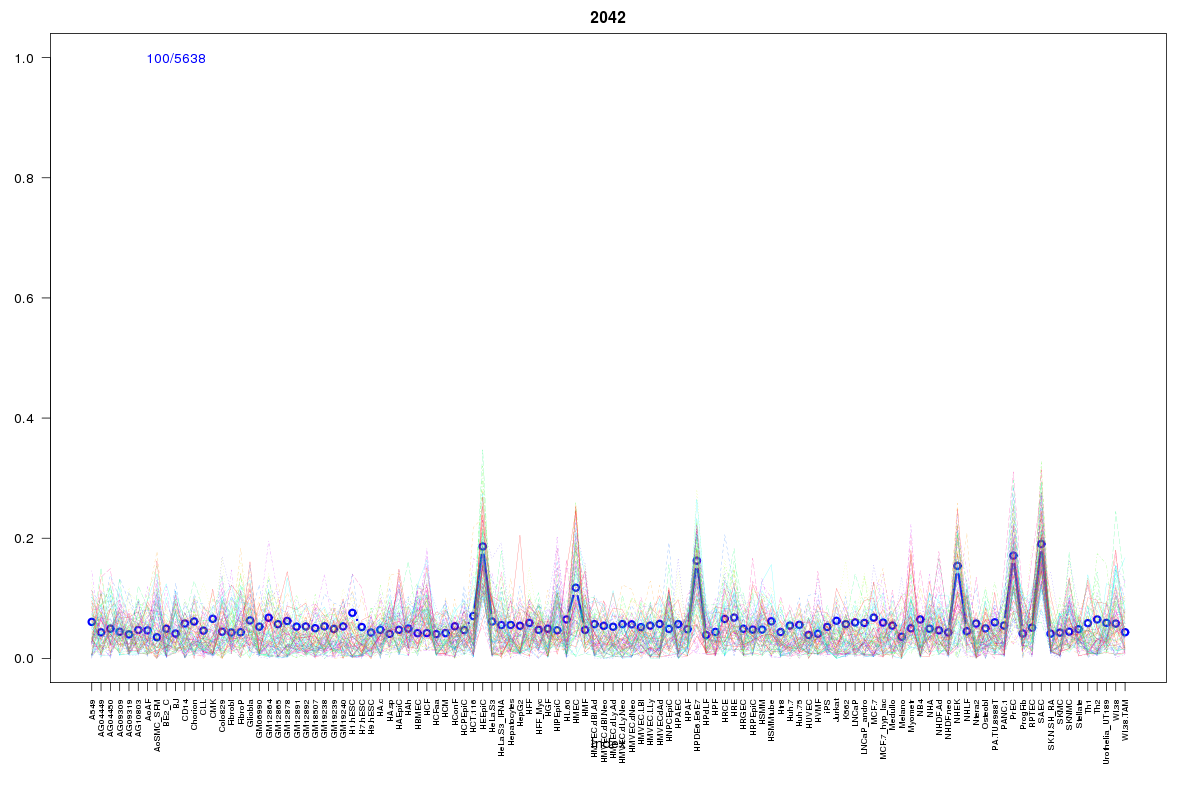 | 2042 | 1 |
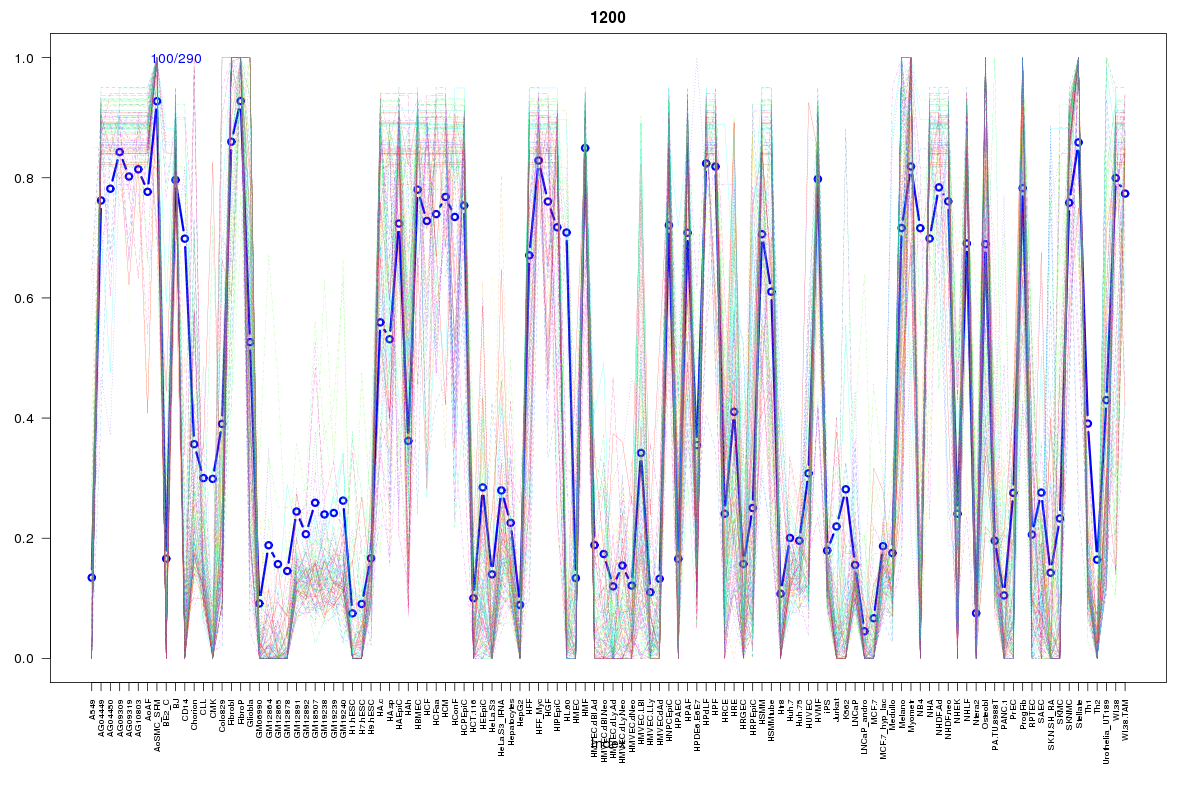 | 1200 | 1 |
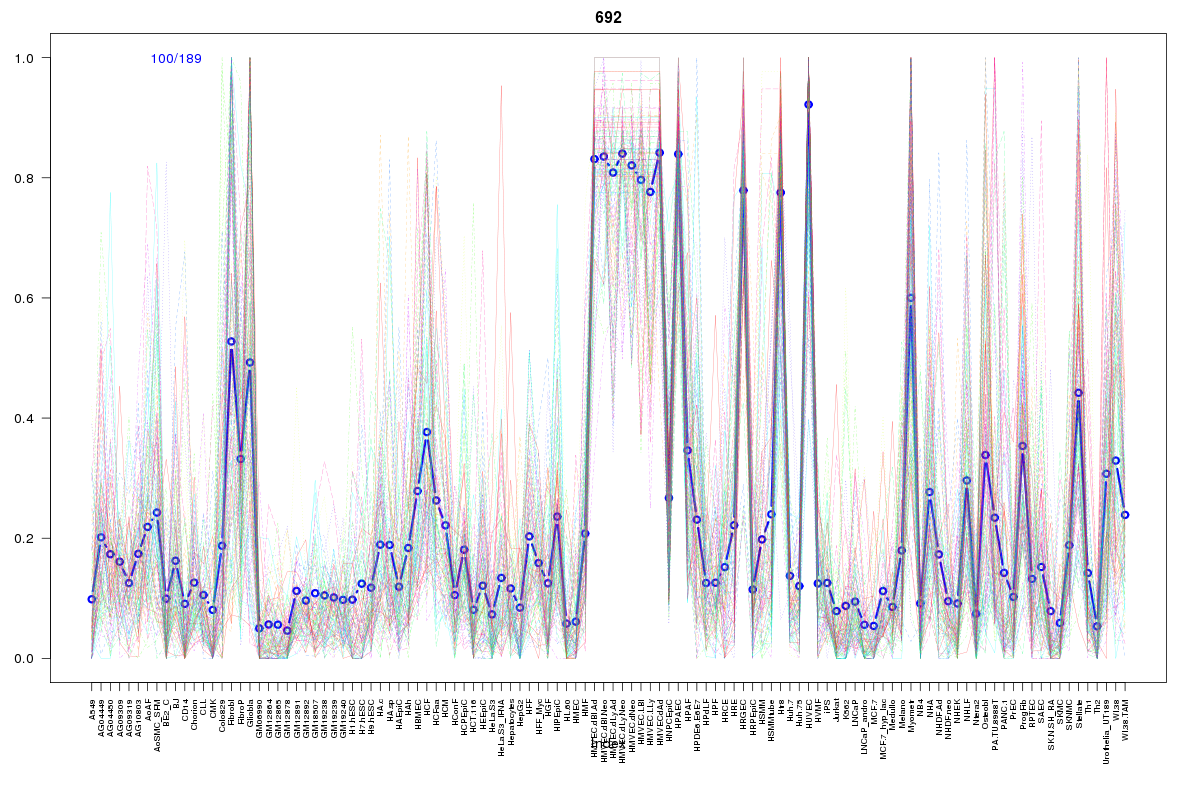 | 692 | 1 |
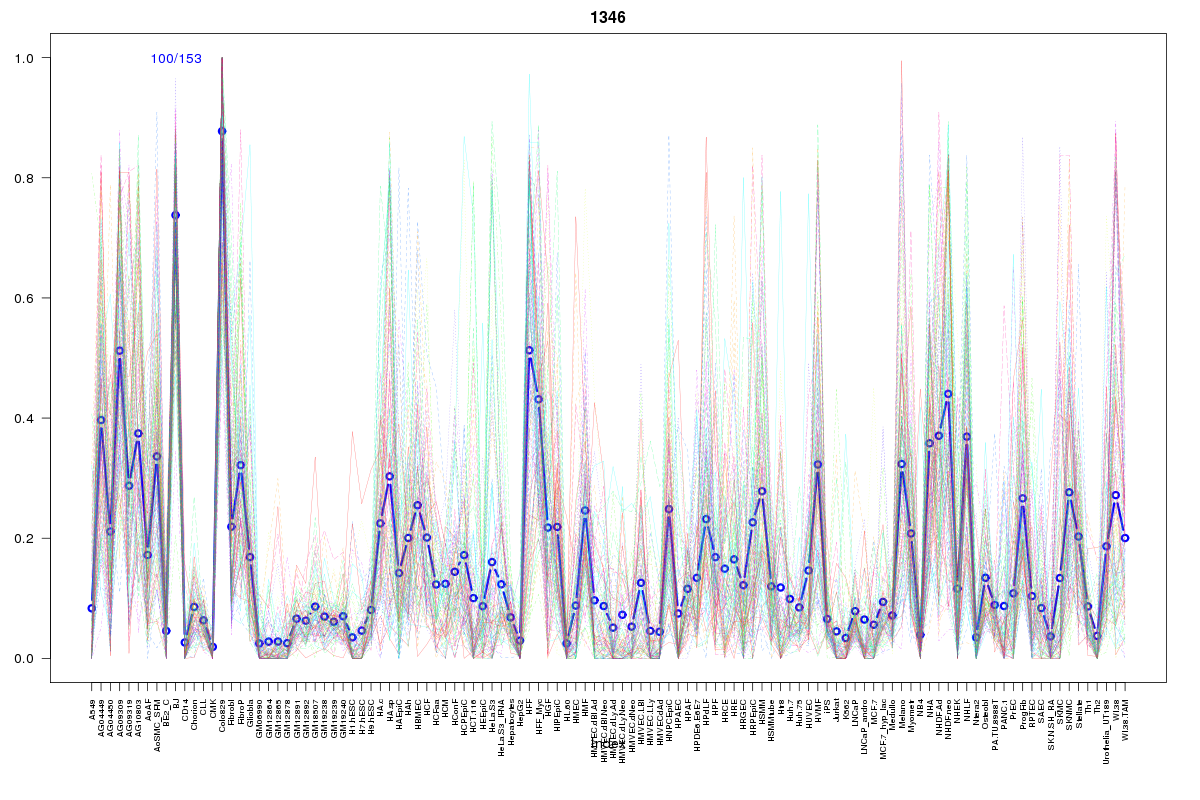 | 1346 | 1 |
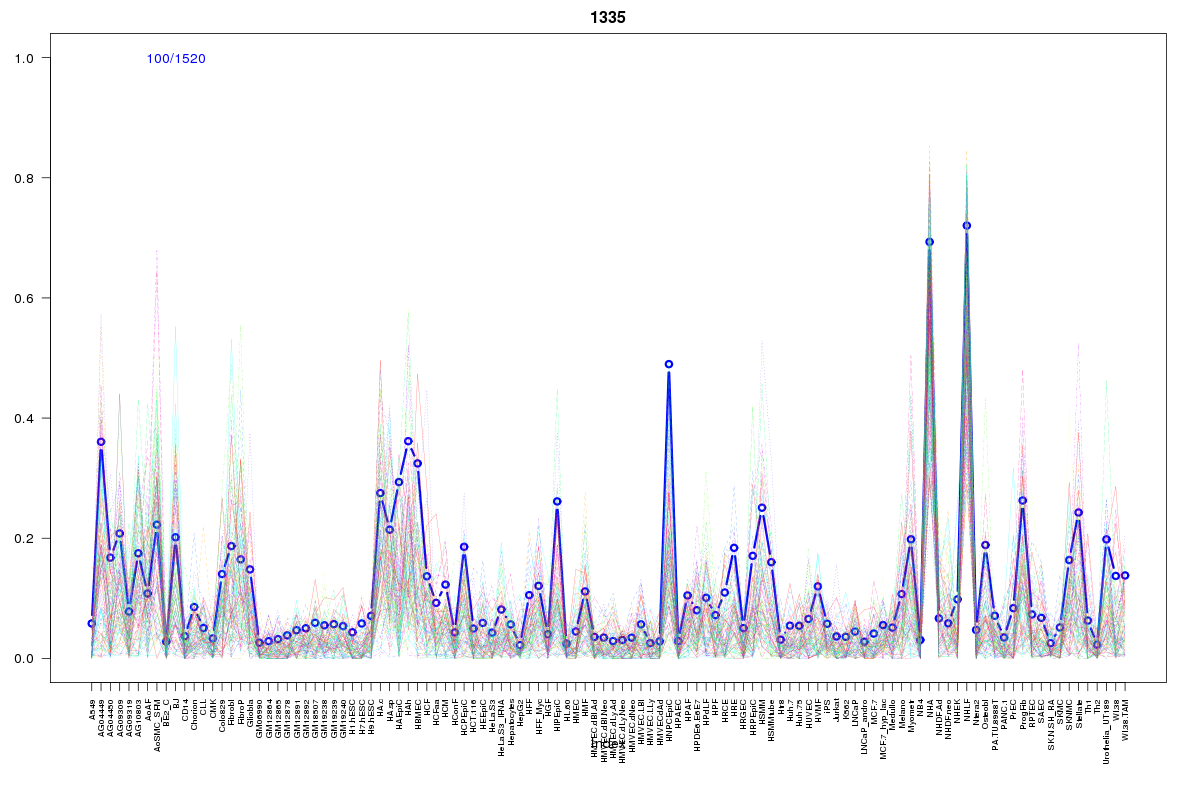 | 1335 | 1 |
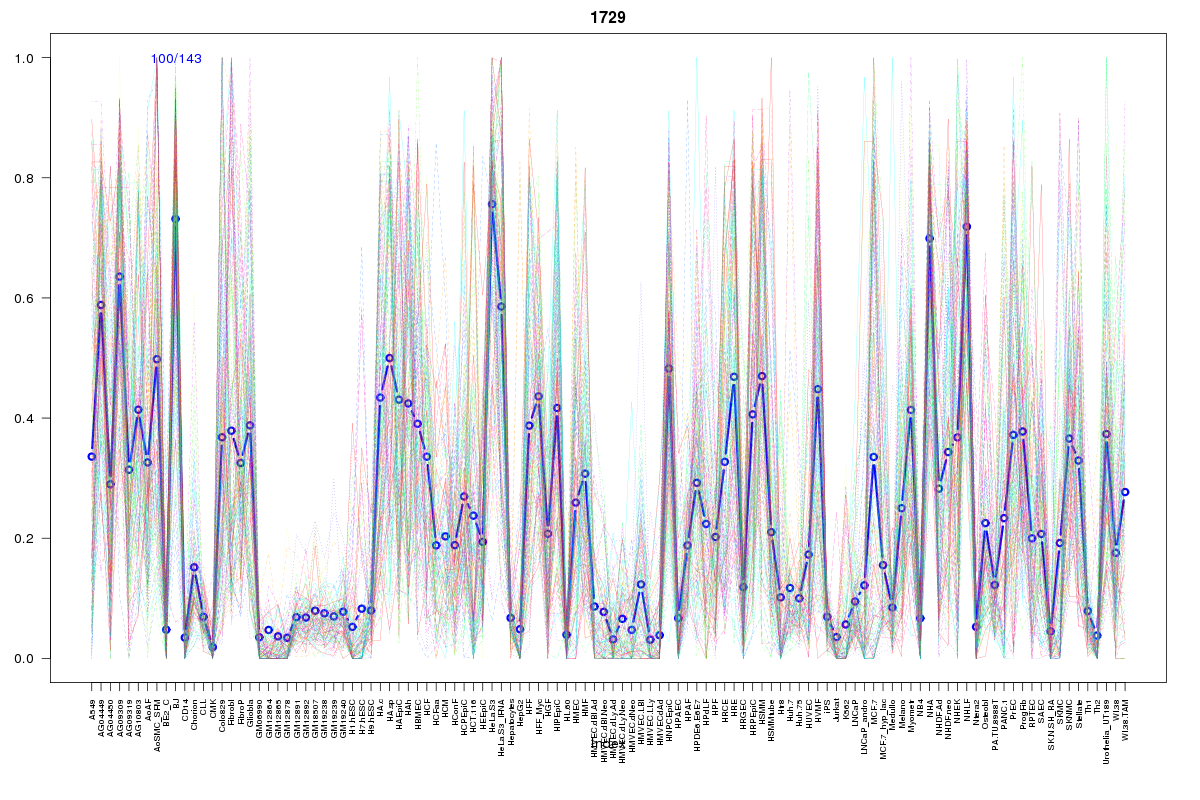 | 1729 | 1 |
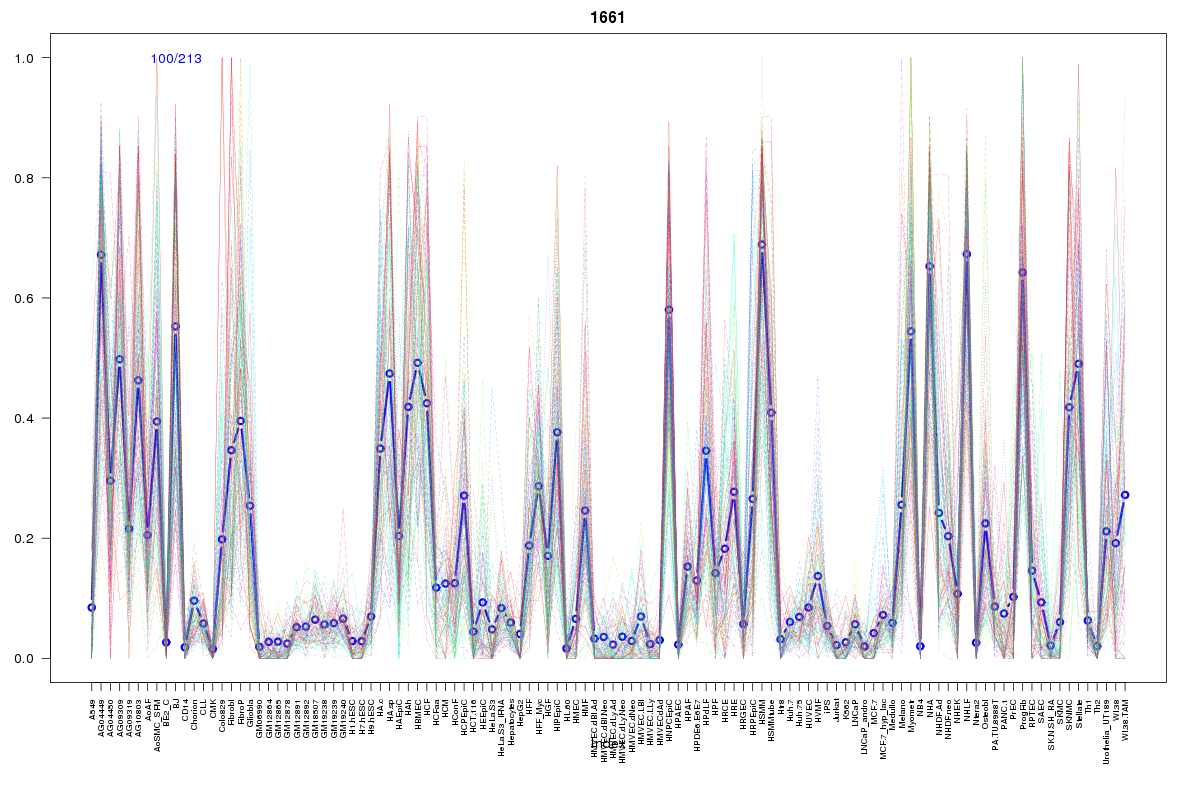 | 1661 | 1 |
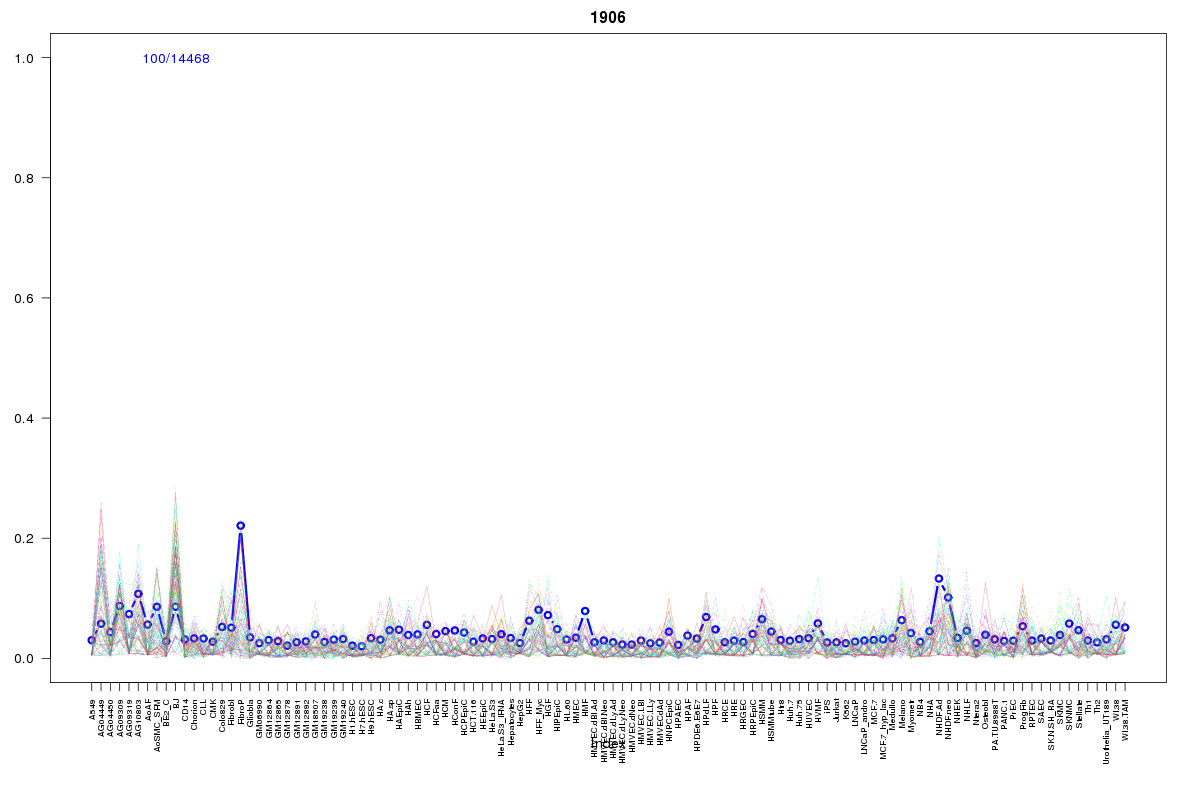 | 1906 | 1 |
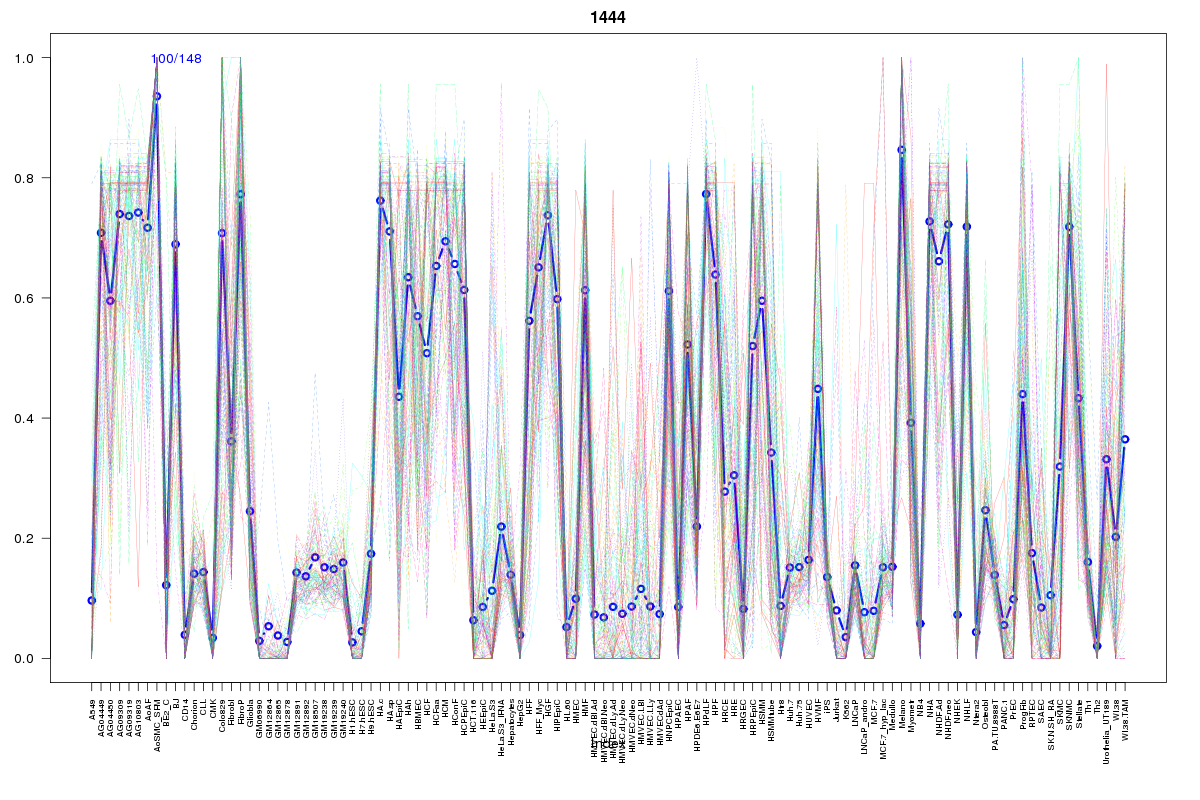 | 1444 | 1 |
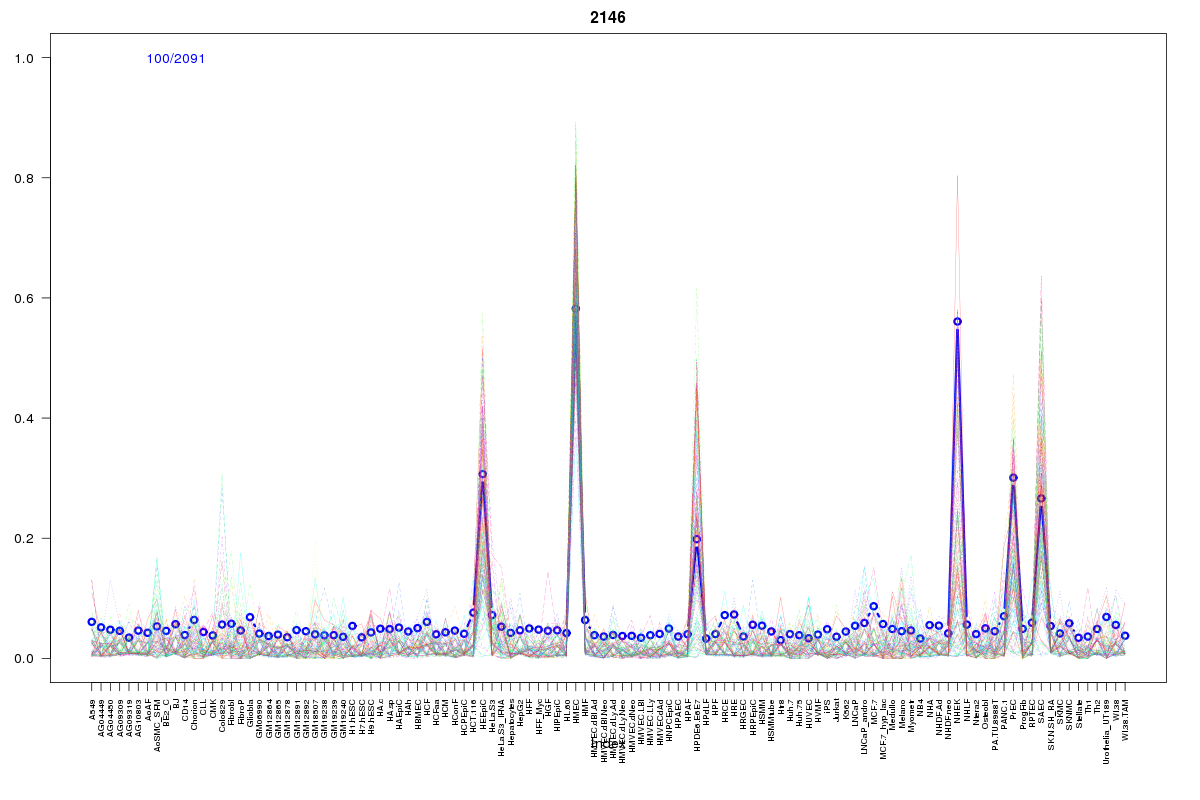 | 2146 | 1 |
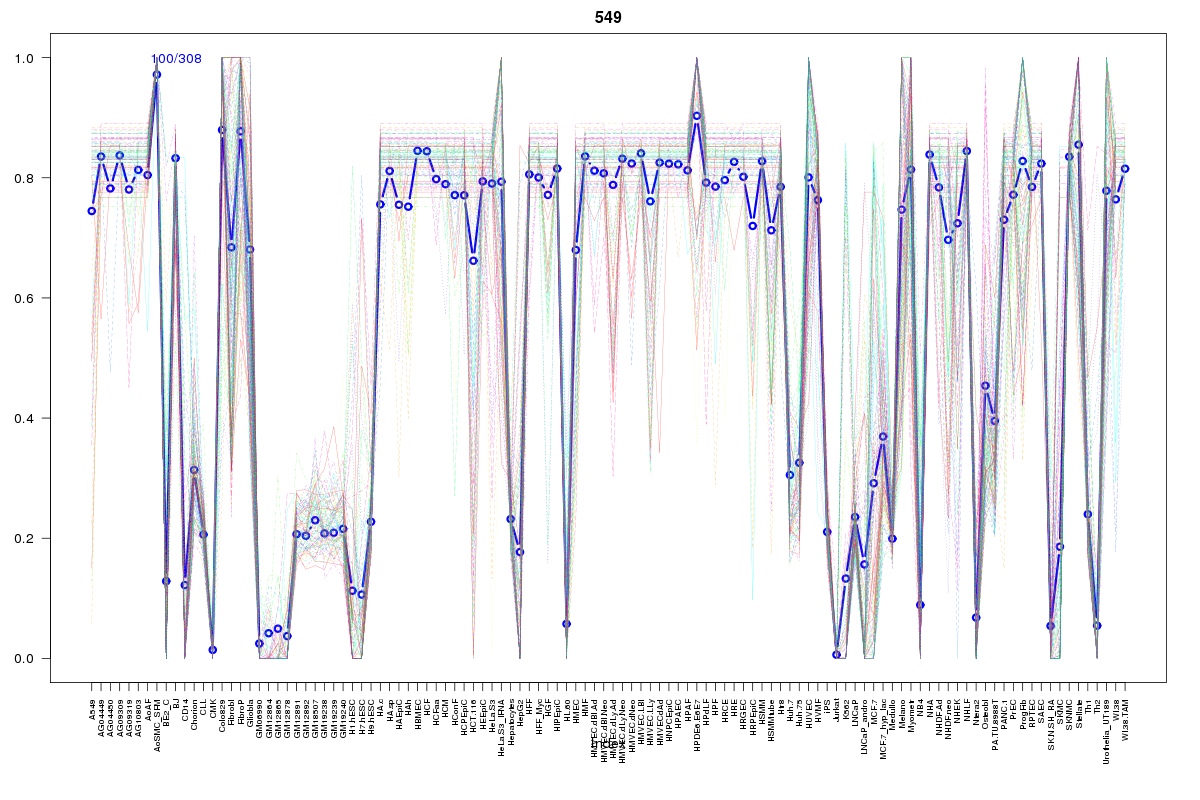 | 549 | 1 |
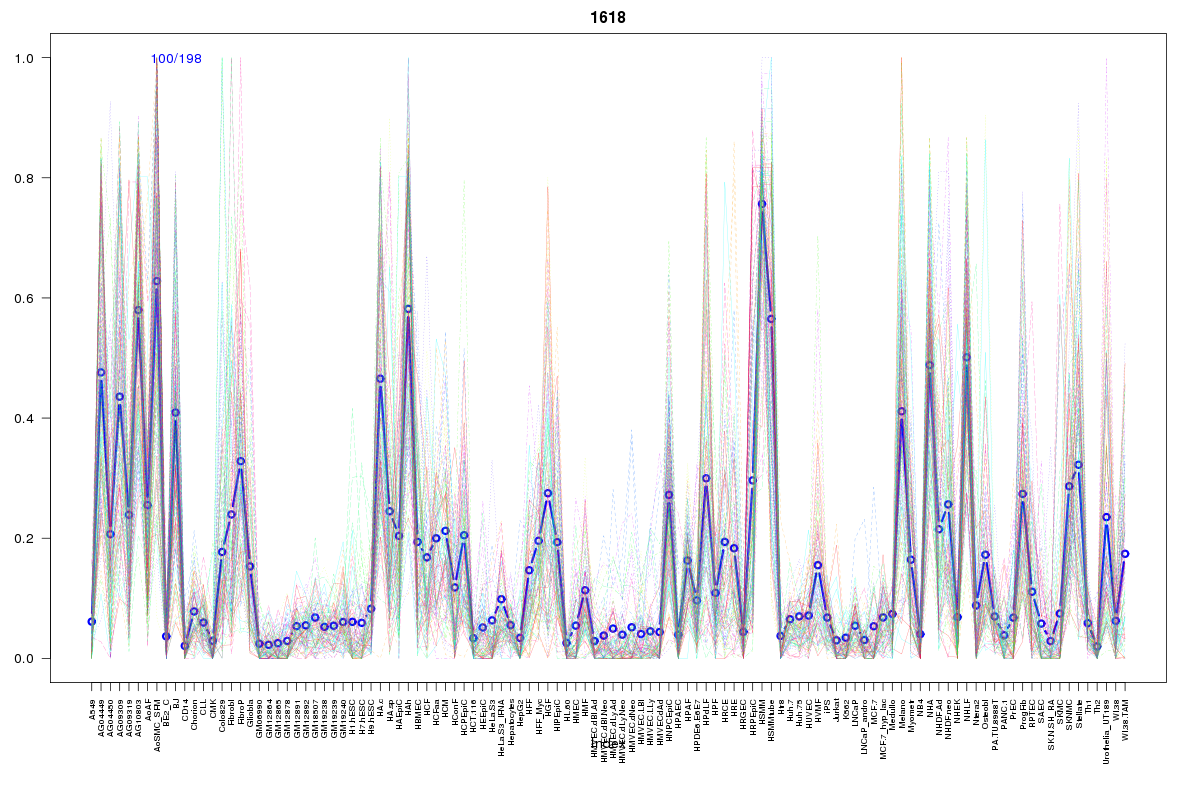 | 1618 | 1 |
 | 2298 | 1 |
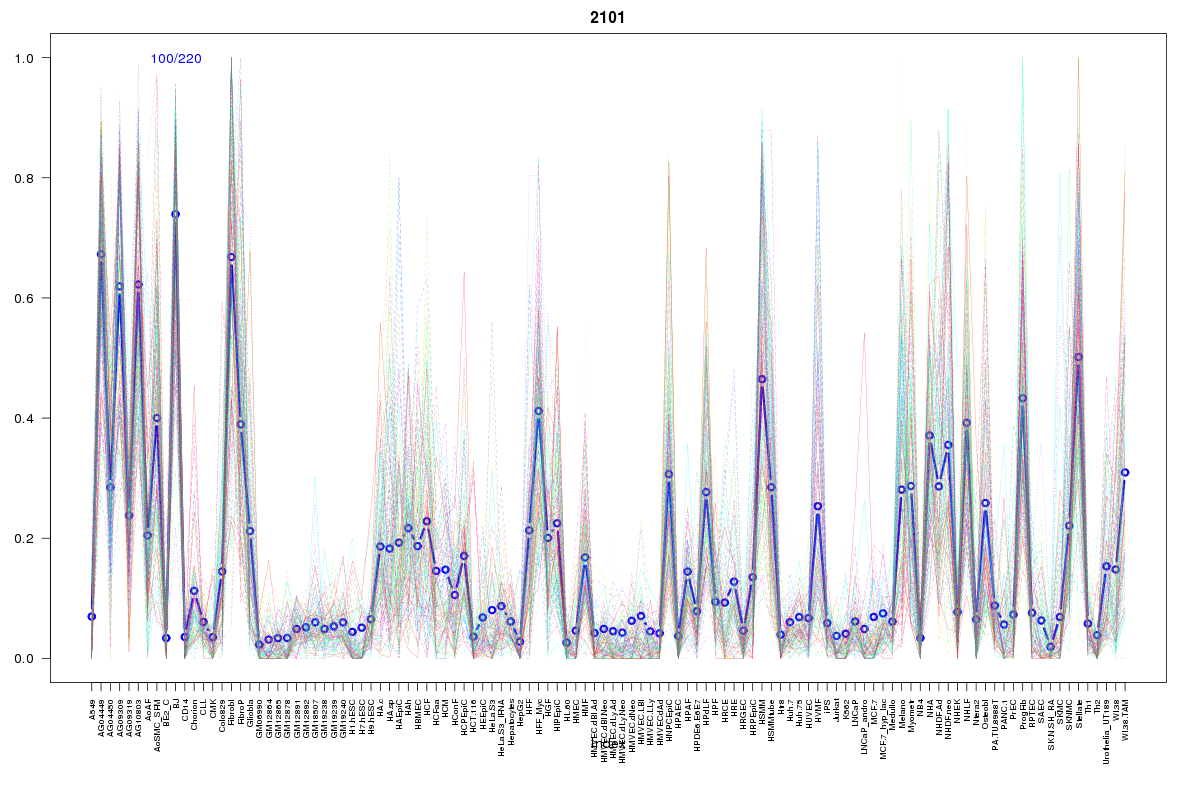 | 2101 | 1 |
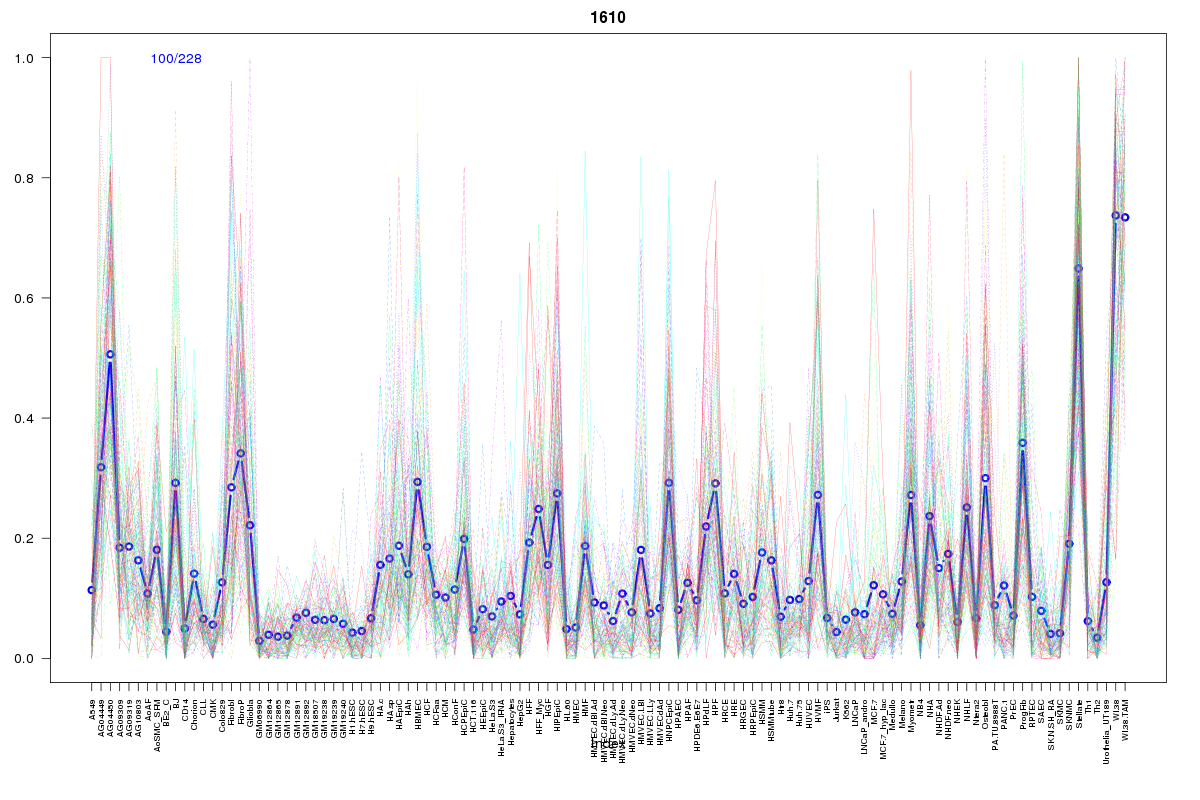 | 1610 | 1 |
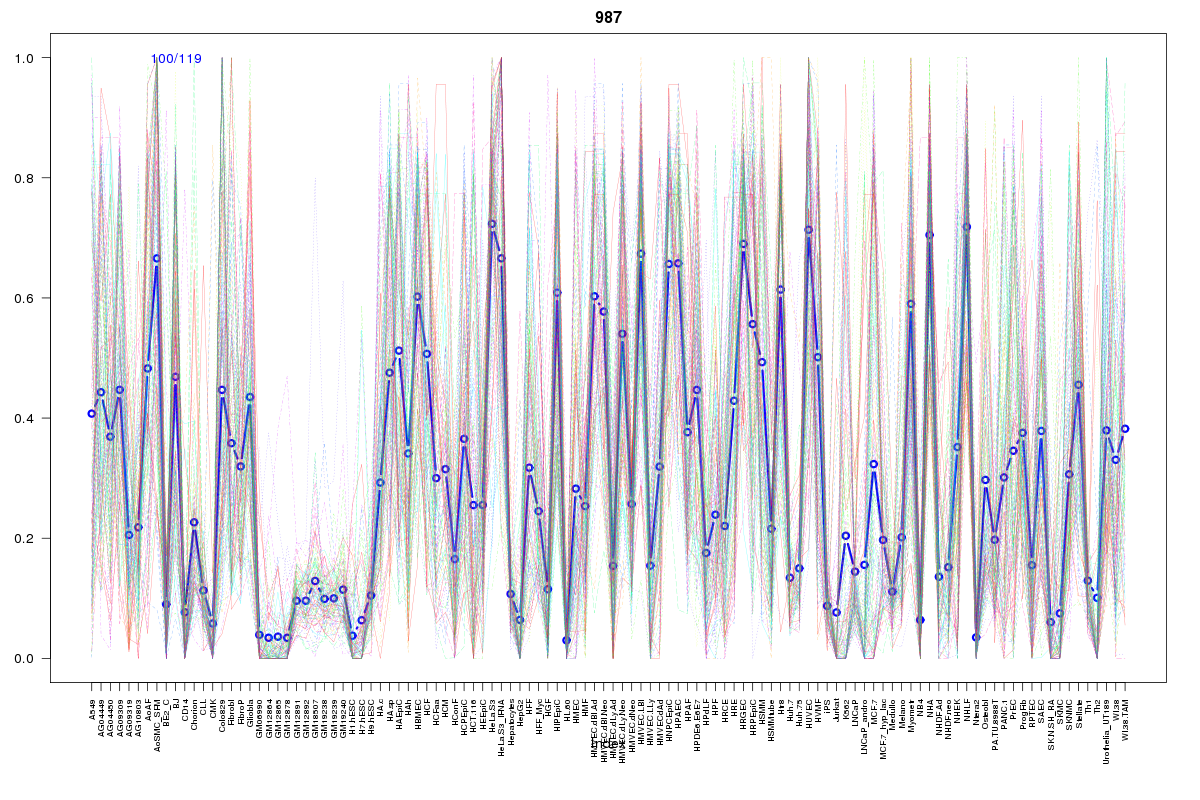 | 987 | 1 |
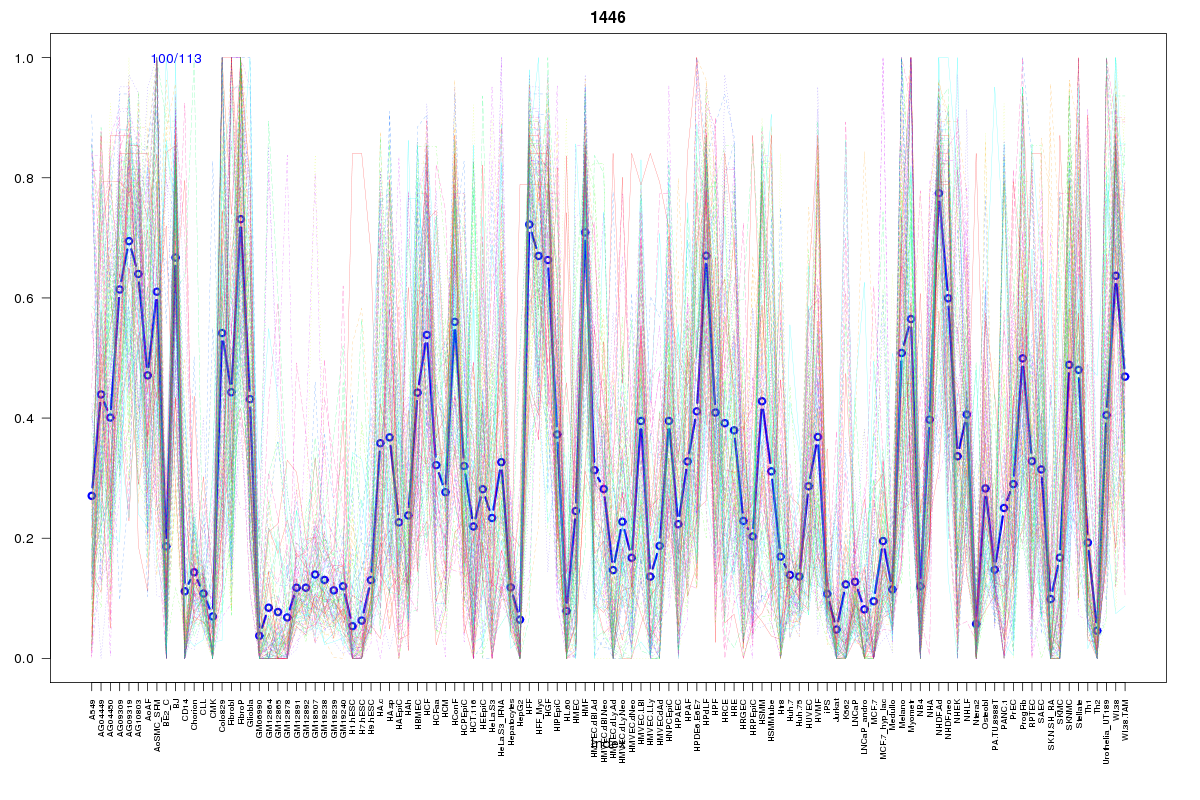 | 1446 | 1 |
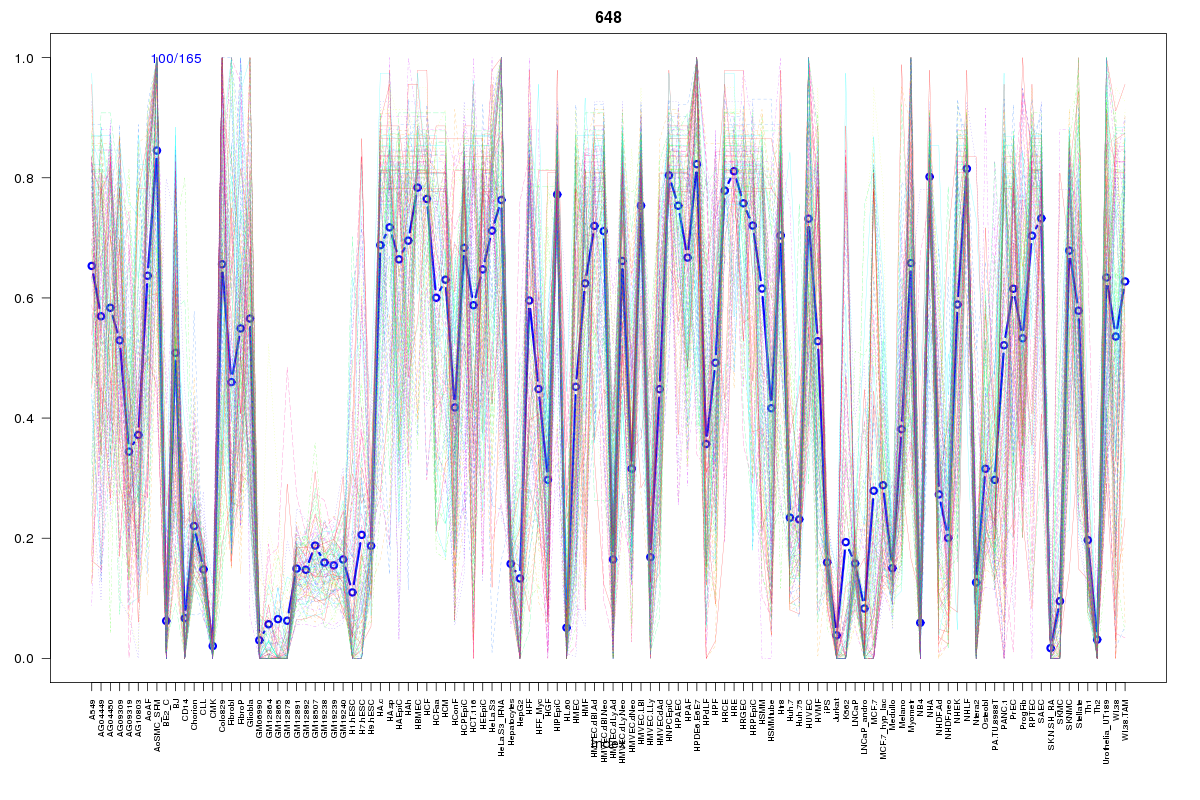 | 648 | 1 |
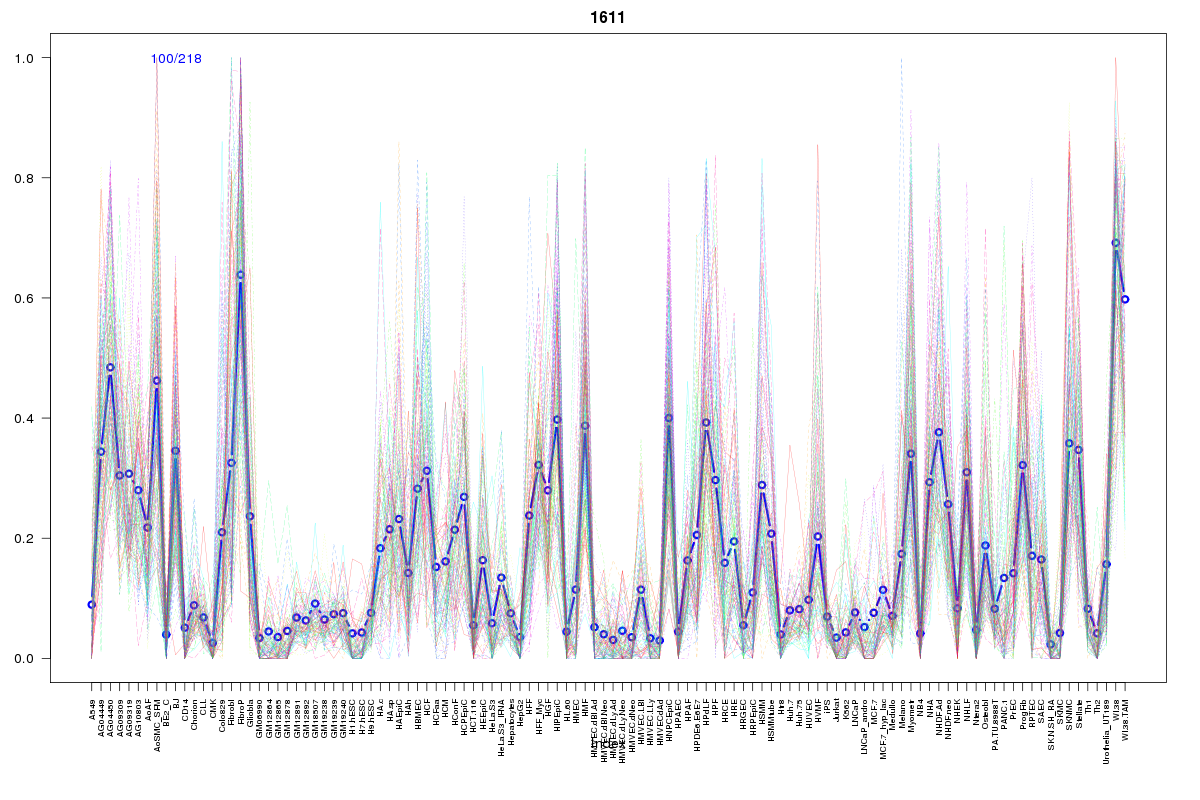 | 1611 | 1 |
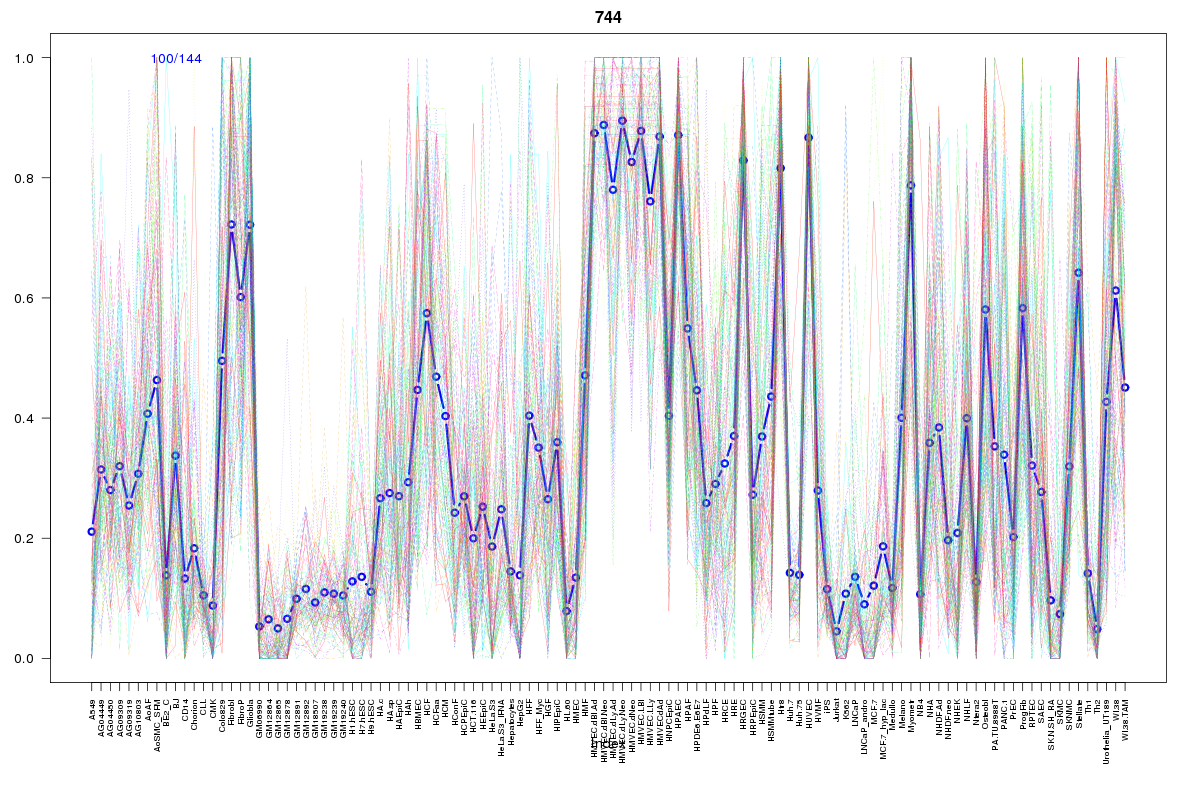 | 744 | 1 |
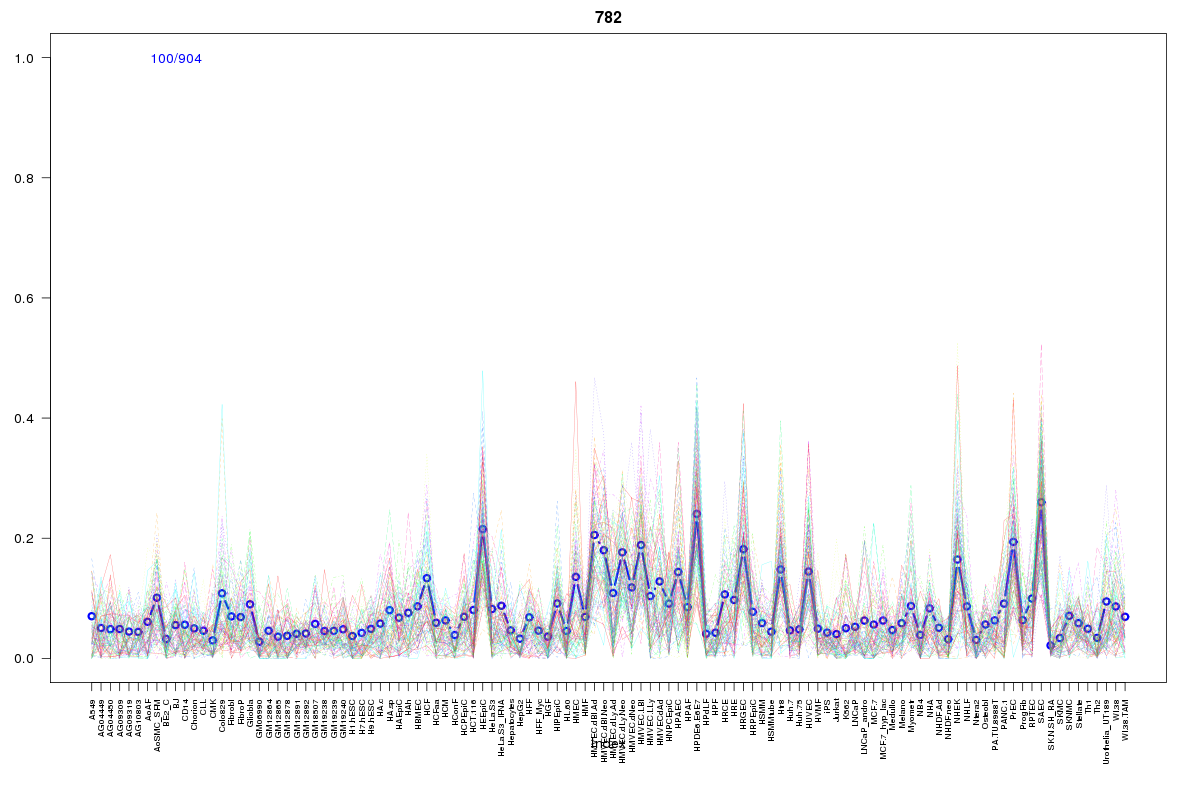 | 782 | 1 |
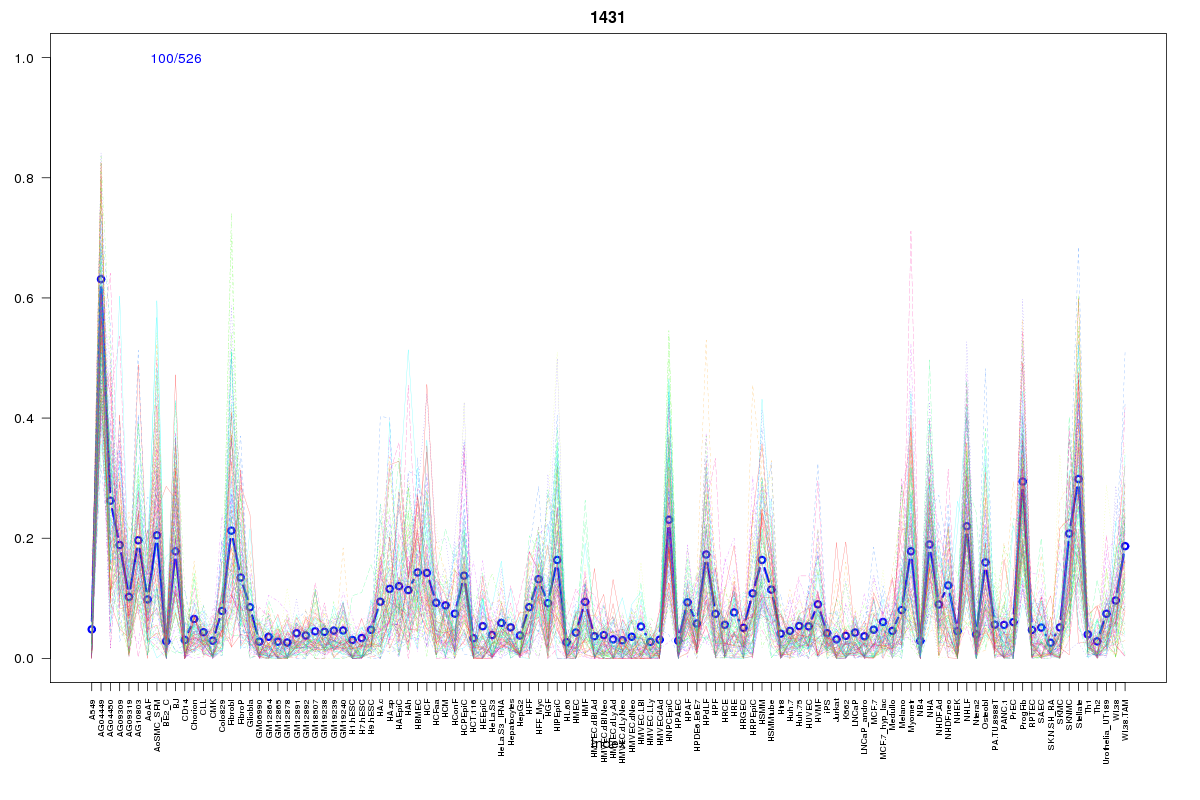 | 1431 | 1 |
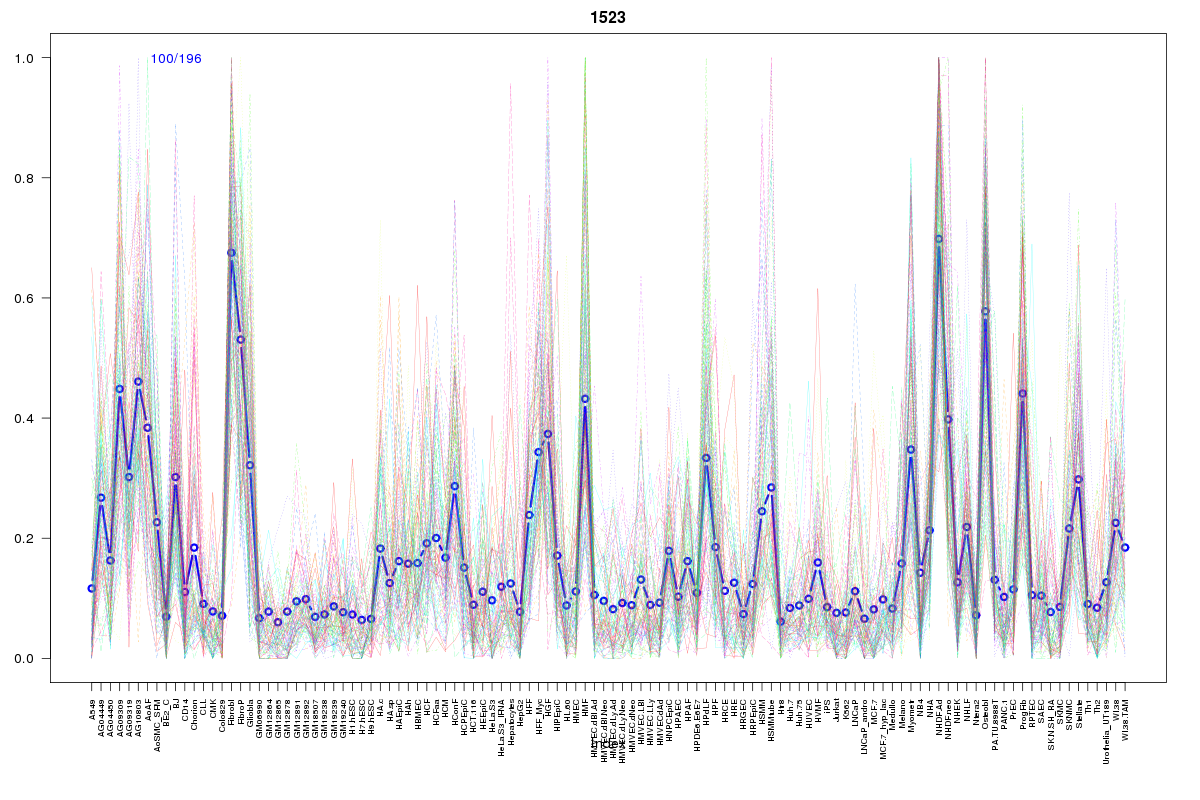 | 1523 | 1 |
 | 1755 | 1 |
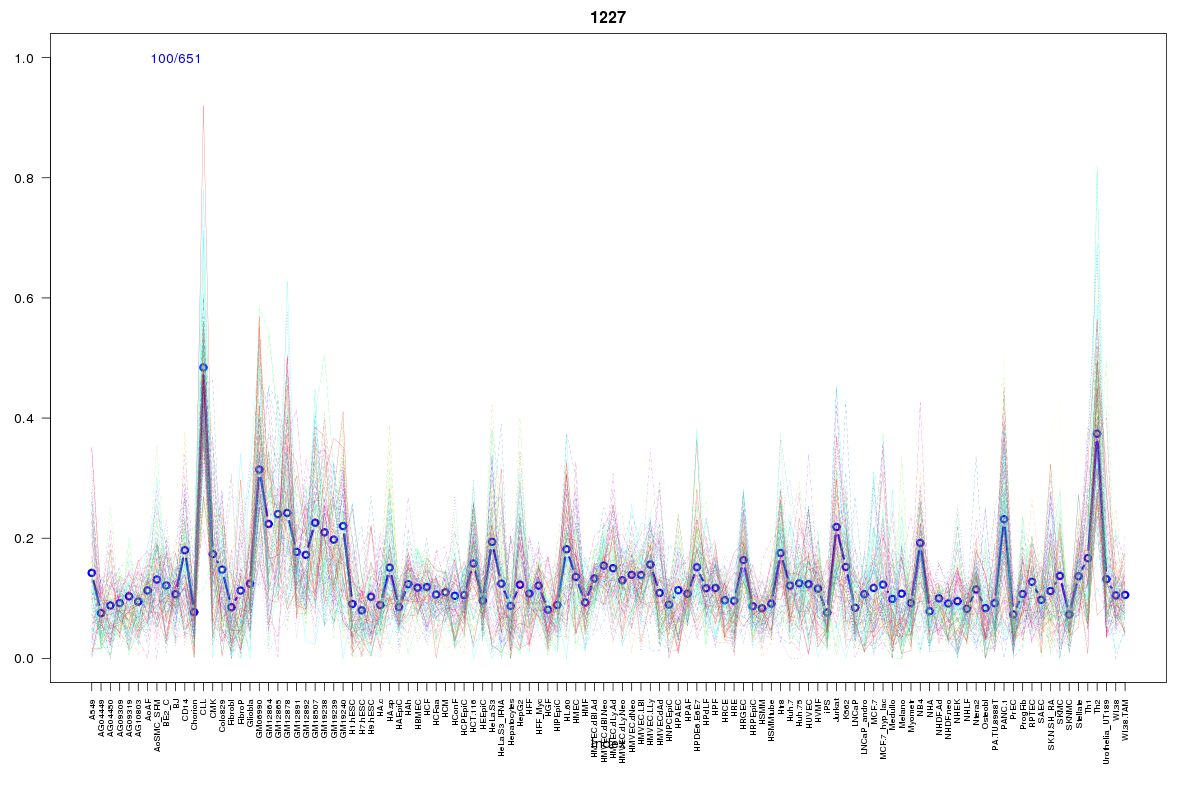 | 1227 | 1 |
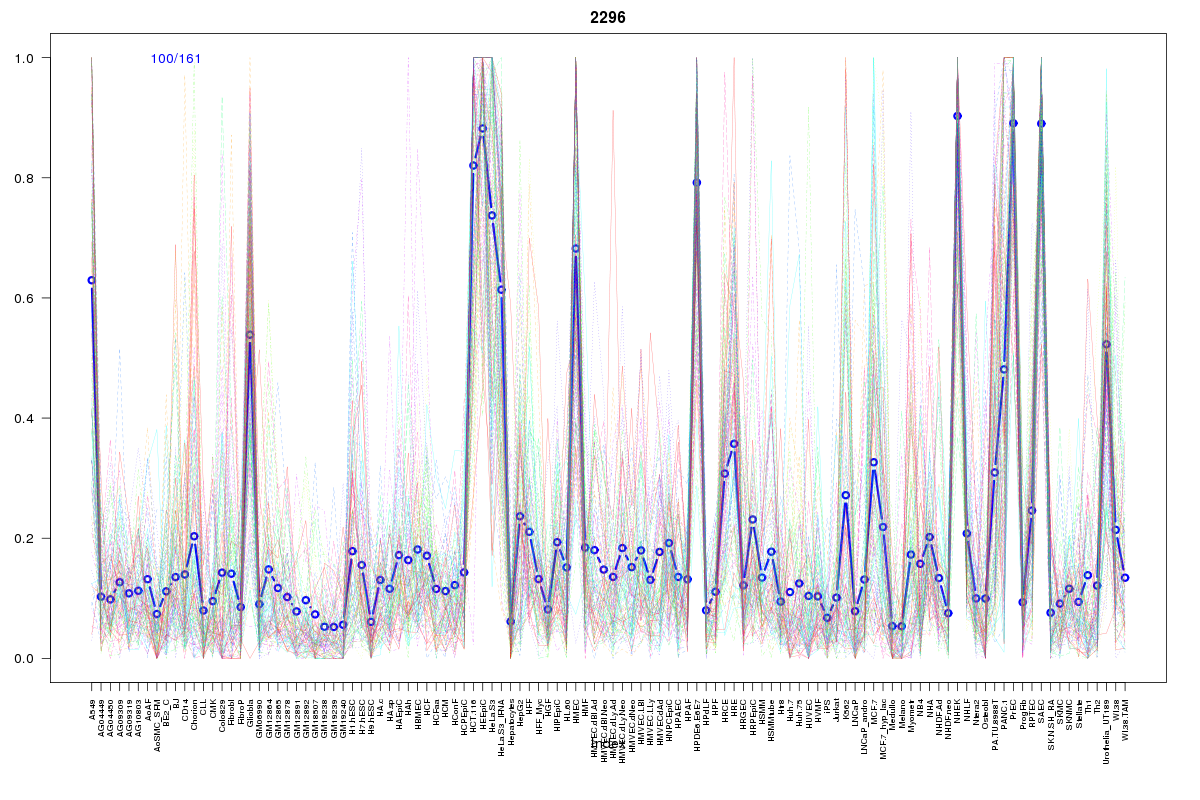 | 2296 | 1 |
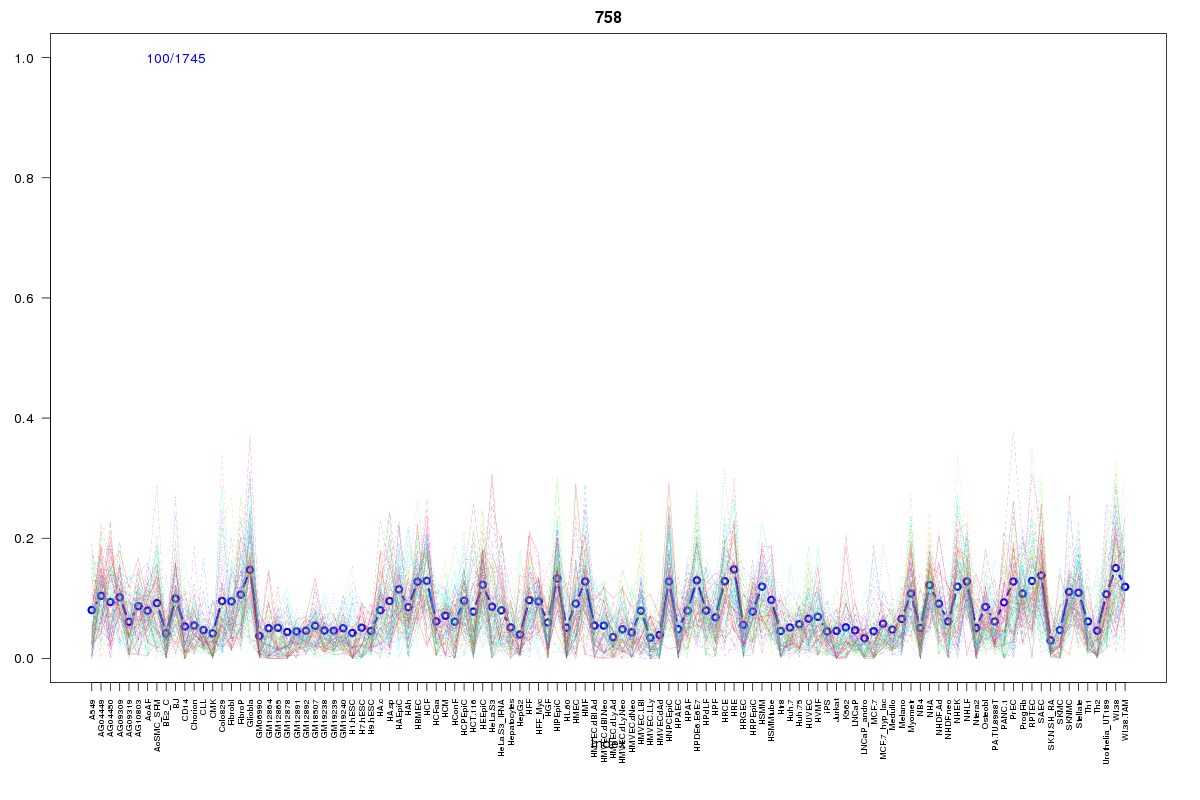 | 758 | 1 |
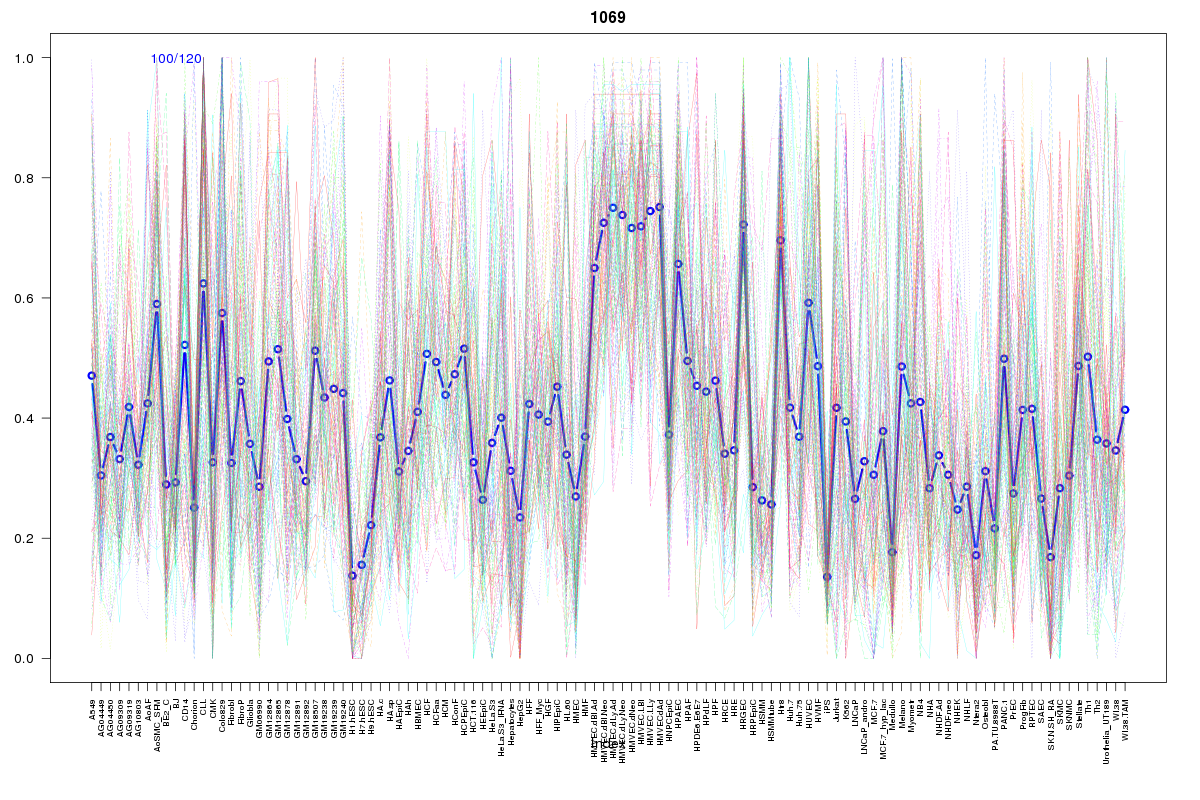 | 1069 | 1 |
 | 2133 | 1 |
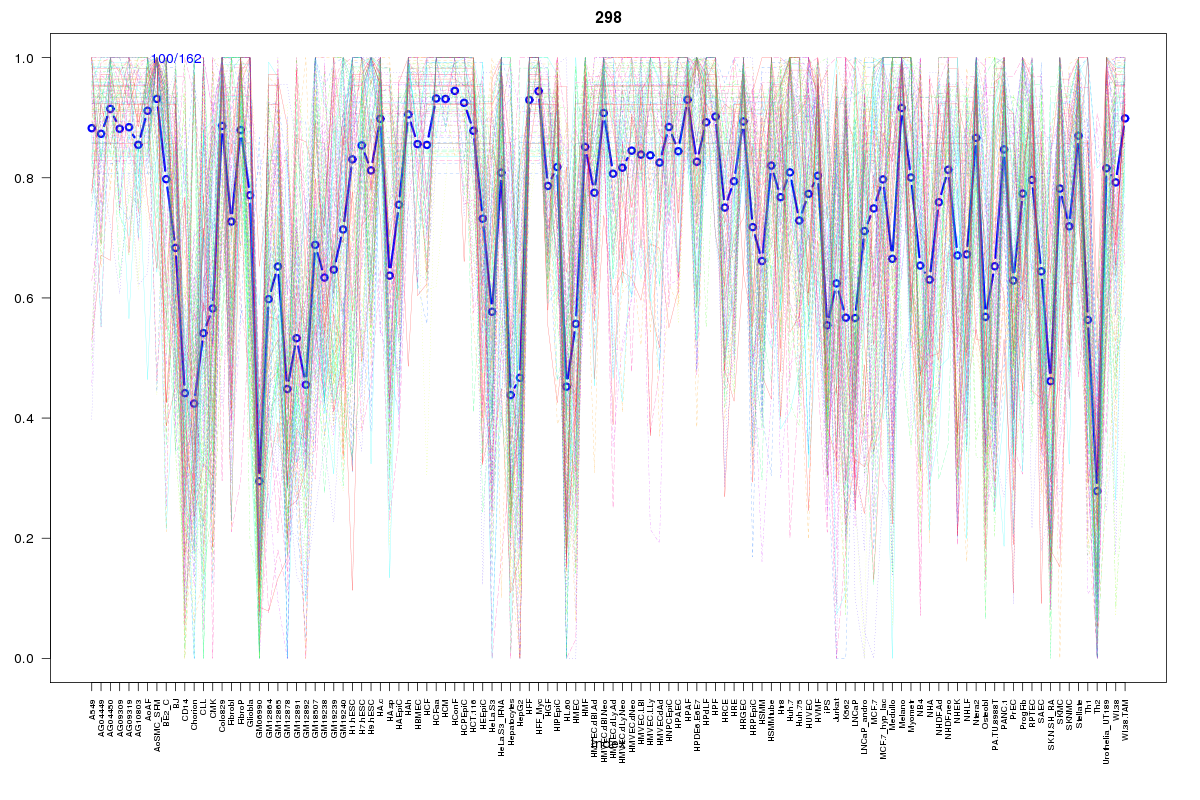 | 298 | 1 |
Resources
BED file downloads
Connects to 36 DHS sitesTop 10 Correlated DHS Sites
p-values indiciate significant higher or lower correlation| Location | Cluster | P-value |
|---|---|---|
| chr12:50641080-50641230 | 549 | 0 |
| chr12:50580580-50580730 | 1661 | 0.002 |
| chr12:50581205-50581355 | 1239 | 0.003 |
| chr12:50616380-50616530 | 298 | 0.003 |
| chr12:50481880-50482030 | 744 | 0.007 |
| chr12:50635820-50635970 | 1200 | 0.007 |
| chr12:50636600-50636750 | 1346 | 0.008 |
| chr12:50612300-50612450 | 2296 | 0.008 |
| chr12:50602920-50603070 | 2197 | 0.008 |
| chr12:50636780-50636930 | 1729 | 0.008 |
| chr12:50595880-50596030 | 648 | 0.008 |
External Databases
UCSCEnsembl (ENSG00000050405)