Gene: MYOC
chr1: 171604556-171621823Expression Profile
(log scale)
Graphical Connections
Distribution of linked clusters:
You may find it interesting if many of the connected DHS sites belong to the same cluster.| Cluster Profile | Cluster ID | Number of DHS sites in this cluster |
|---|---|---|
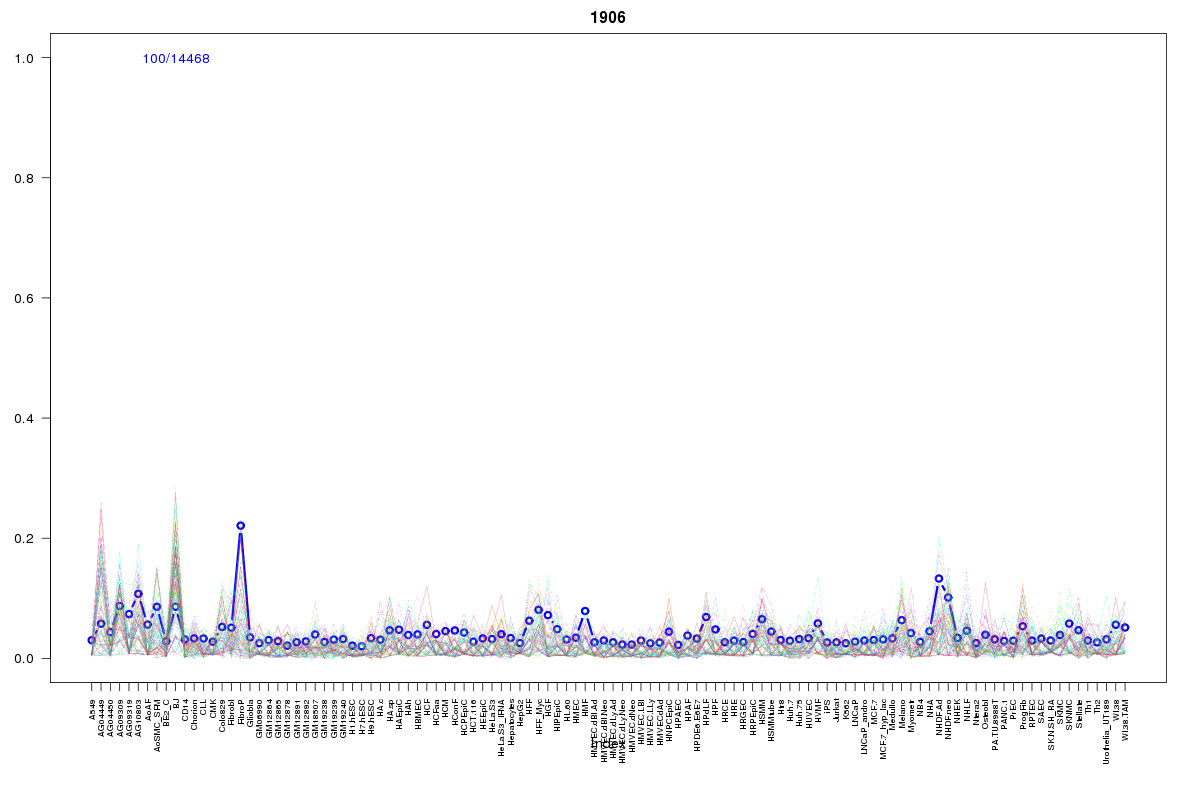 | 1906 | 1 |
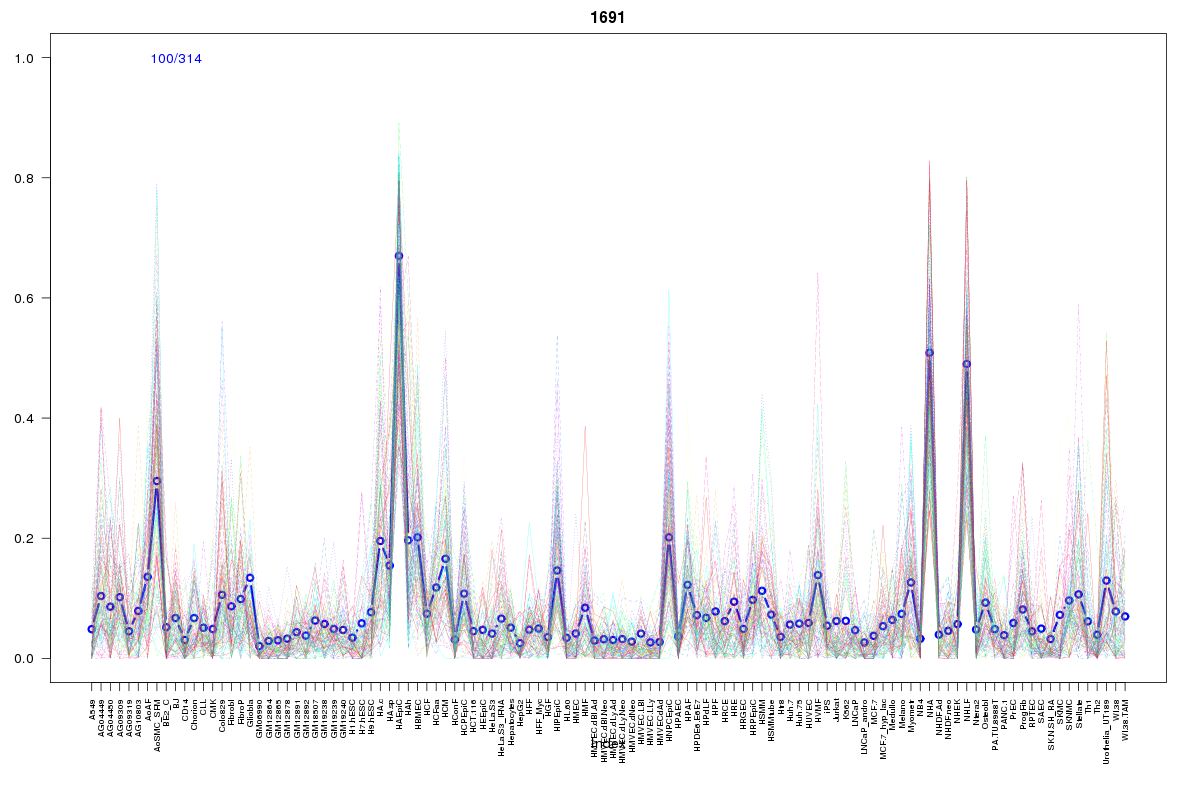 | 1691 | 1 |
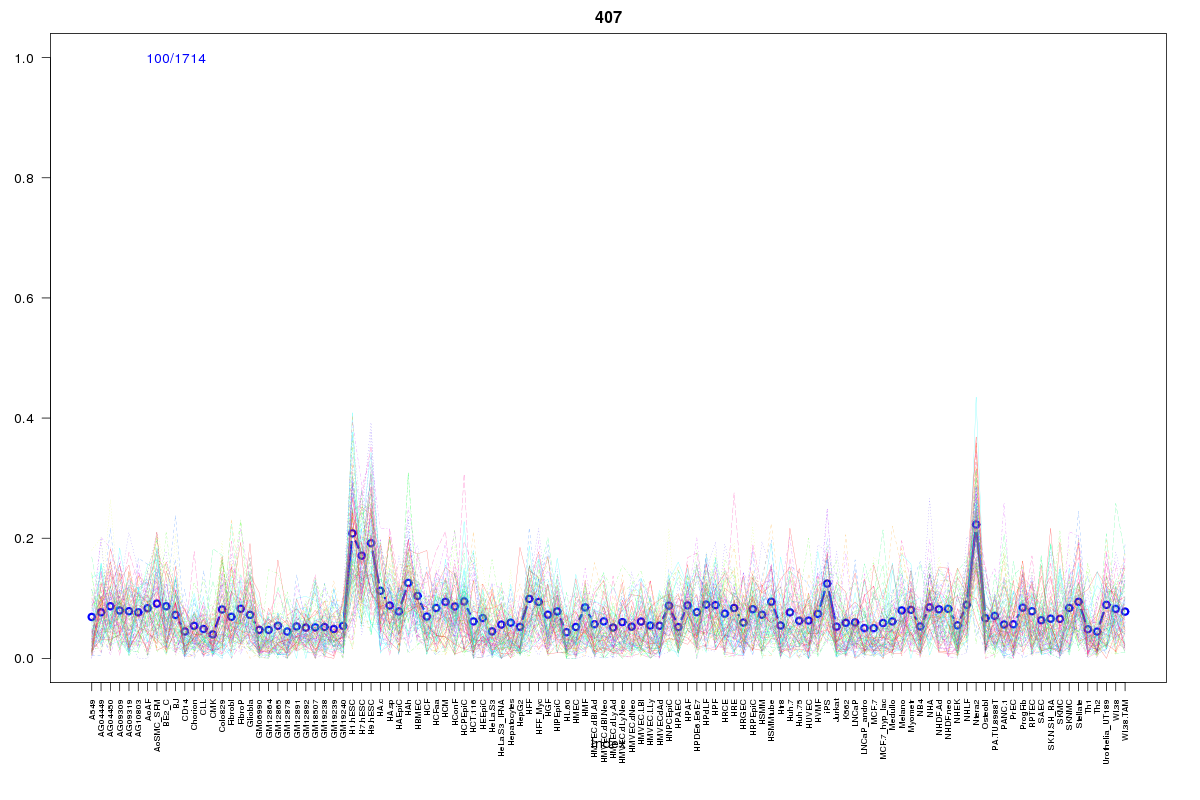 | 407 | 1 |
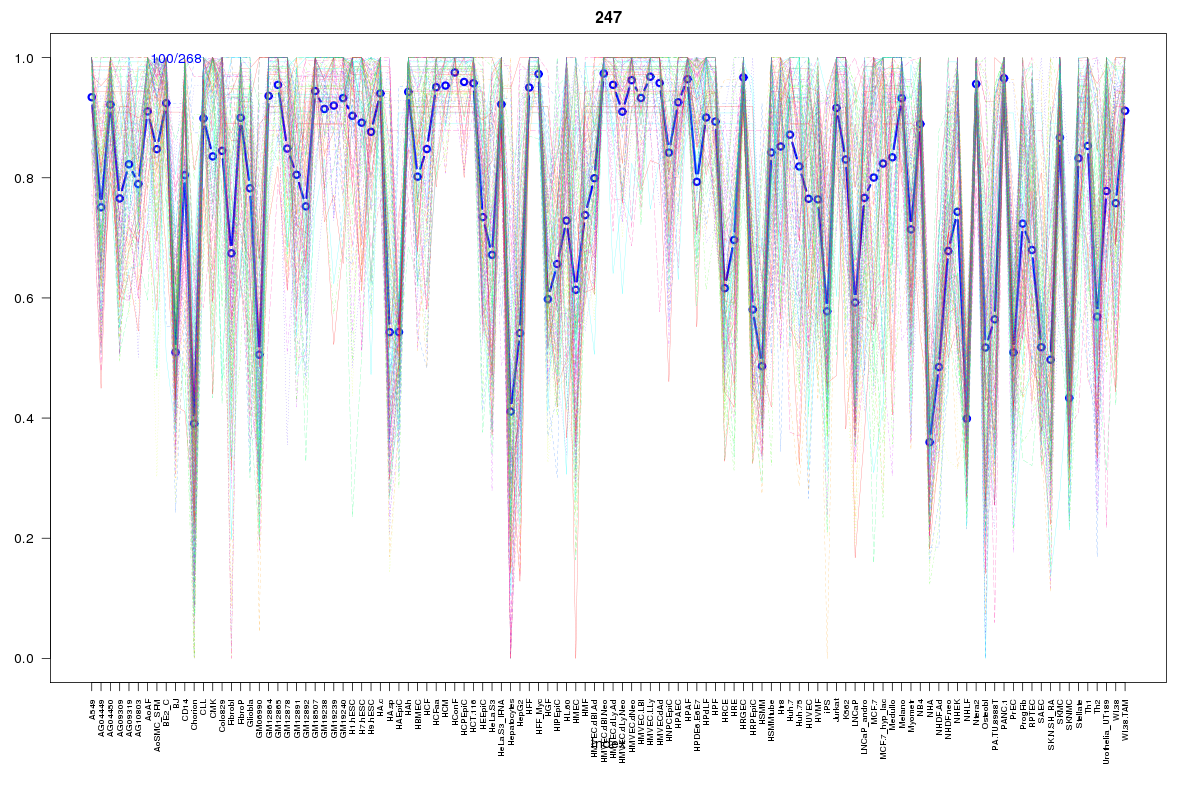 | 247 | 1 |
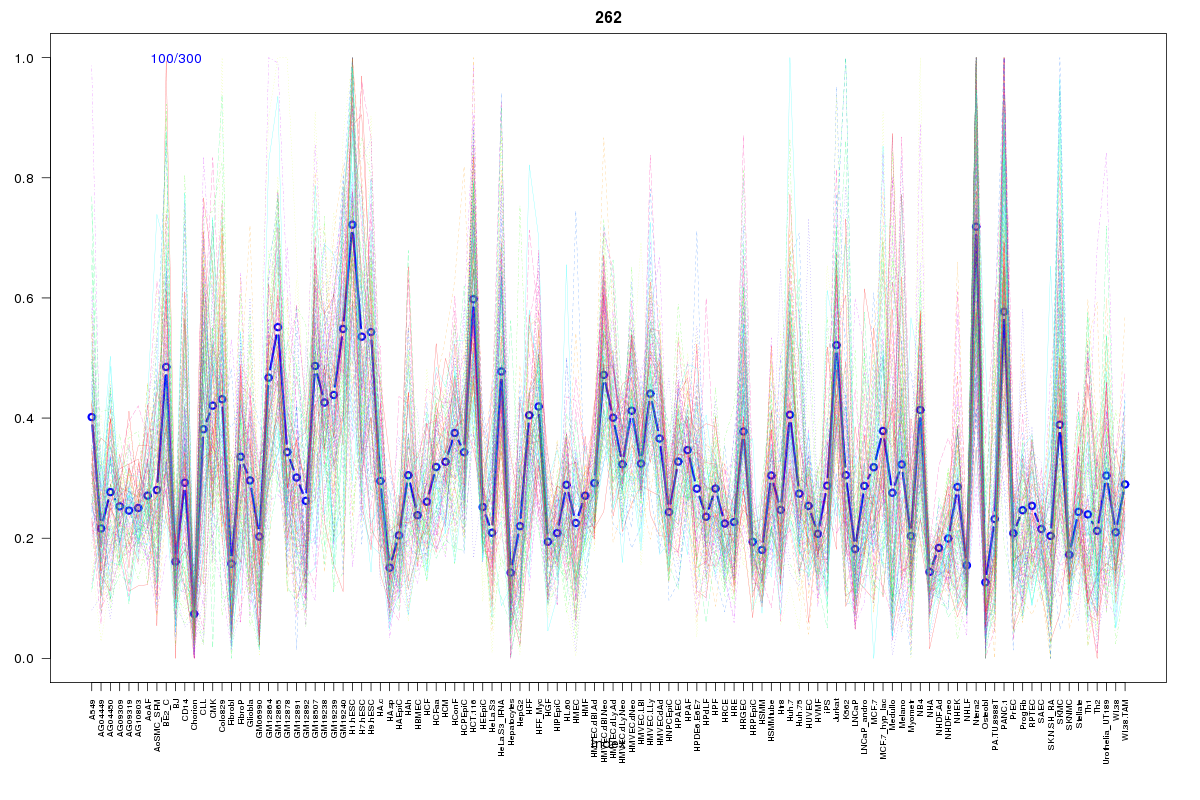 | 262 | 1 |
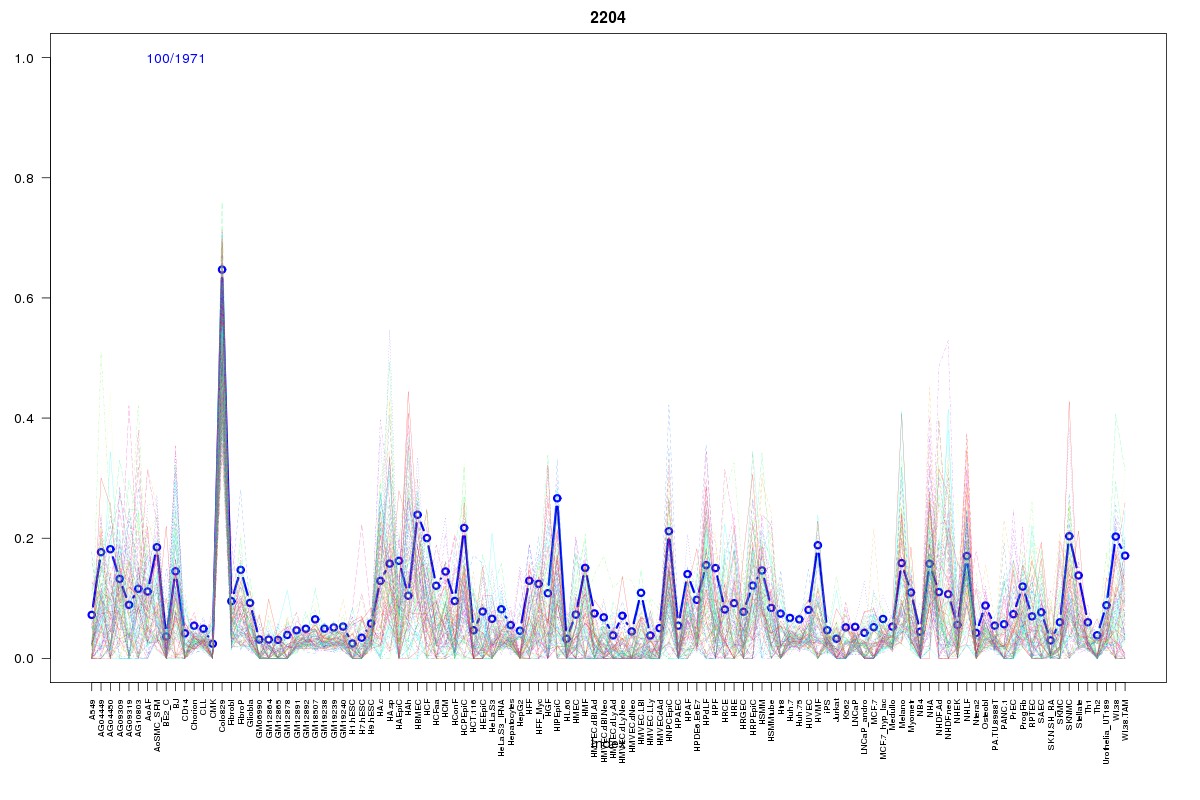 | 2204 | 1 |
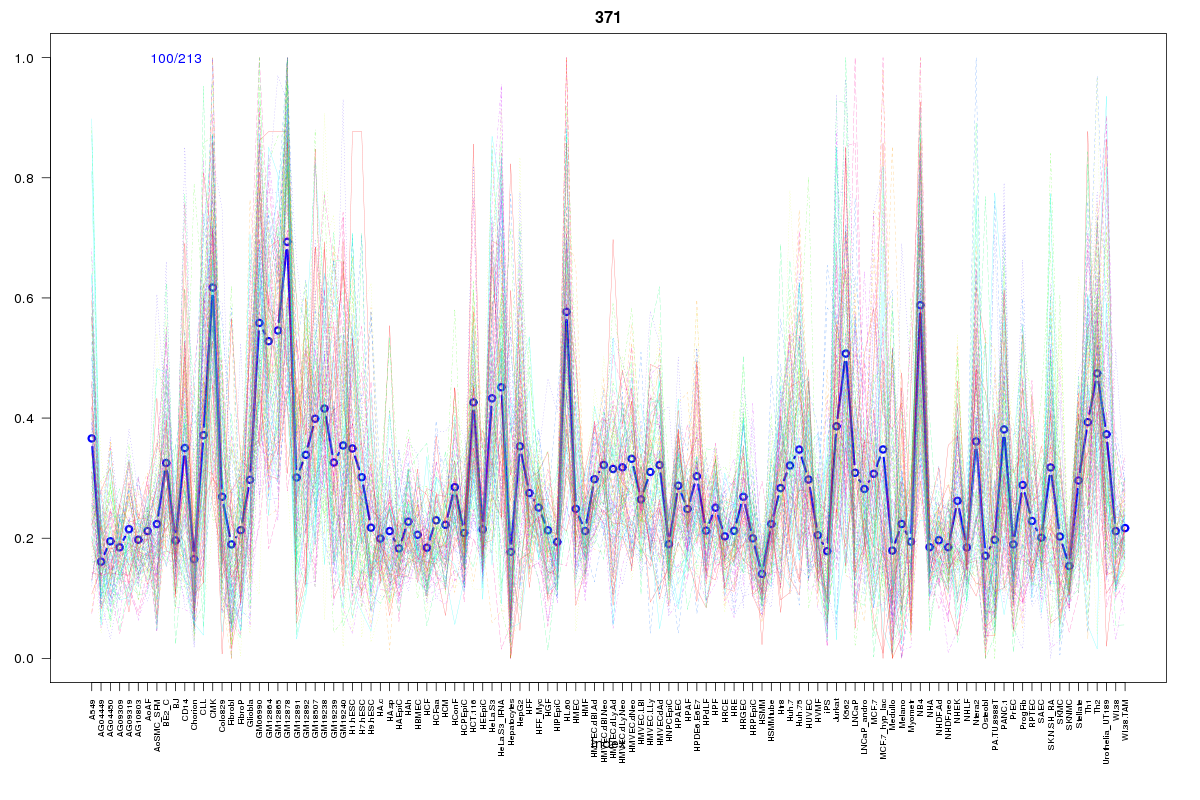 | 371 | 1 |
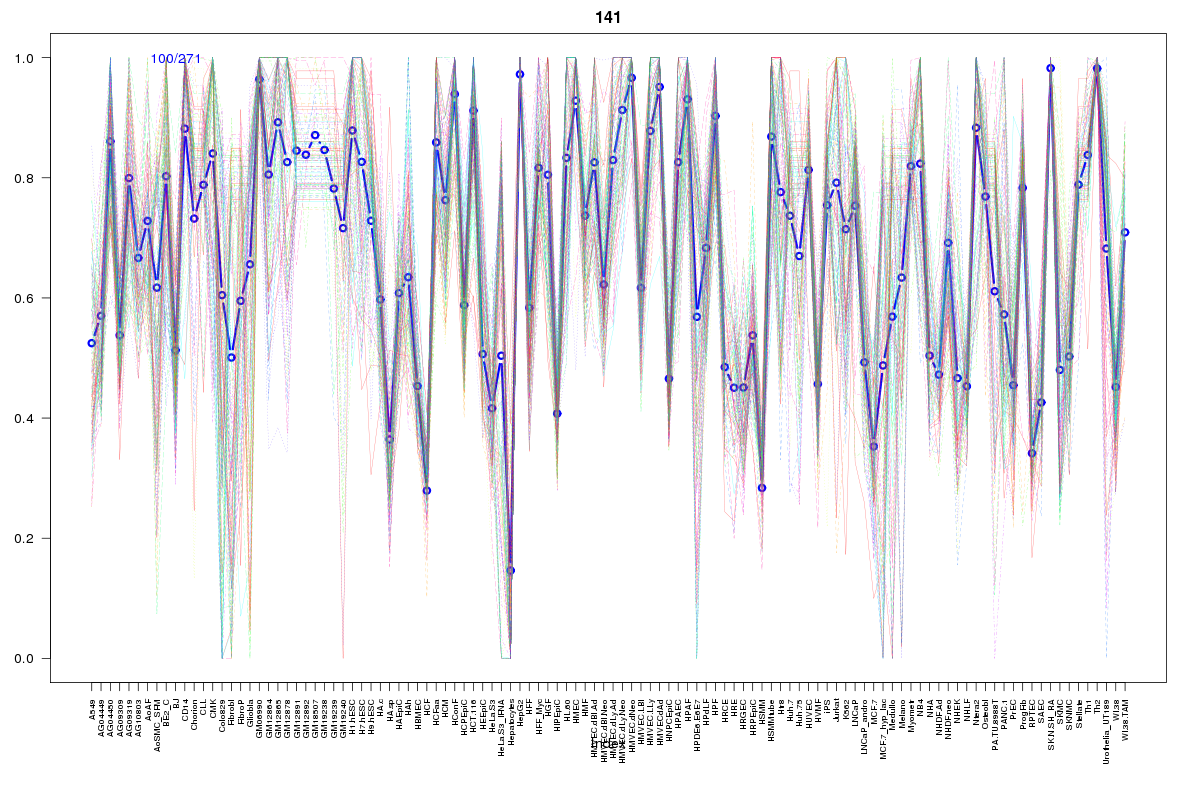 | 141 | 1 |
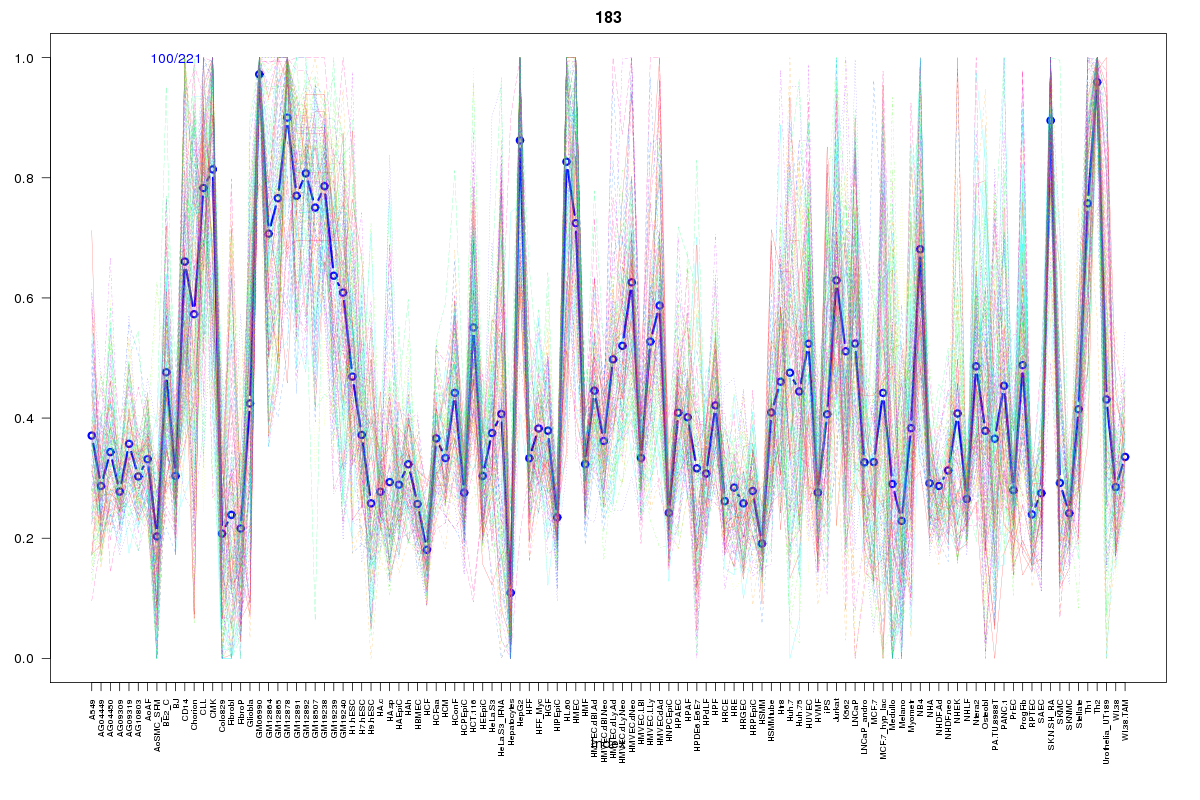 | 183 | 1 |
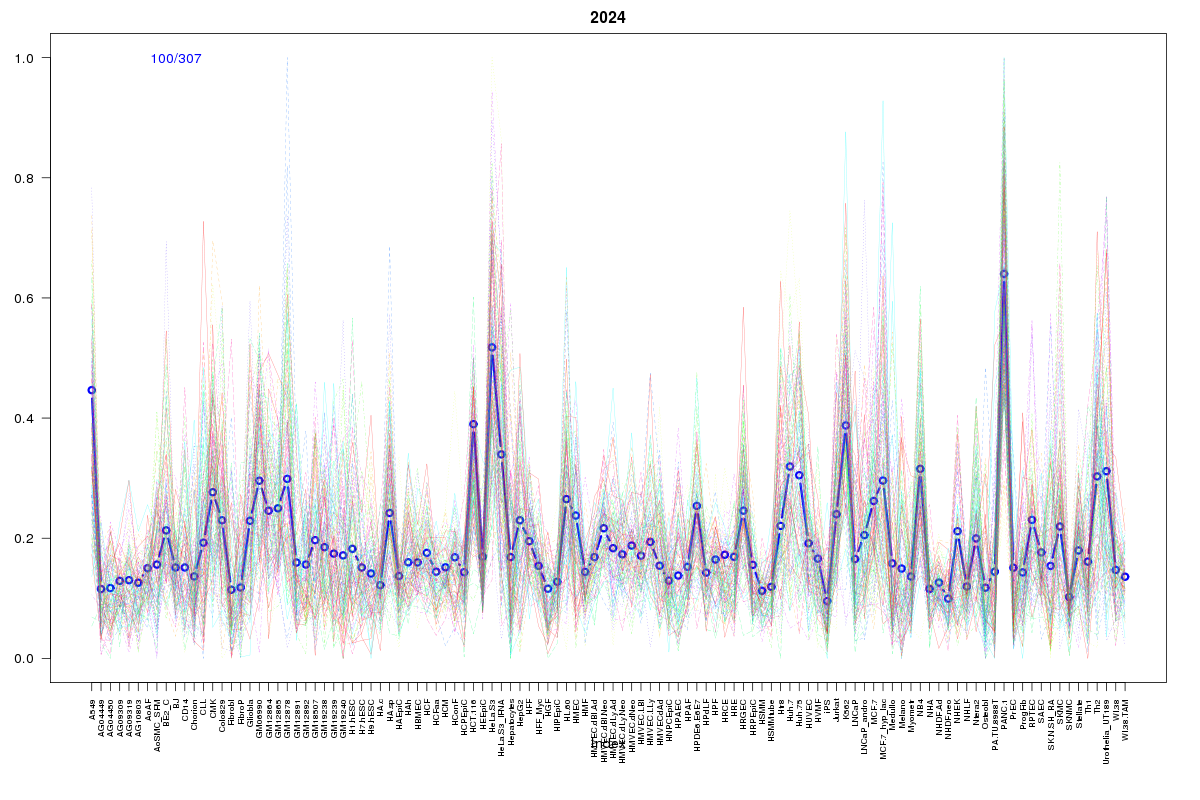 | 2024 | 1 |
Resources
BED file downloads
Connects to 10 DHS sitesTop 10 Correlated DHS Sites
p-values indiciate significant higher or lower correlation| Location | Cluster | P-value |
|---|---|---|
| chr1:171532960-171533110 | 1691 | 0.003 |
| chr1:171709600-171709750 | 2204 | 0.004 |
| chr1:171518040-171518190 | 1906 | 0.016 |
| chr1:171605365-171605515 | 407 | 0.024 |
| chr1:171711600-171711750 | 2024 | 0.015 |
| chr1:171711180-171711330 | 141 | 0.013 |
| chr1:171711380-171711530 | 183 | 0.012 |
| chr1:171710520-171710670 | 371 | 0.005 |
| chr1:171624680-171624830 | 262 | 0.004 |
| chr1:171614180-171614330 | 247 | 0 |
External Databases
UCSCEnsembl (ENSG00000034971)