Gene: PLEKHO1
chr1: 150121372-150131825Expression Profile
(log scale)
Graphical Connections
Distribution of linked clusters:
You may find it interesting if many of the connected DHS sites belong to the same cluster.| Cluster Profile | Cluster ID | Number of DHS sites in this cluster |
|---|---|---|
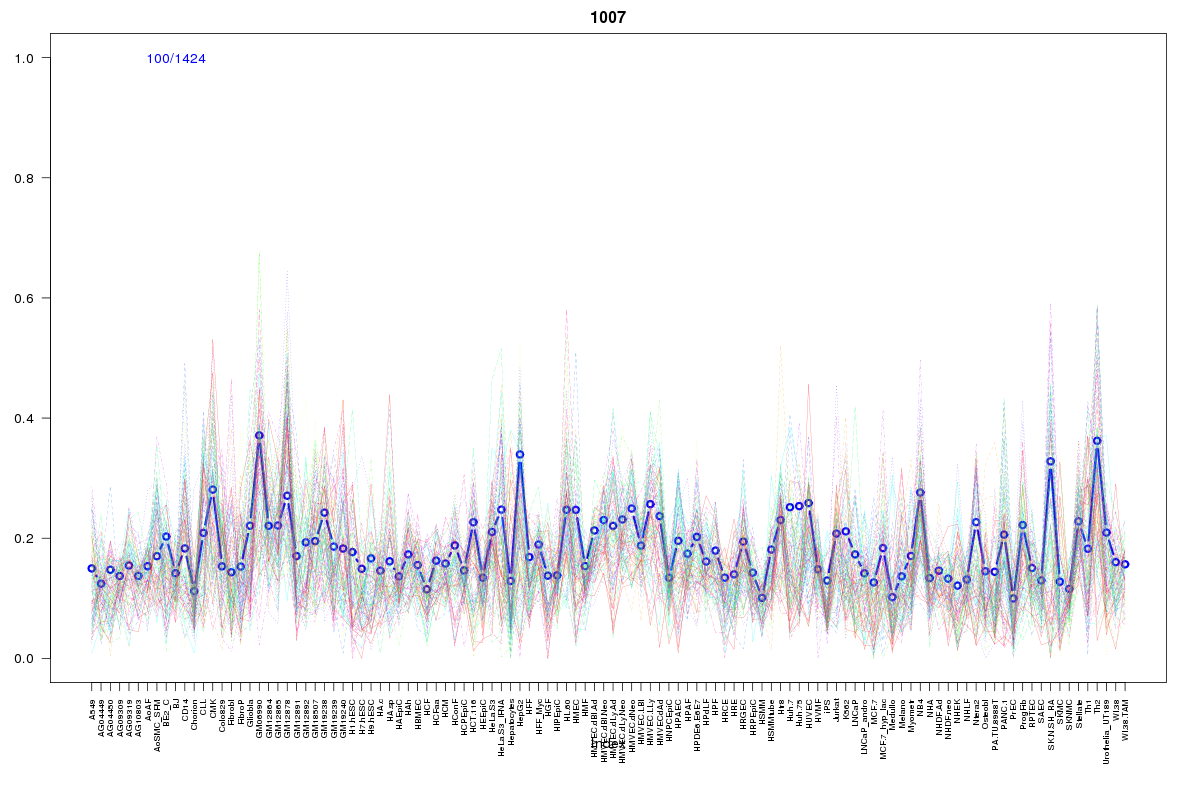 | 1007 | 2 |
 | 2017 | 2 |
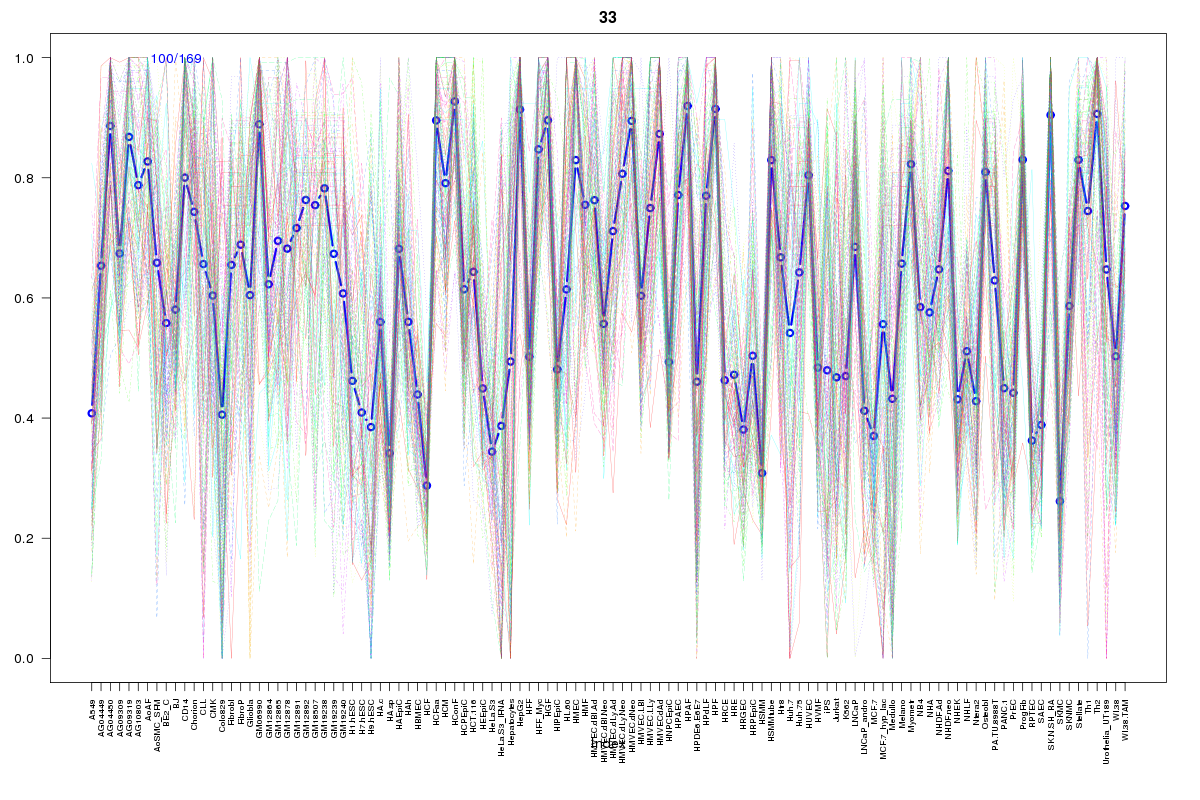 | 33 | 1 |
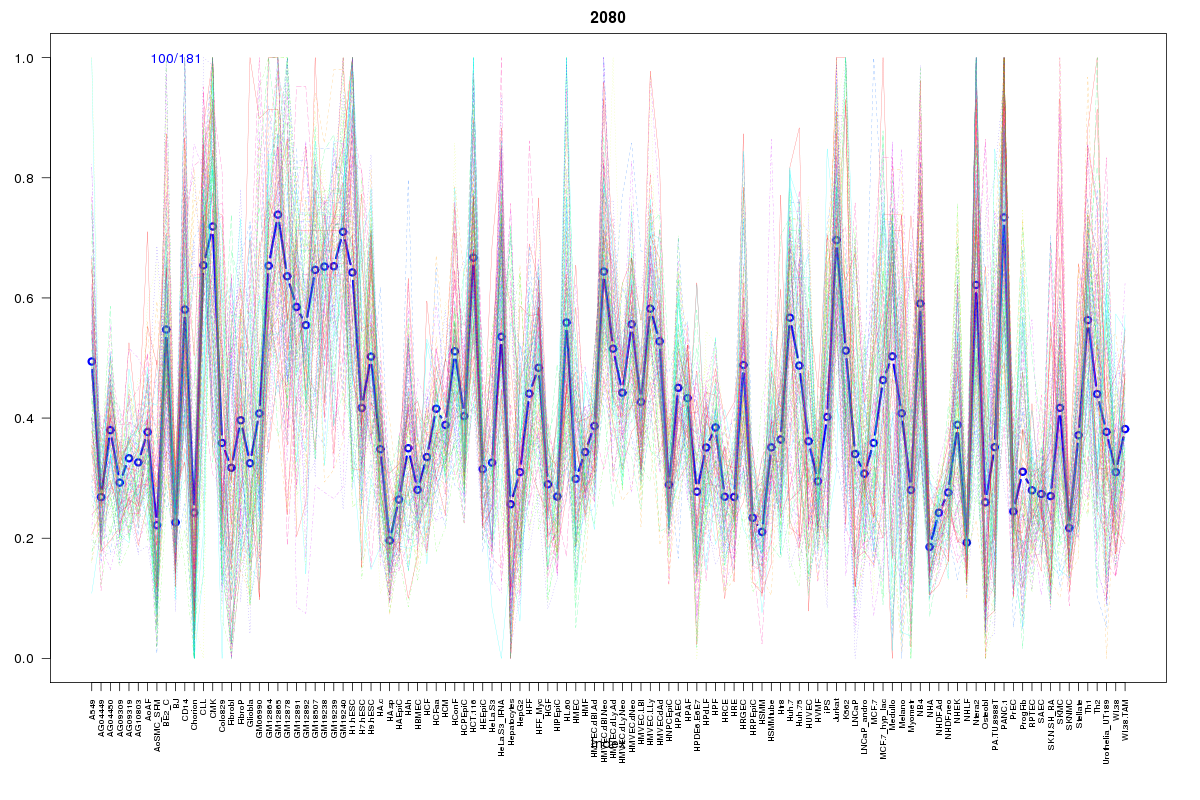 | 2080 | 1 |
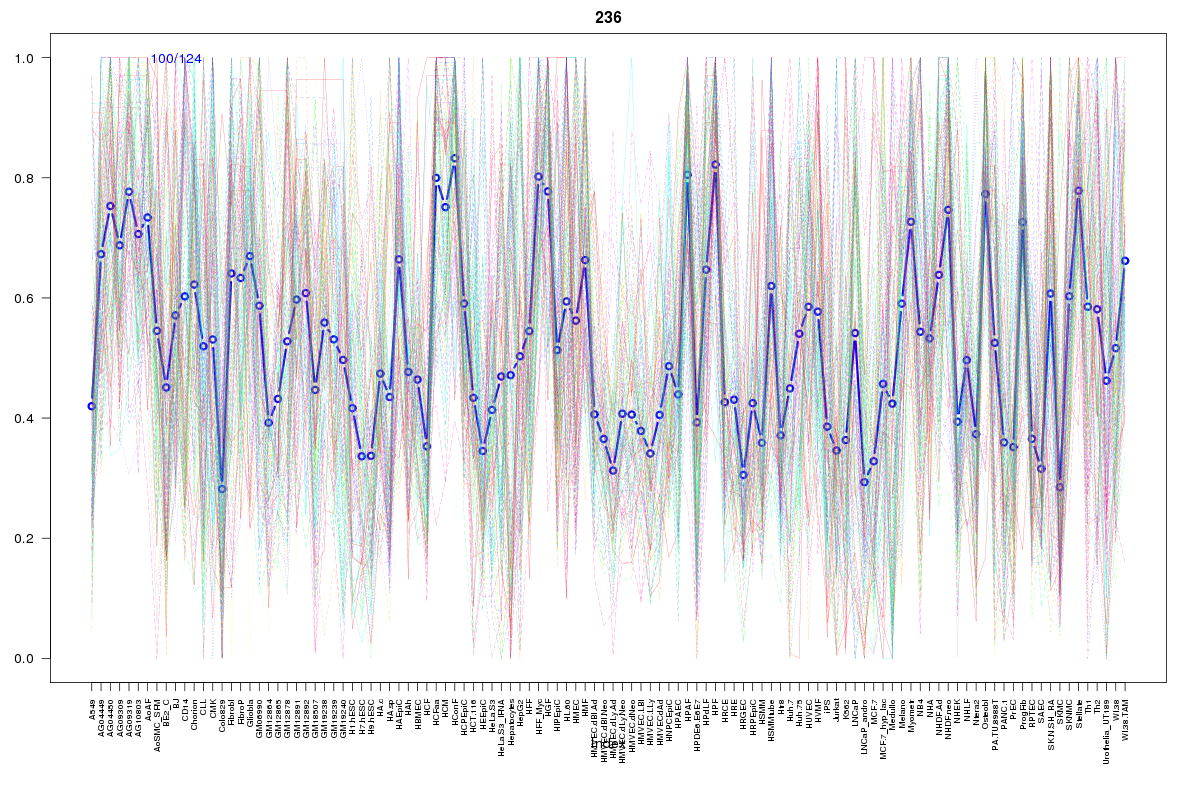 | 236 | 1 |
 | 1605 | 1 |
 | 251 | 1 |
 | 282 | 1 |
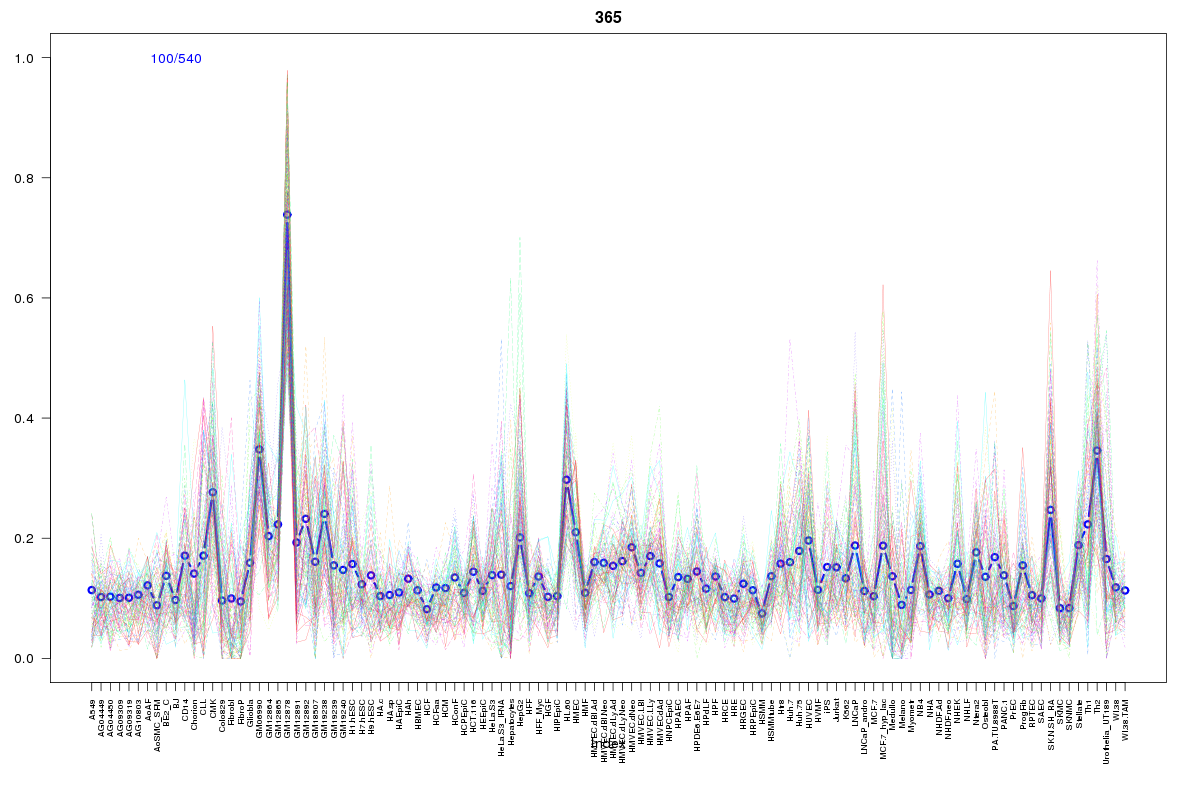 | 365 | 1 |
 | 469 | 1 |
 | 133 | 1 |
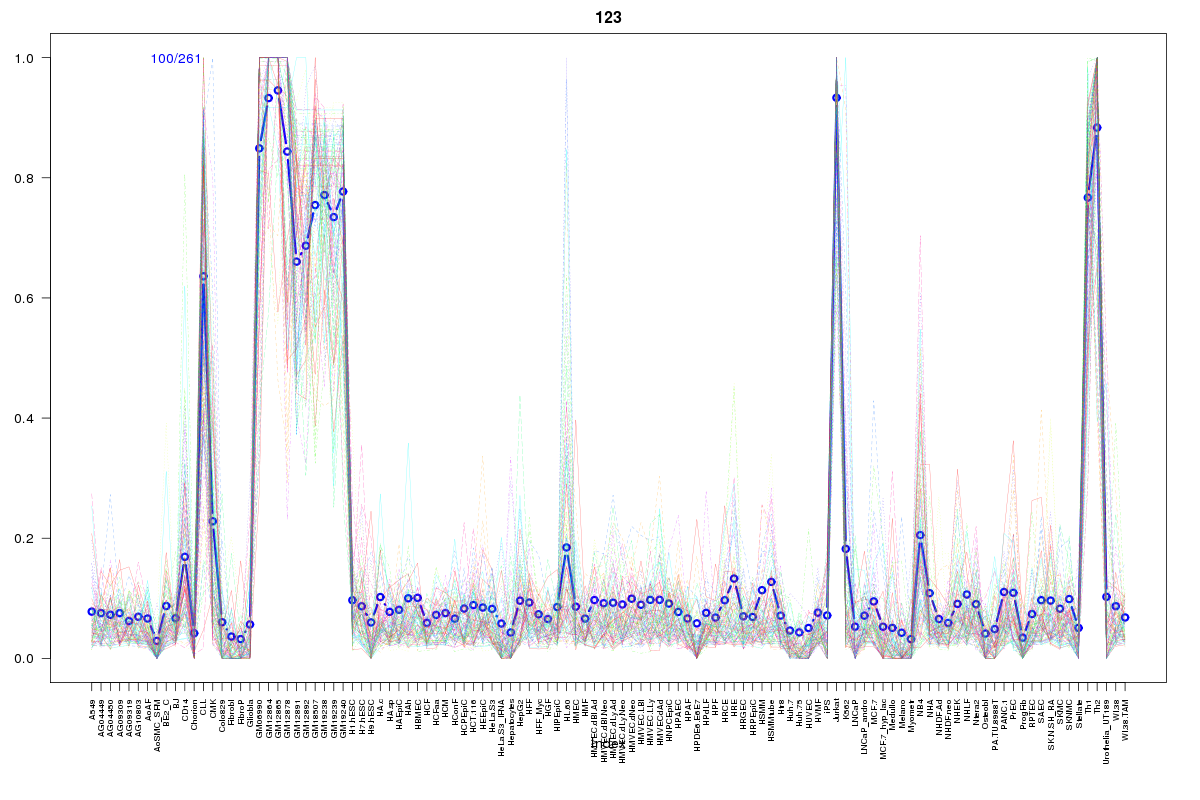 | 123 | 1 |
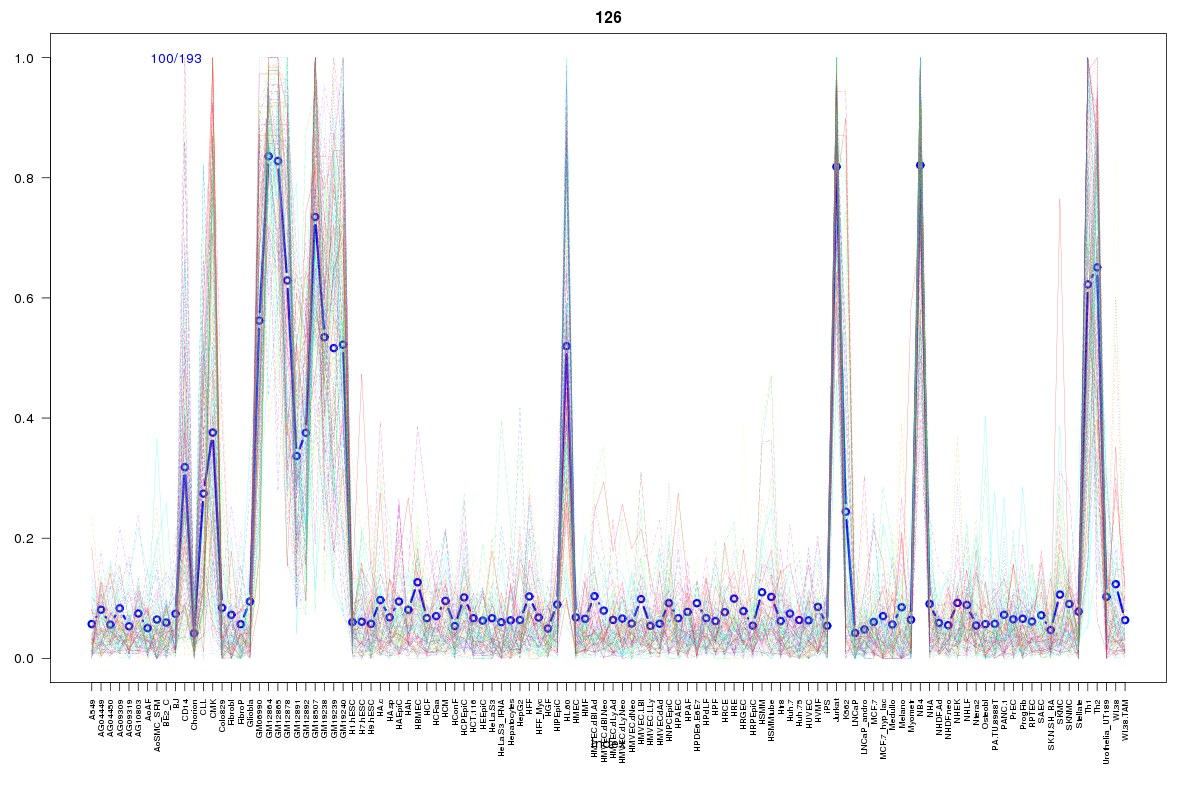 | 126 | 1 |
 | 2059 | 1 |
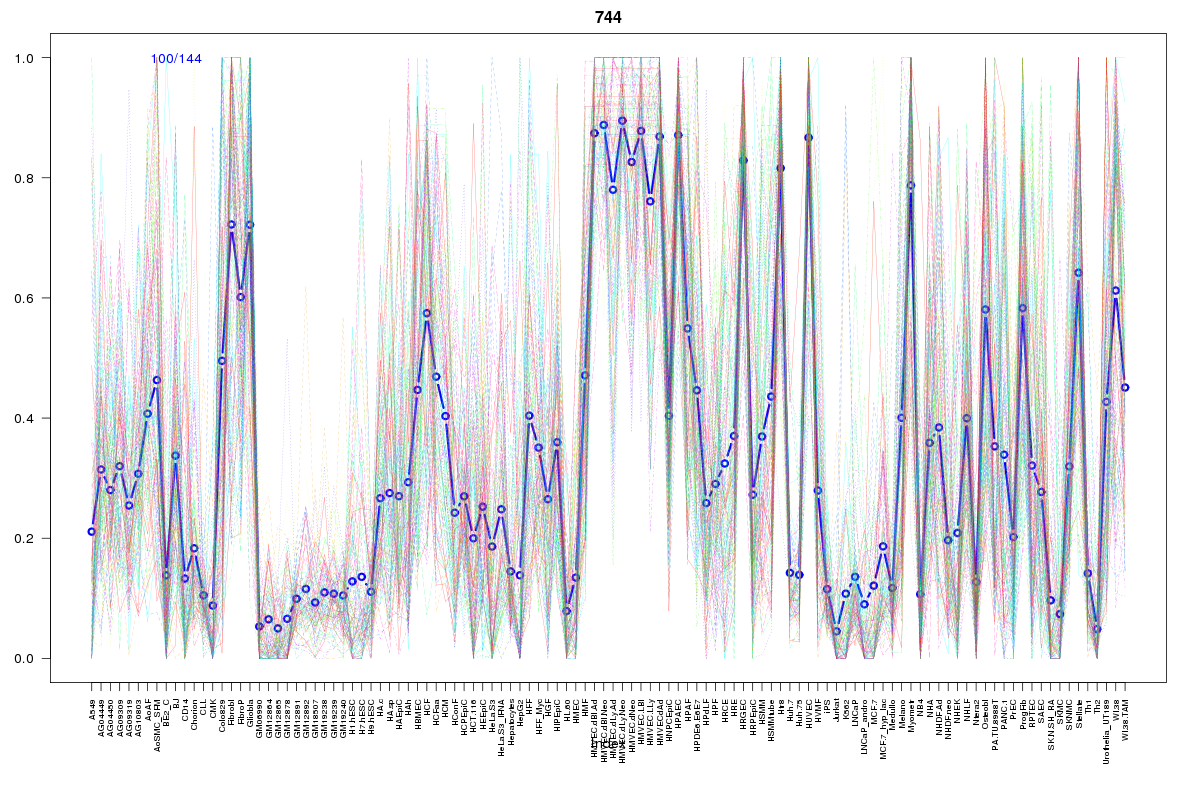 | 744 | 1 |
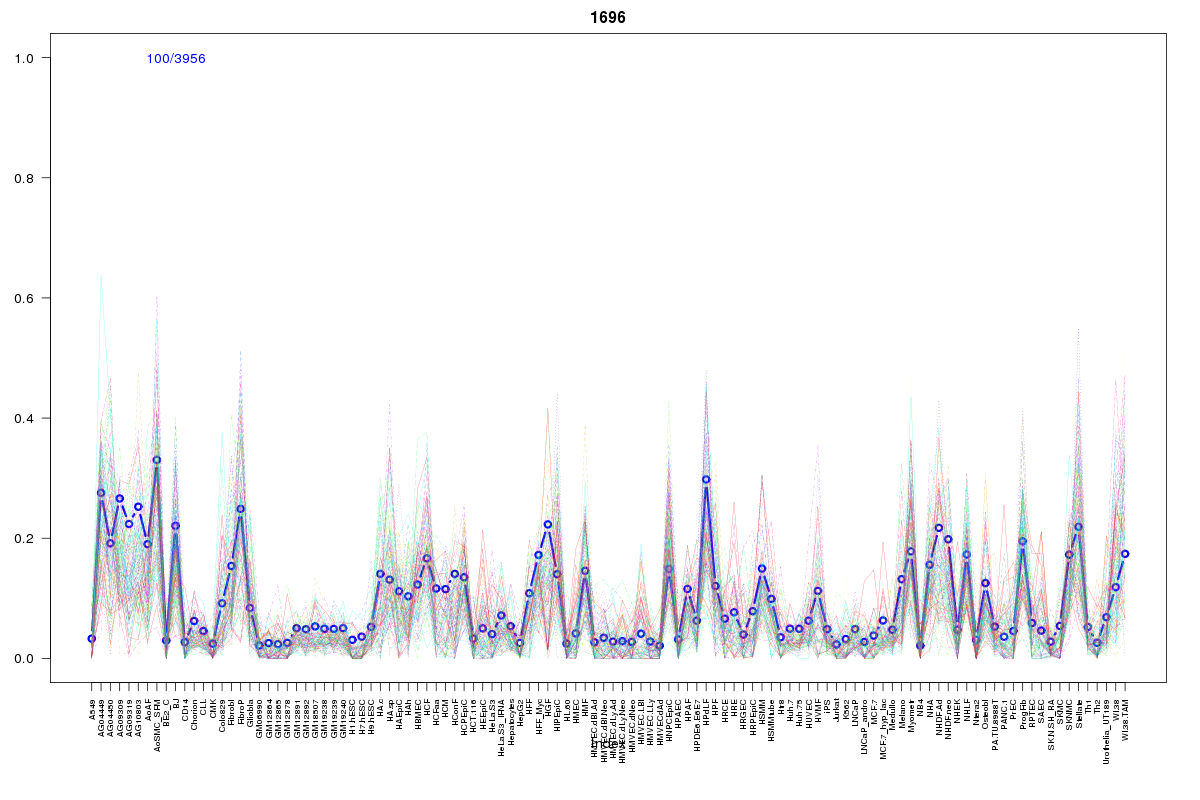 | 1696 | 1 |
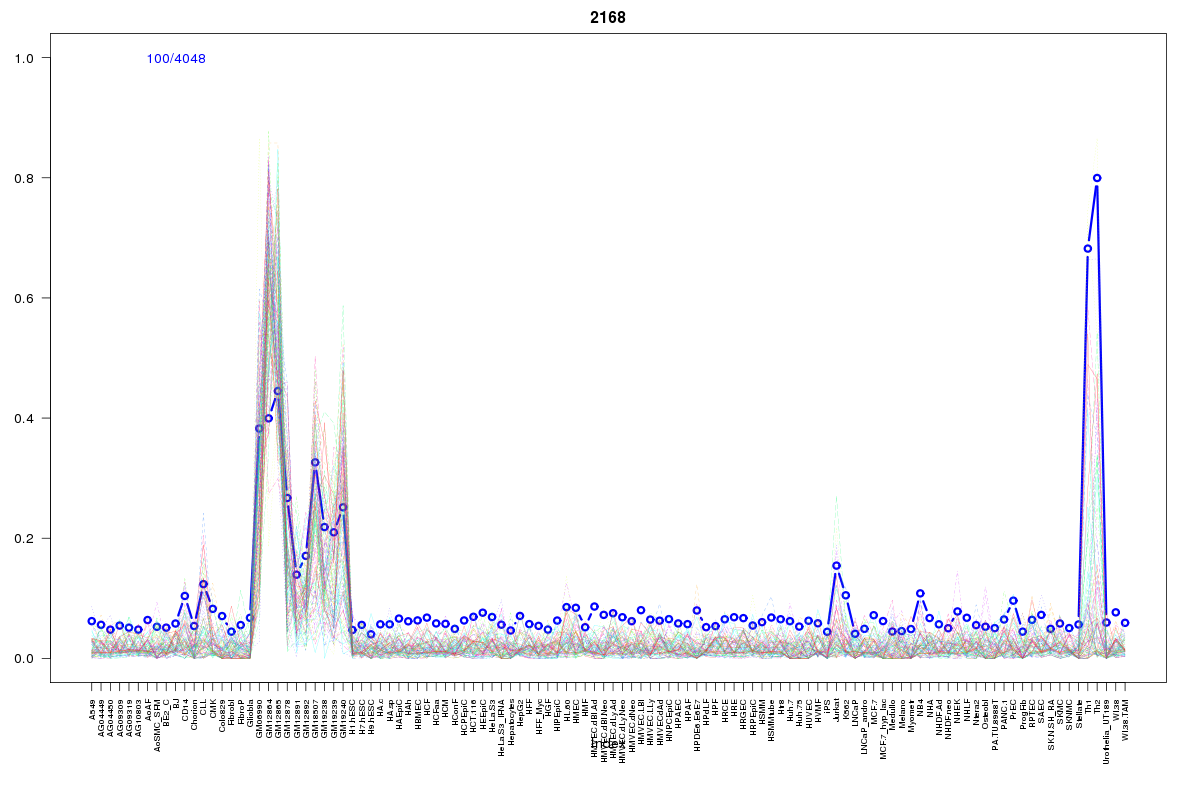 | 2168 | 1 |
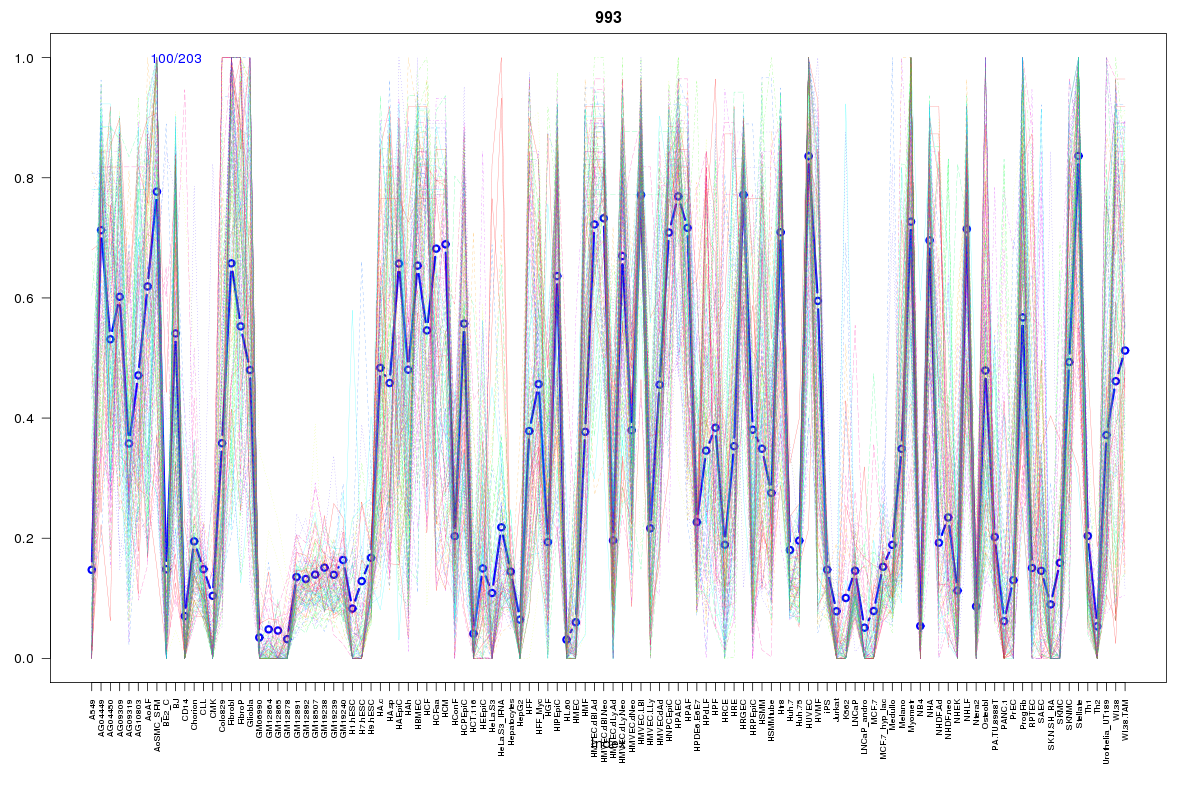 | 993 | 1 |
 | 527 | 1 |
 | 324 | 1 |
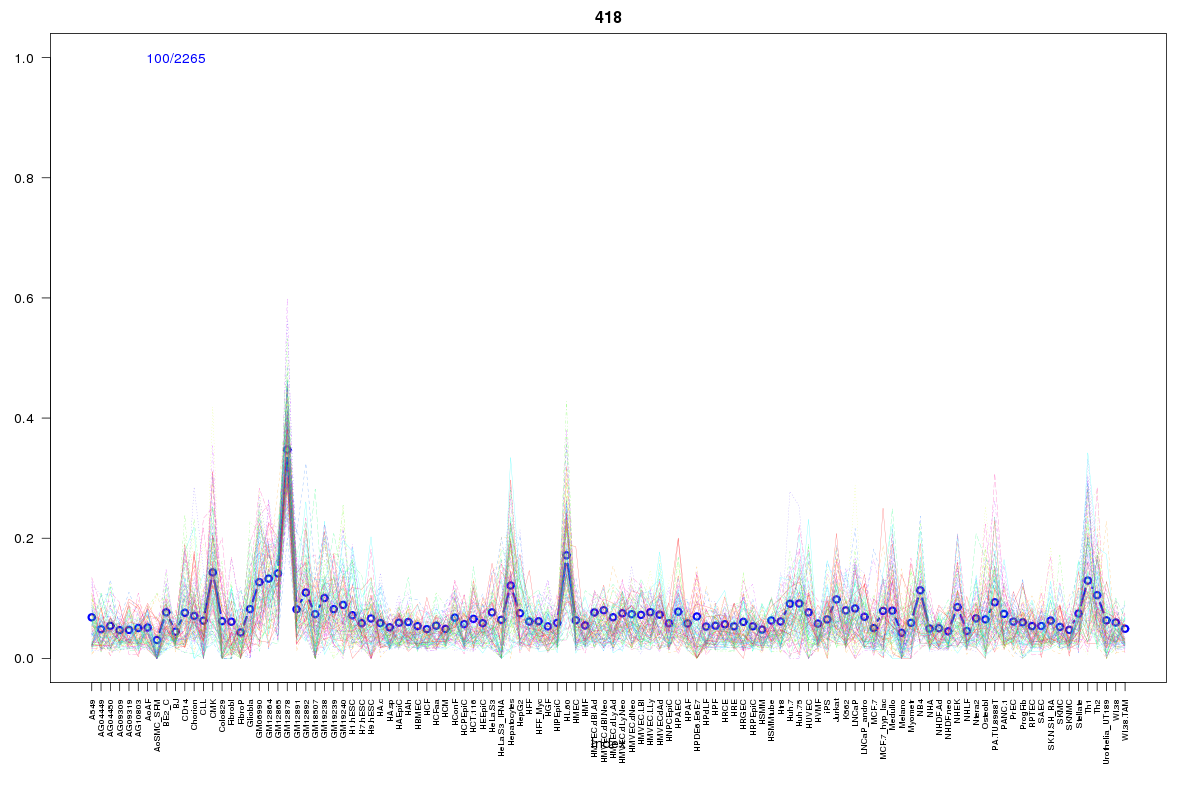 | 418 | 1 |
 | 934 | 1 |
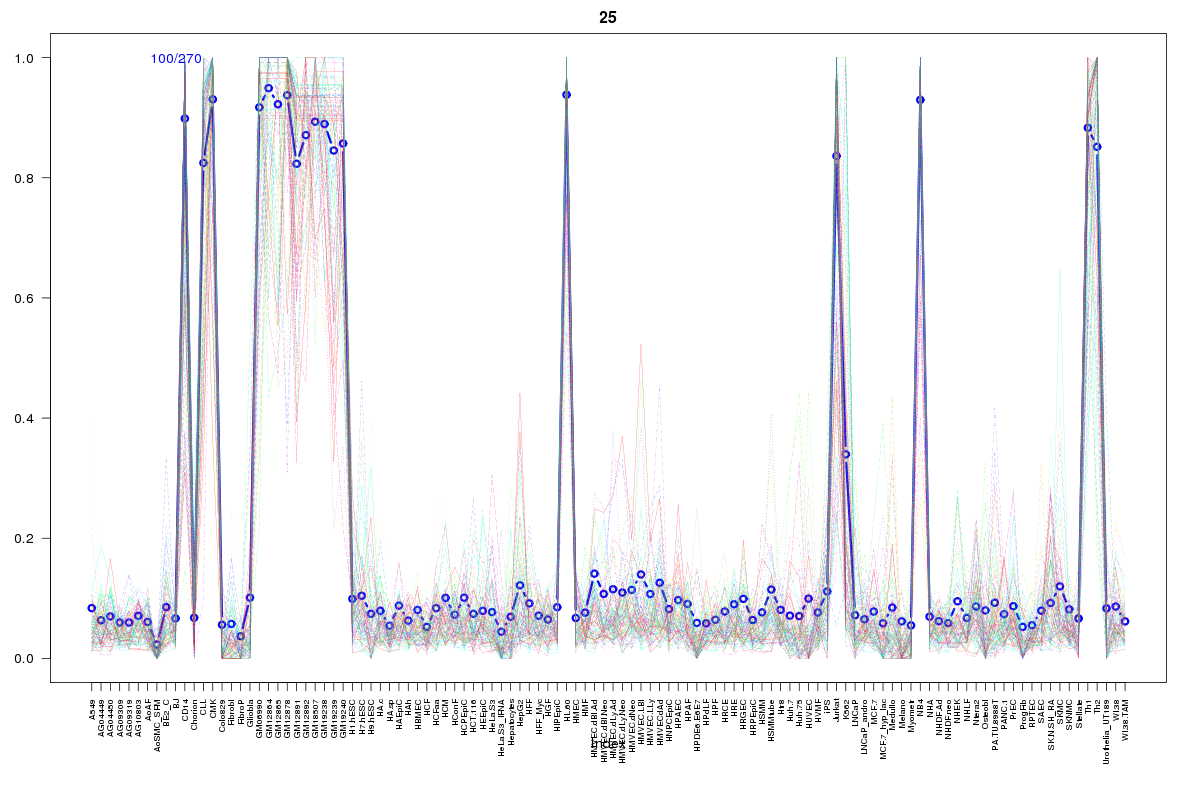 | 25 | 1 |
 | 1834 | 1 |
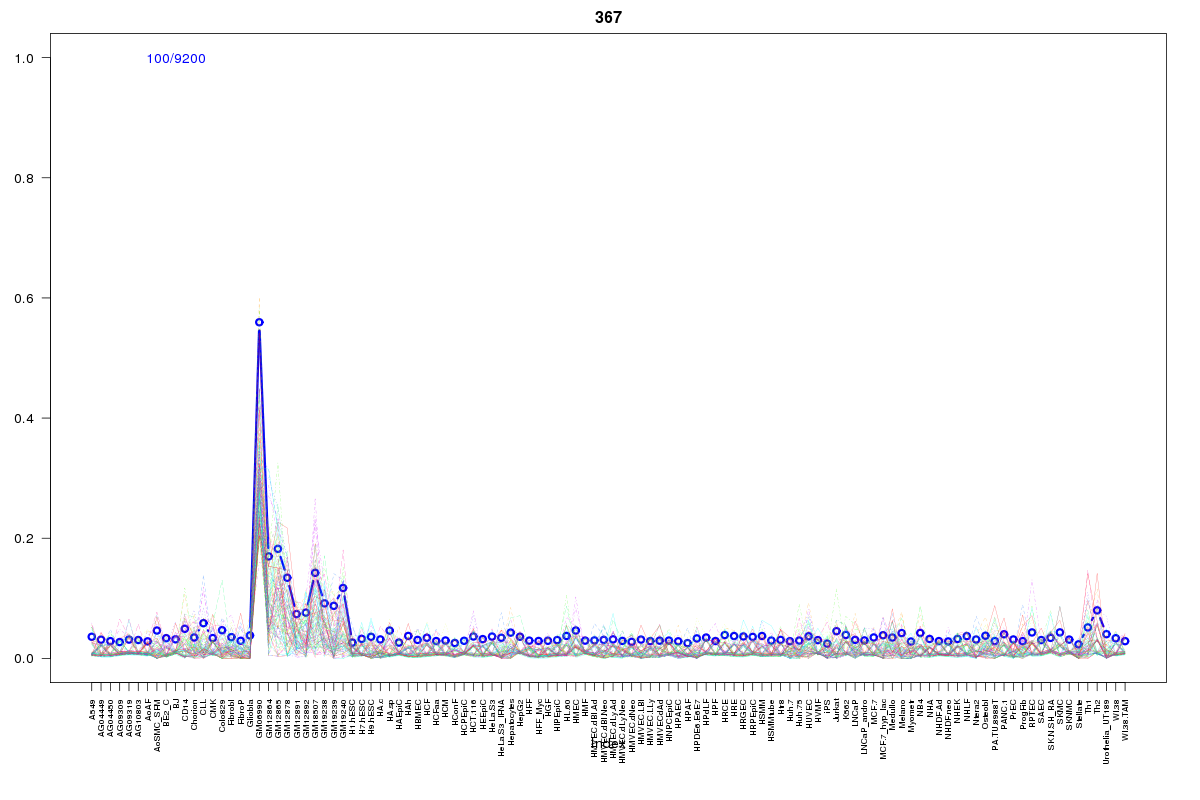 | 367 | 1 |
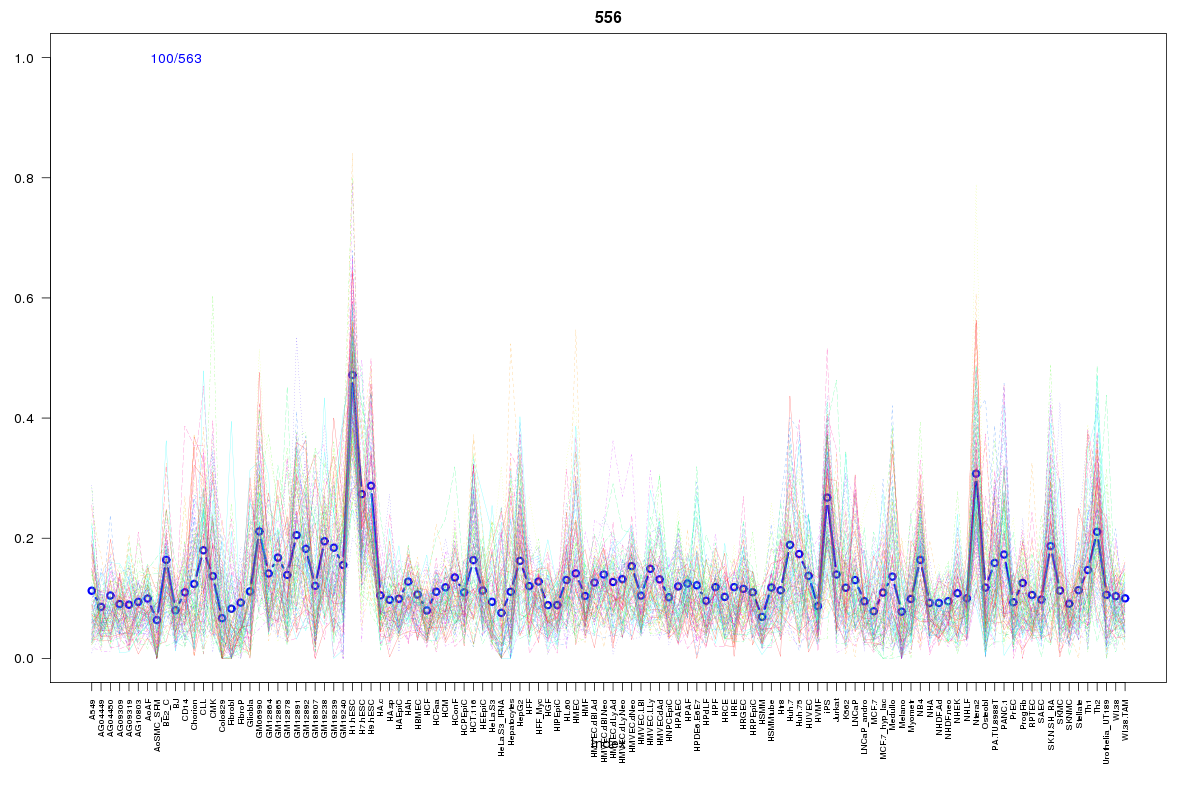 | 556 | 1 |
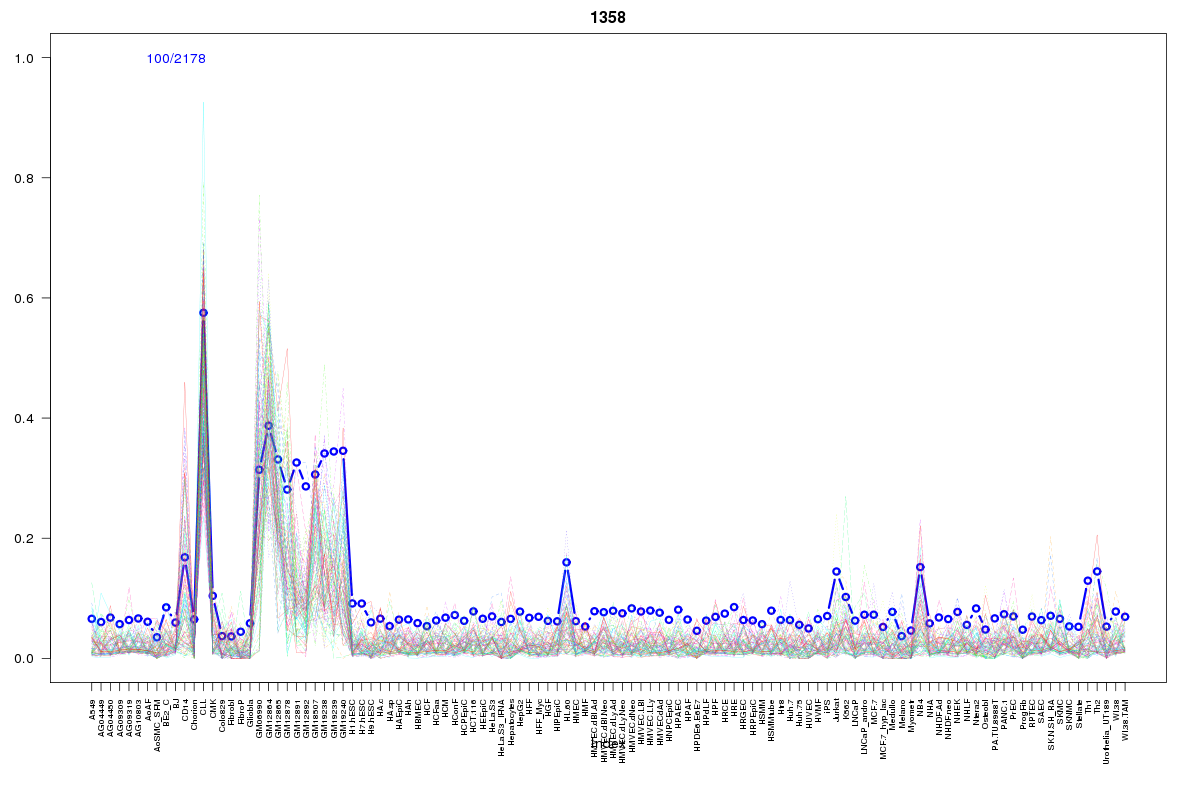 | 1358 | 1 |
Resources
BED file downloads
Connects to 29 DHS sitesTop 10 Correlated DHS Sites
p-values indiciate significant higher or lower correlation| Location | Cluster | P-value |
|---|---|---|
| chr1:150123740-150123890 | 126 | 0 |
| chr1:150123545-150123695 | 123 | 0 |
| chr1:150132740-150132890 | 25 | 0.001 |
| chr1:150121960-150122110 | 33 | 0.001 |
| chr1:150131860-150132010 | 324 | 0.004 |
| chr1:150137640-150137790 | 1358 | 0.011 |
| chr1:150137280-150137430 | 367 | 0.011 |
| chr1:150048240-150048390 | 2168 | 0.011 |
| chr1:150207180-150207330 | 282 | 0.011 |
| chr1:150121205-150121355 | 556 | 0.011 |
| chr1:150081900-150082050 | 934 | 0.011 |
External Databases
UCSCEnsembl (ENSG00000023902)