Gene: ATP2C1
chr3: 130569438-130735528Expression Profile
(log scale)
Graphical Connections
Distribution of linked clusters:
You may find it interesting if many of the connected DHS sites belong to the same cluster.| Cluster Profile | Cluster ID | Number of DHS sites in this cluster |
|---|---|---|
 | 626 | 6 |
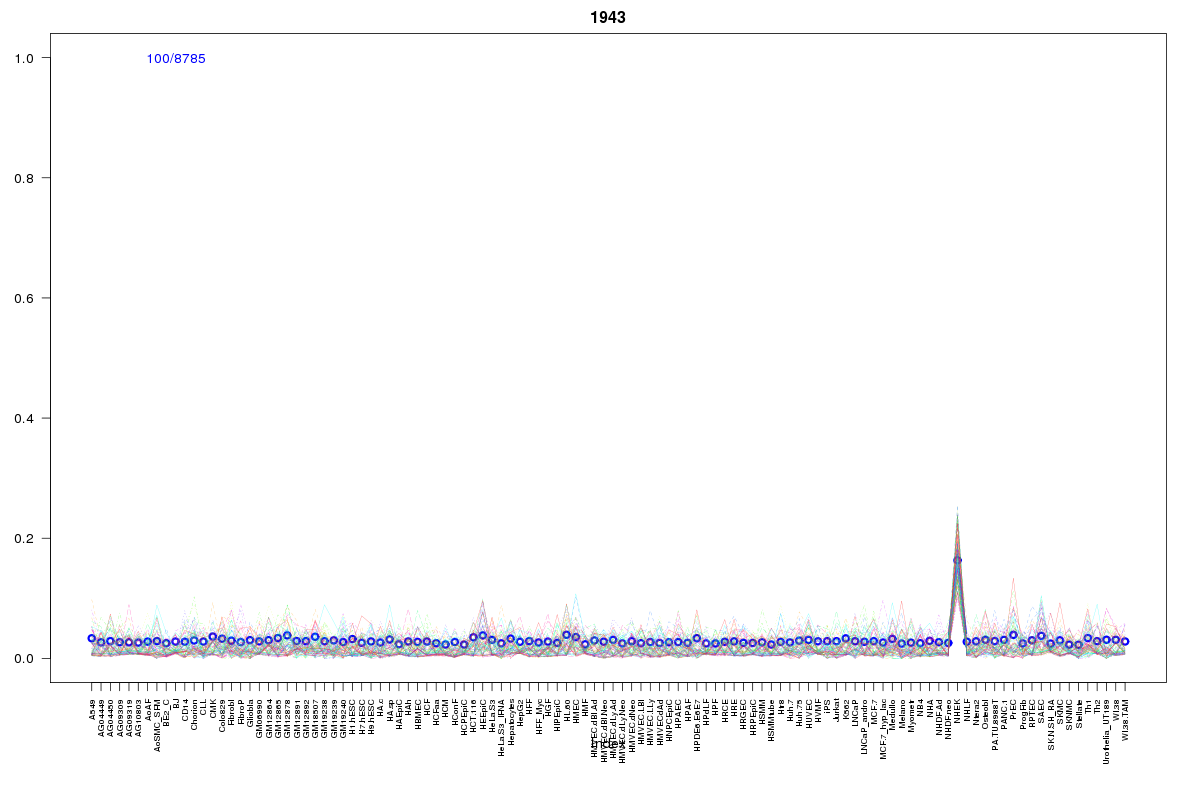 | 1943 | 2 |
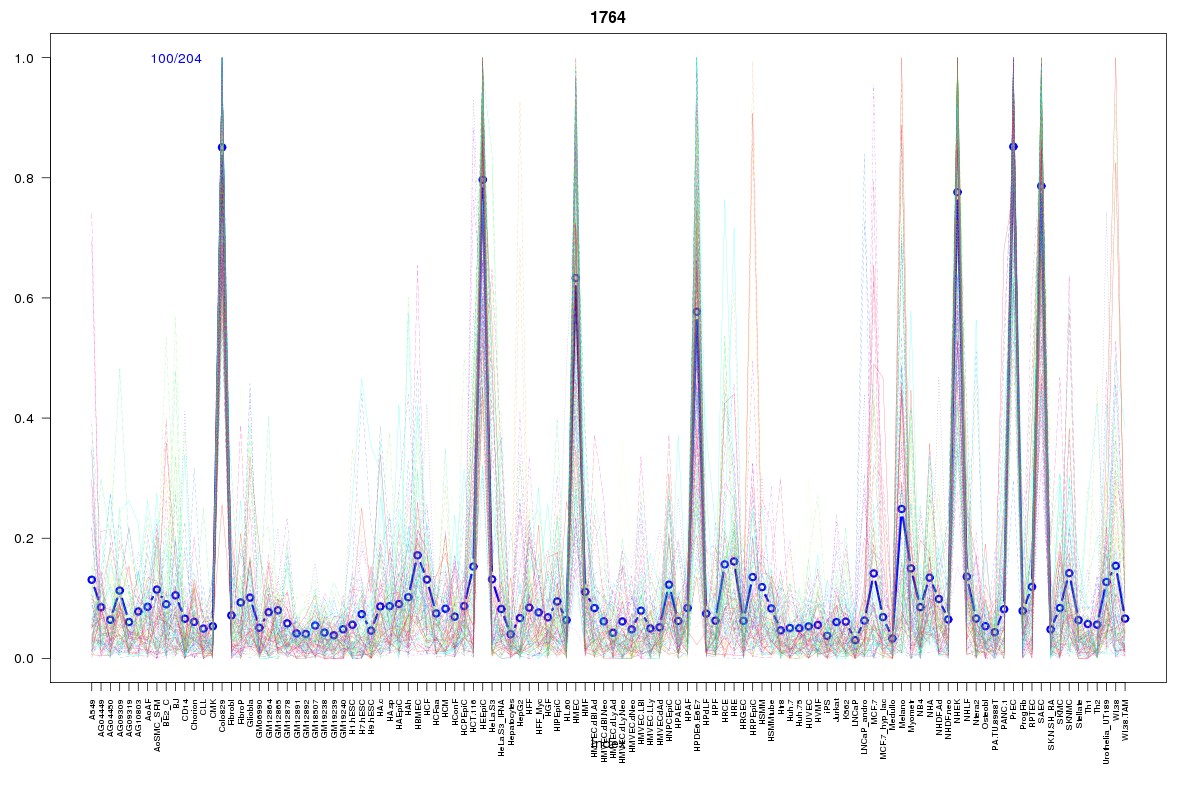 | 1764 | 1 |
 | 227 | 1 |
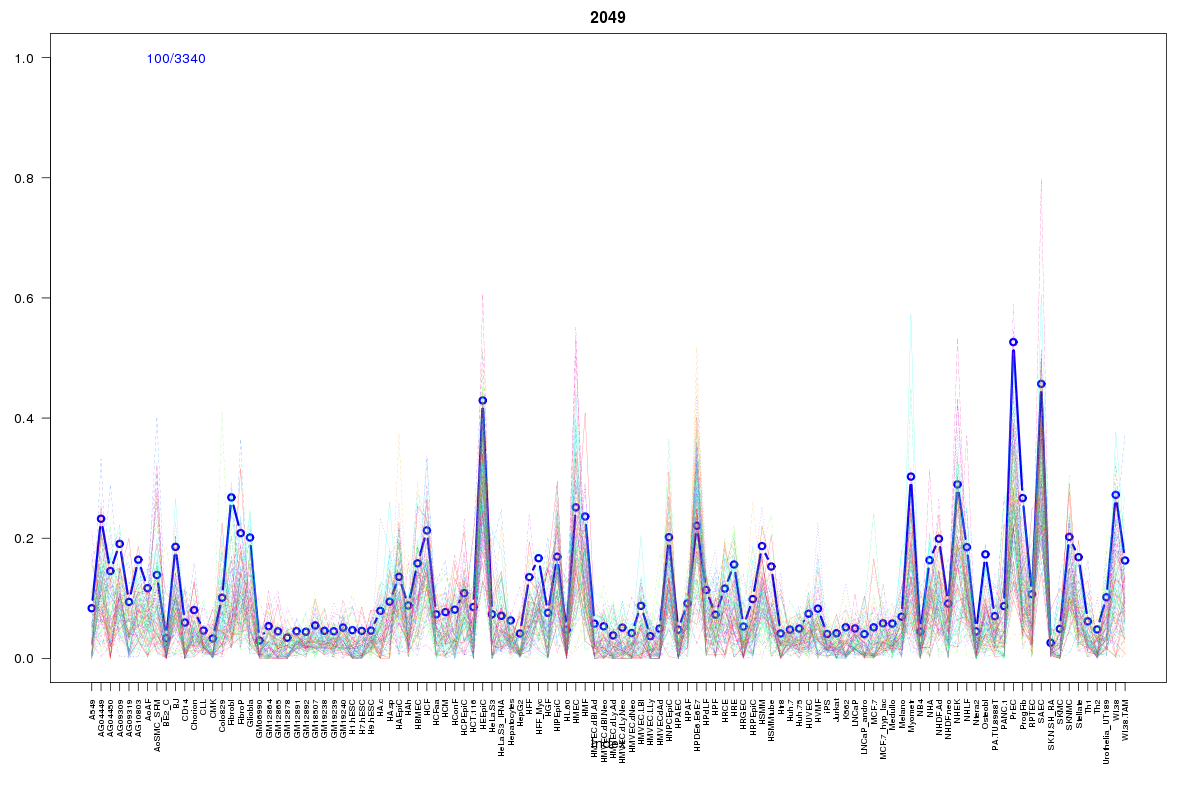 | 2049 | 1 |
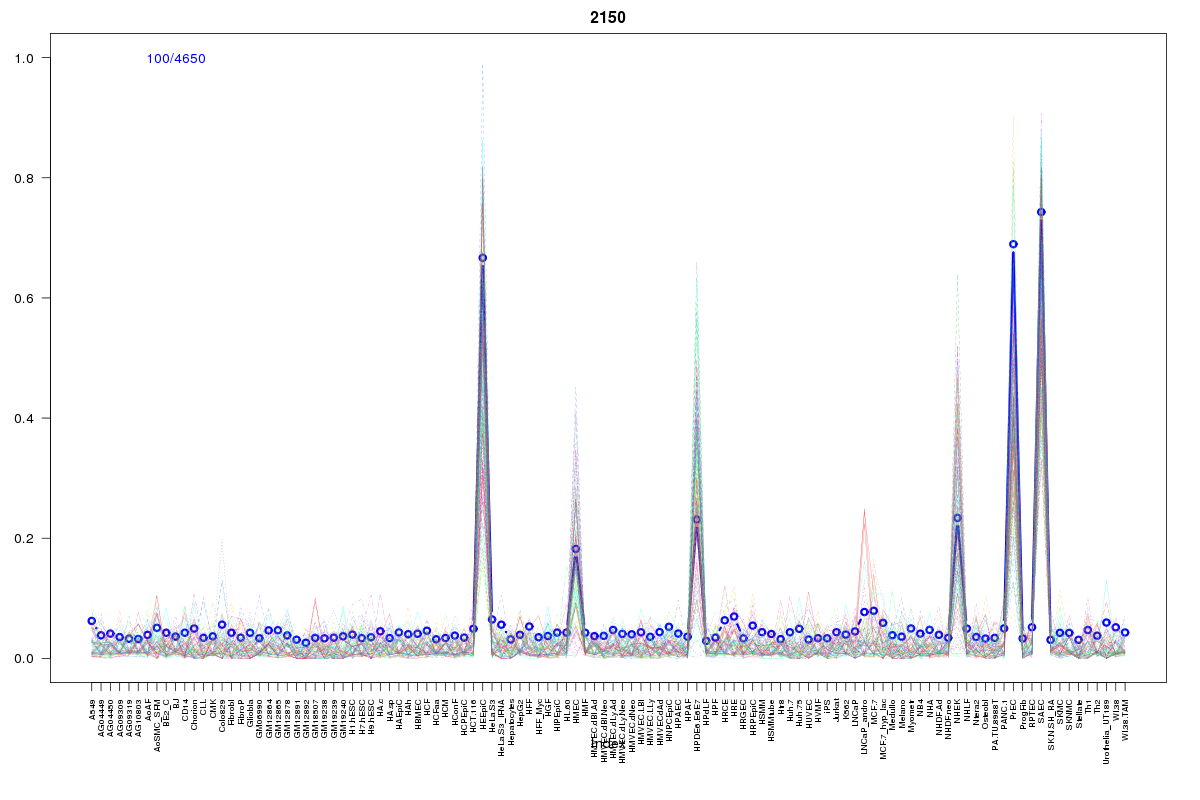 | 2150 | 1 |
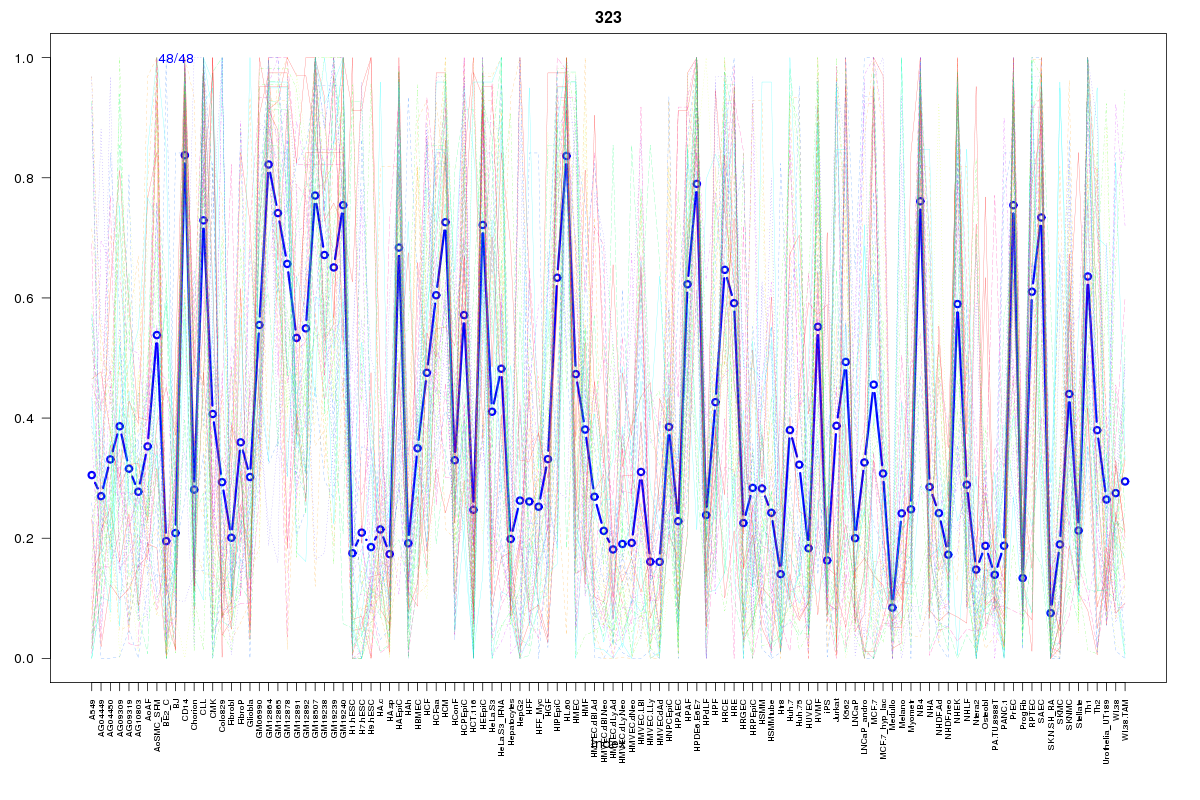 | 323 | 1 |
 | 18 | 1 |
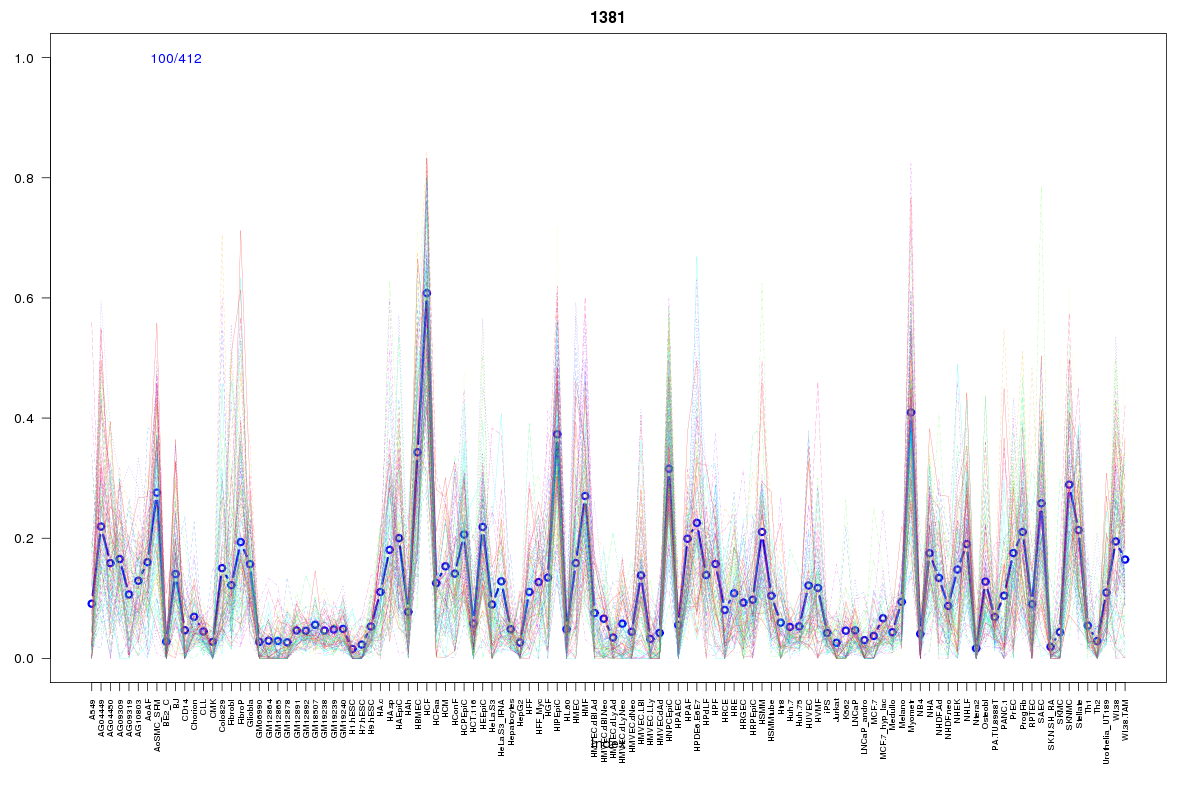 | 1381 | 1 |
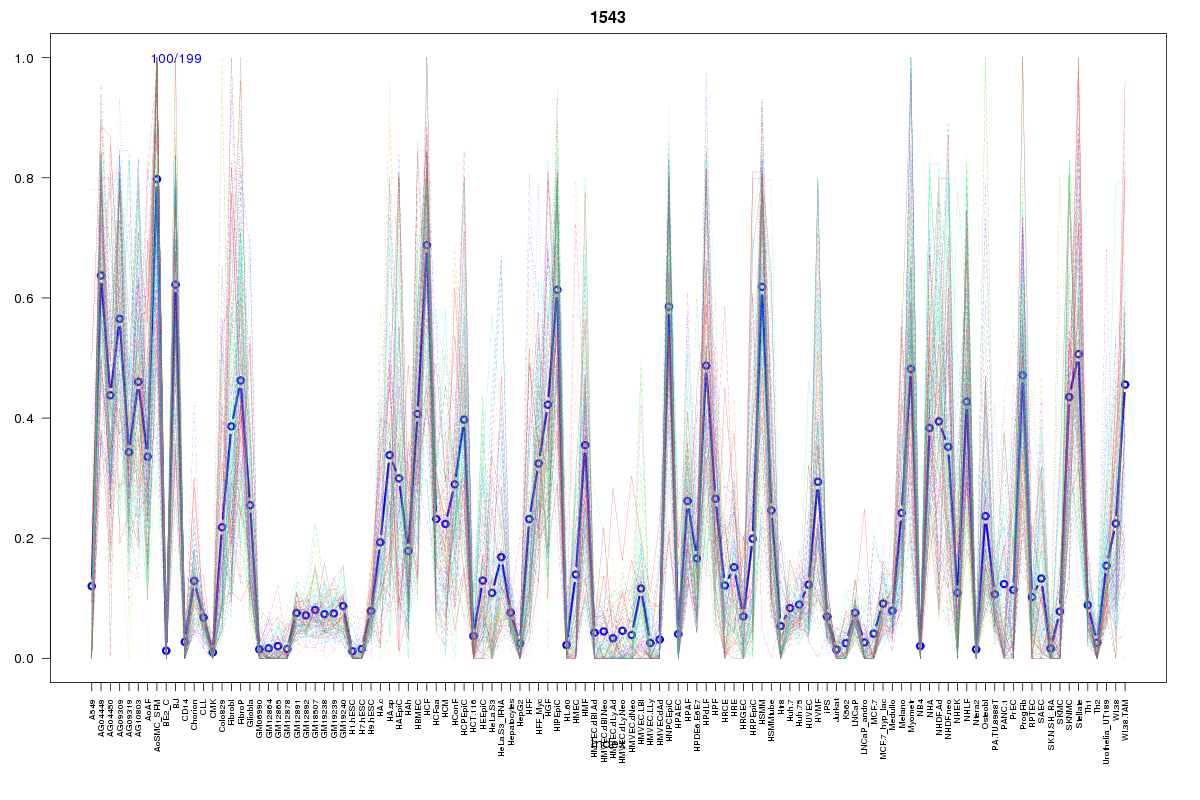 | 1543 | 1 |
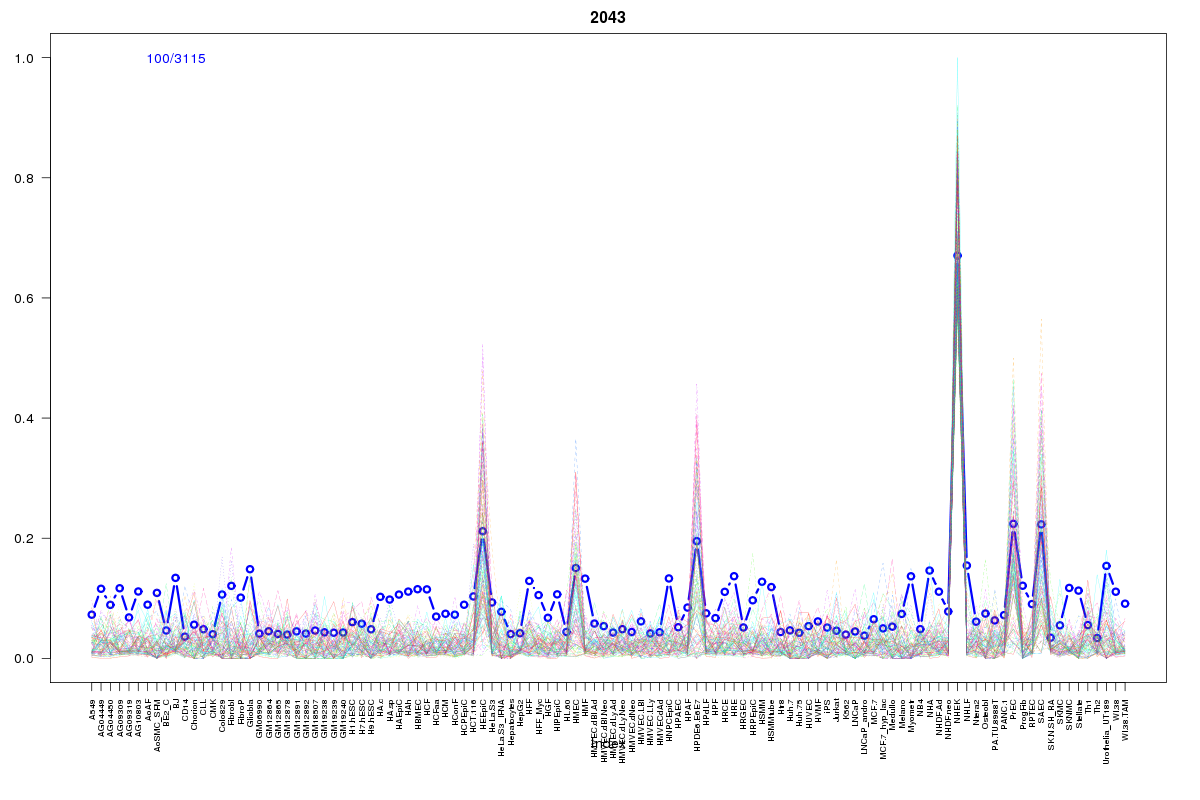 | 2043 | 1 |
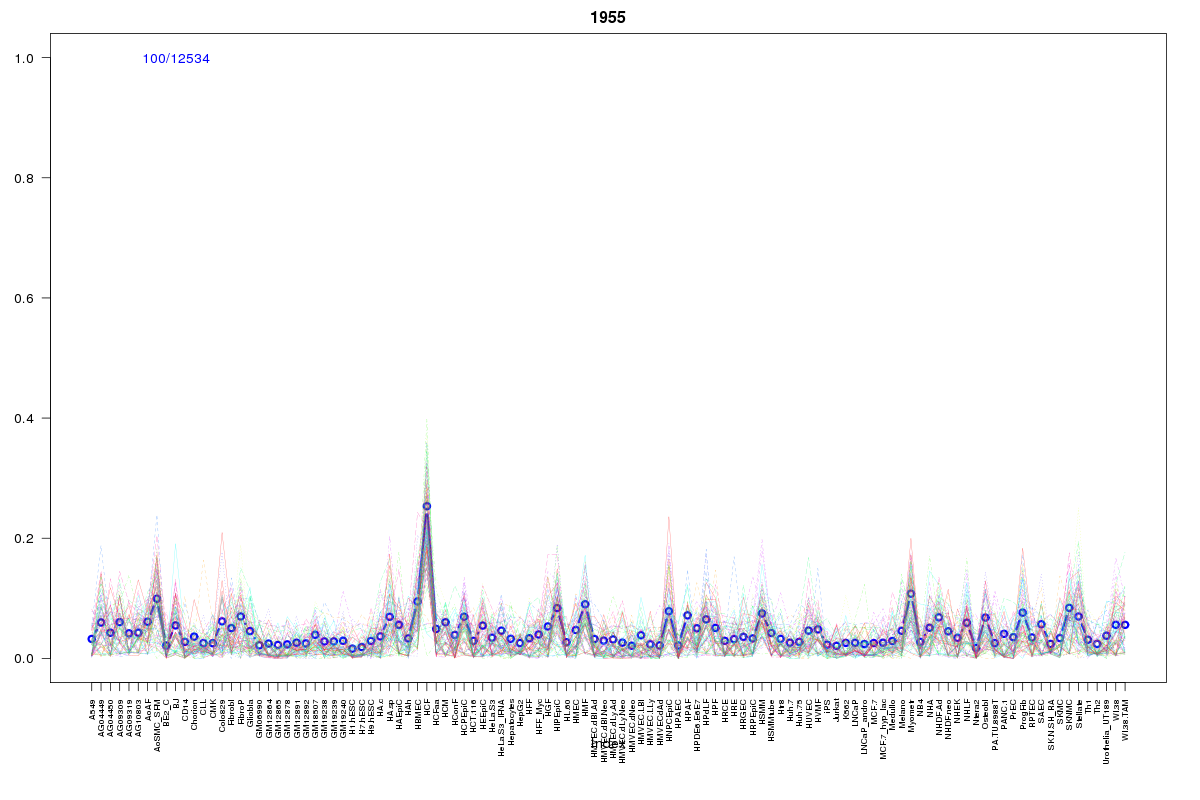 | 1955 | 1 |
 | 2298 | 1 |
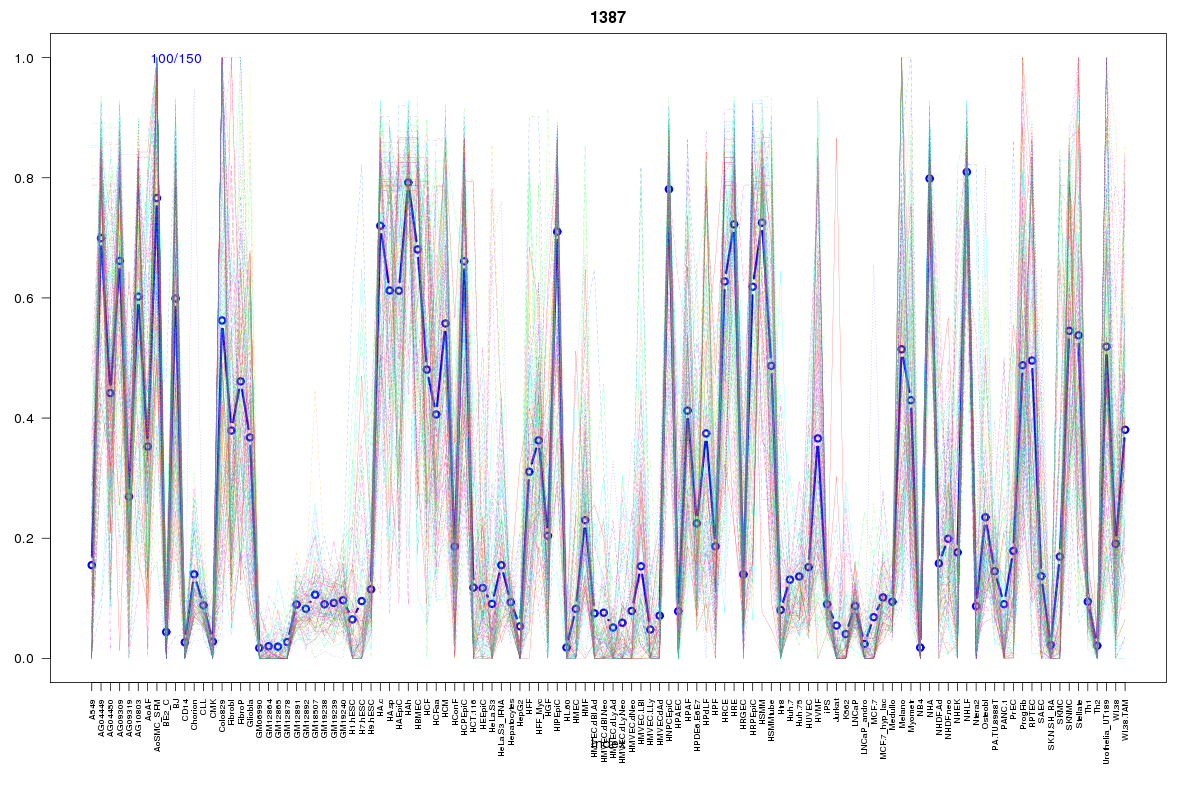 | 1387 | 1 |
Resources
BED file downloads
Connects to 20 DHS sitesTop 10 Correlated DHS Sites
p-values indiciate significant higher or lower correlation| Location | Cluster | P-value |
|---|---|---|
| chr3:130479920-130480070 | 1764 | 0 |
| chr3:130829040-130829190 | 1387 | 0 |
| chr3:130665880-130666030 | 2043 | 0.003 |
| chr3:130625560-130625710 | 1381 | 0.004 |
| chr3:130619900-130620050 | 18 | 0.005 |
| chr3:130654740-130654890 | 1543 | 0.005 |
| chr3:130565140-130565290 | 2150 | 0.005 |
| chr3:130694240-130694390 | 2298 | 0.006 |
| chr3:130539920-130540070 | 227 | 0.009 |
| chr3:130481100-130481250 | 1943 | 0.013 |
| chr3:130560280-130560430 | 2049 | 0.016 |
External Databases
UCSCEnsembl (ENSG00000017260)