SOM cluster: 999
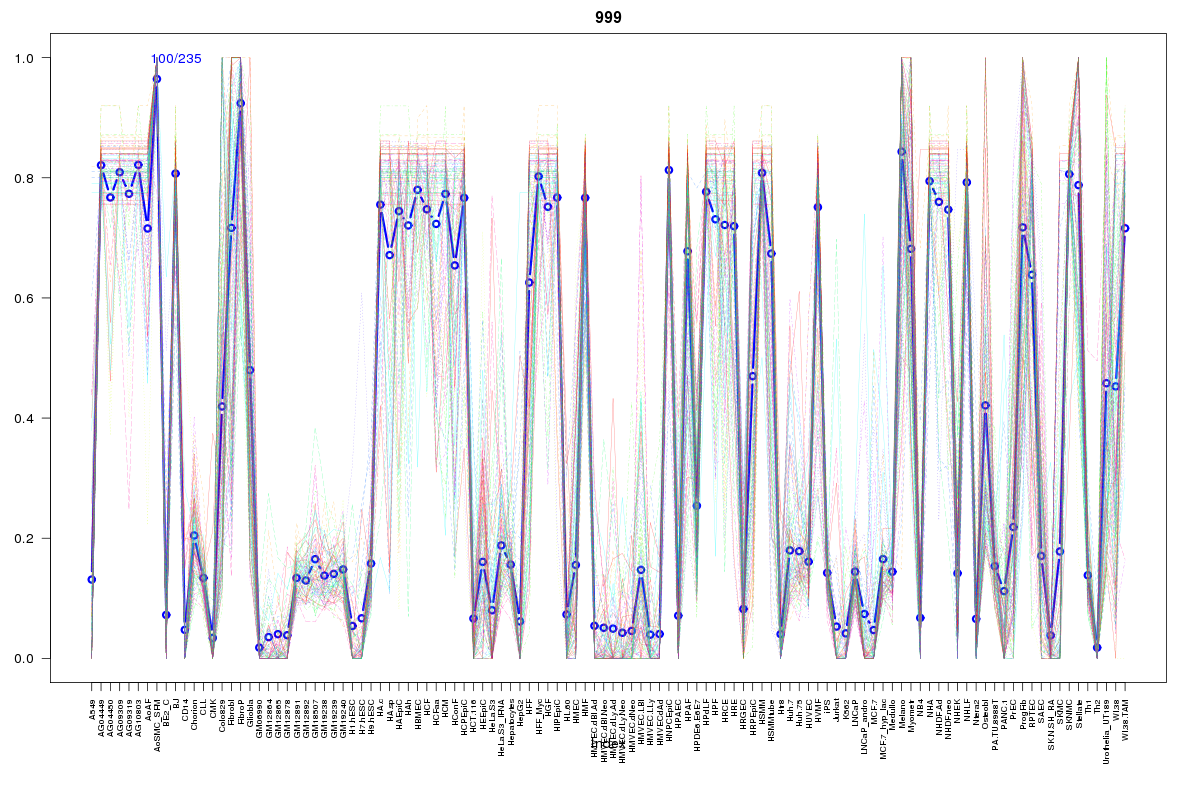
Cluster Hypersensitivity Profile

Genomic Location Trend
These plots show the distribution of the DHS sites surrounding the Transcript Start Site of the nearest gene.
Stats
Number of sites: 235Promoter: 1%
CpG-Island: 0%
Conserved: 63%
Enriched Motifs & Matches
Match Detail: [Jaspar]
|
| ||
|---|---|---|
| Sites: 19/100 | e-val: 0.0000000012 | ||
| Factor | e-val(match) | DB |
| Foxd3 | 0.000019962 | JASPAR |
| FOXI1 | 0.00024051 | JASPAR |
| Foxq1 | 0.0005496 | JASPAR |
| MEF2A | 0.0017517 | JASPAR |
| FOXA1 | 0.00396 | JASPAR |
|
| ||
| Sites: 36/100 | e-val: 0.0000034 | ||
| Factor | e-val(match) | DB |
| RUNX1 | 0.0000005559 | JASPAR |
| RREB1 | 0.00030536 | JASPAR |
| ZNF354C | 0.002257 | JASPAR |
| Tcfcp2l1 | 0.0067999 | JASPAR |
| IRF2 | 0.014195 | JASPAR |
|
| ||
| Sites: 37/100 | e-val: 0.00022 | ||
| Factor | e-val(match) | DB |
| TEAD1 | 0.0000000064918 | JASPAR |
| znf143 | 0.00045671 | JASPAR |
| REL | 0.00055966 | JASPAR |
| NF-kappaB | 0.00098468 | JASPAR |
| NFATC2 | 0.0035049 | JASPAR |
BED file downloads
Top 10 Example Regions
| Location | Gene Link | Dist. |
|---|---|---|
| chr1: 149958540-149958690 | OTUD7B | 18.93 |
| chr1: 149958540-149958690 | BOLA1 | 18.93 |
| chr1: 149958540-149958690 | MTMR11 | 18.93 |
| chr1: 149958540-149958690 | HIST2H2AB | 18.93 |
| chr1: 149958540-149958690 | SV2A | 18.93 |
| chr7: 65732400-65732550 | TPST1 | 51.09 |
| chr20: 21164020-21164170 | RP4-777D9.2 | 53.67 |
| chr18: 2881660-2881810 | SMCHD1 | 58.64 |
| chr11: 9809840-9809990 | SBF2-AS1 | 60.52 |
| chr17: 29596640-29596790 | OMG | 61.08 |