SOM cluster: 994
Cluster Hypersensitivity Profile

Genomic Location Trend
These plots show the distribution of the DHS sites surrounding the Transcript Start Site of the nearest gene.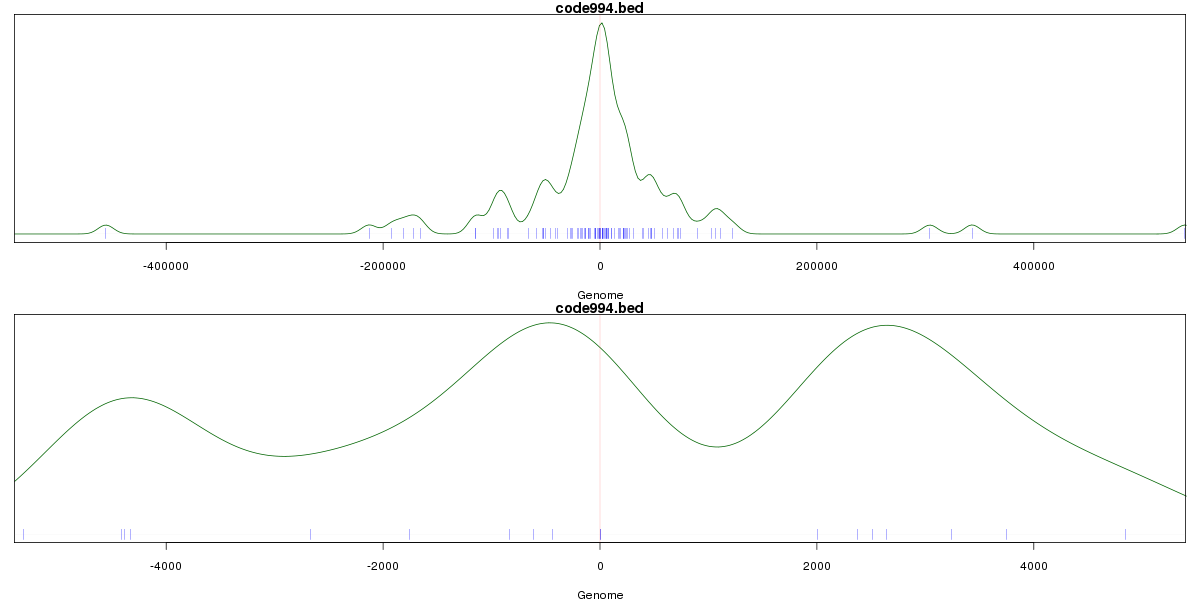
Stats
Number of sites: 132Promoter: 6%
CpG-Island: 1%
Conserved: 46%
Enriched Motifs & Matches
Match Detail: [Jaspar]
|
| ||
|---|---|---|
| Sites: 85/100 | e-val: 5.5e-33 | ||
| Factor | e-val(match) | DB |
| AP1 | 0.00000000007012 | JASPAR |
| NFE2L2 | 0.000000004727 | JASPAR |
| PPARG | 0.0035198 | JASPAR |
| NFE2L1::MafG | 0.0043453 | JASPAR |
| Pax6 | 0.0157 | JASPAR |
BED file downloads
Top 10 Example Regions
| Location | Gene Link | Dist. |
|---|---|---|
| chr12: 105622440-105622590 | C12orf75 | 38.96 |
| chr12: 125166540-125166690 | SCARB1 | 49.41 |
| chr12: 105598840-105598990 | APPL2 | 49.57 |
| chr12: 105598840-105598990 | KIAA1033 | 49.57 |
| chr11: 19618860-19619010 | NAV2-AS5 | 52.91 |
| chr3: 37096060-37096210 | LRRFIP2 | 55.46 |
| chr3: 37096060-37096210 | PRADC1P1 | 55.46 |
| chr4: 148693600-148693750 | PRMT10 | 57.52 |
| chr4: 148693600-148693750 | RN7SL254P | 57.52 |
| chr3: 33434260-33434410 | FBXL2 | 57.64 |