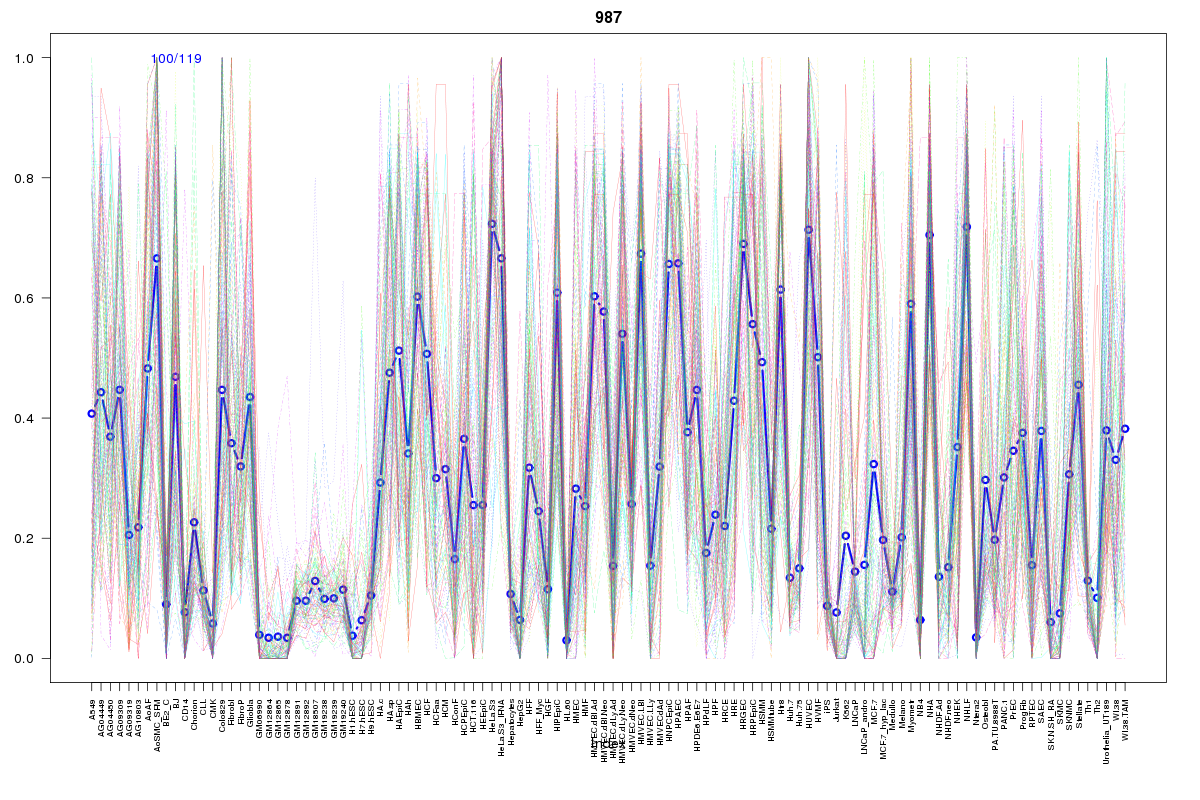
SOM cluster: 987
Cluster Hypersensitivity Profile

Genomic Location Trend
These plots show the distribution of the DHS sites surrounding the Transcript Start Site of the nearest gene.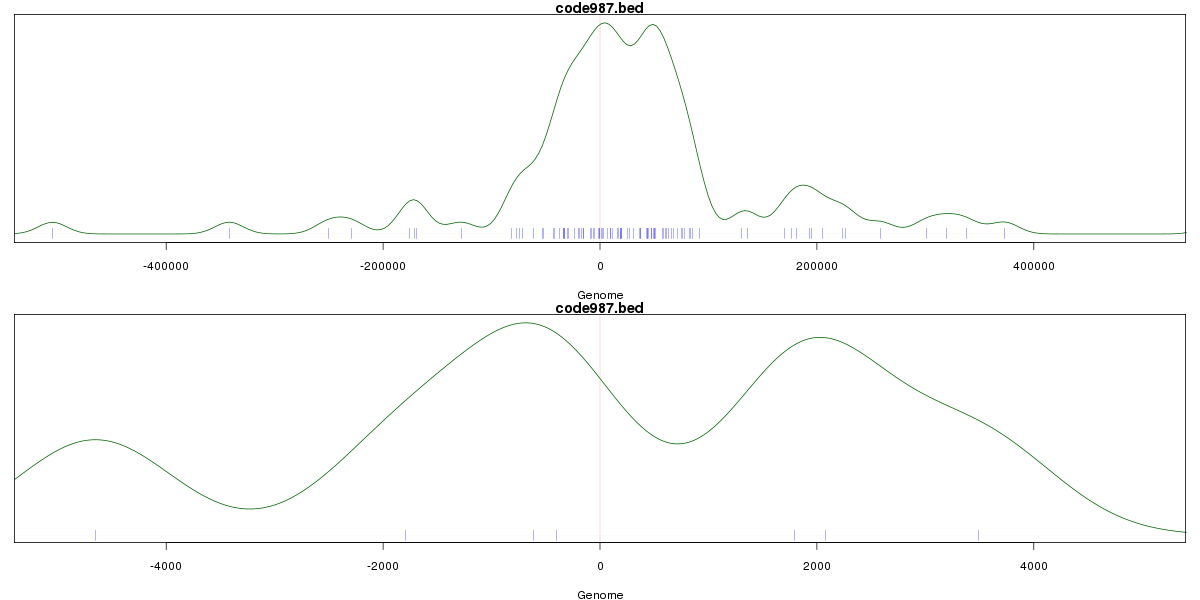
Stats
Number of sites: 119Promoter: 3%
CpG-Island: 0%
Conserved: 44%
Enriched Motifs & Matches
Match Detail: [Jaspar]
|
| ||
|---|---|---|
| Sites: 58/100 | e-val: 1e-32 | ||
| Factor | e-val(match) | DB |
| NFE2L2 | 0.0000000017812 | JASPAR |
| AP1 | 0.0000000037117 | JASPAR |
| NFE2L1::MafG | 0.0001223 | JASPAR |
| Pax2 | 0.0086859 | JASPAR |
| PBX1 | 0.011443 | JASPAR |
|
| ||
| Sites: 41/100 | e-val: 0.12 | ||
| Factor | e-val(match) | DB |
| Foxd3 | 0.0014763 | JASPAR |
| ARID3A | 0.0029098 | JASPAR |
| Foxq1 | 0.0065108 | JASPAR |
| FOXA1 | 0.0084078 | JASPAR |
| MEF2A | 0.010058 | JASPAR |
BED file downloads
Top 10 Example Regions
| Location | Gene Link | Dist. |
|---|---|---|
| chr7: 55416300-55416450 | RP11-775L16.1 | 50.95 |
| chr11: 102845780-102845930 | MMP13 | 54.27 |
| chr8: 17206145-17206295 | VPS37A | 55.59 |
| chr2: 42846260-42846410 | Y_RNA | 58.99 |
| chr2: 150518500-150518650 | RNU6-601P | 60.29 |
| chr3: 158909380-158909530 | IQCJ-SCHIP1 | 73.29 |
| chr2: 46295345-46295495 | AC017078.1 | 74.32 |
| chr3: 197193180-197193330 | BDH1 | 75.35 |
| chr16: 69251480-69251630 | SNTB2 | 79.24 |
| chr13: 97912320-97912470 | MBNL2 | 82.6 |