SOM cluster: 985
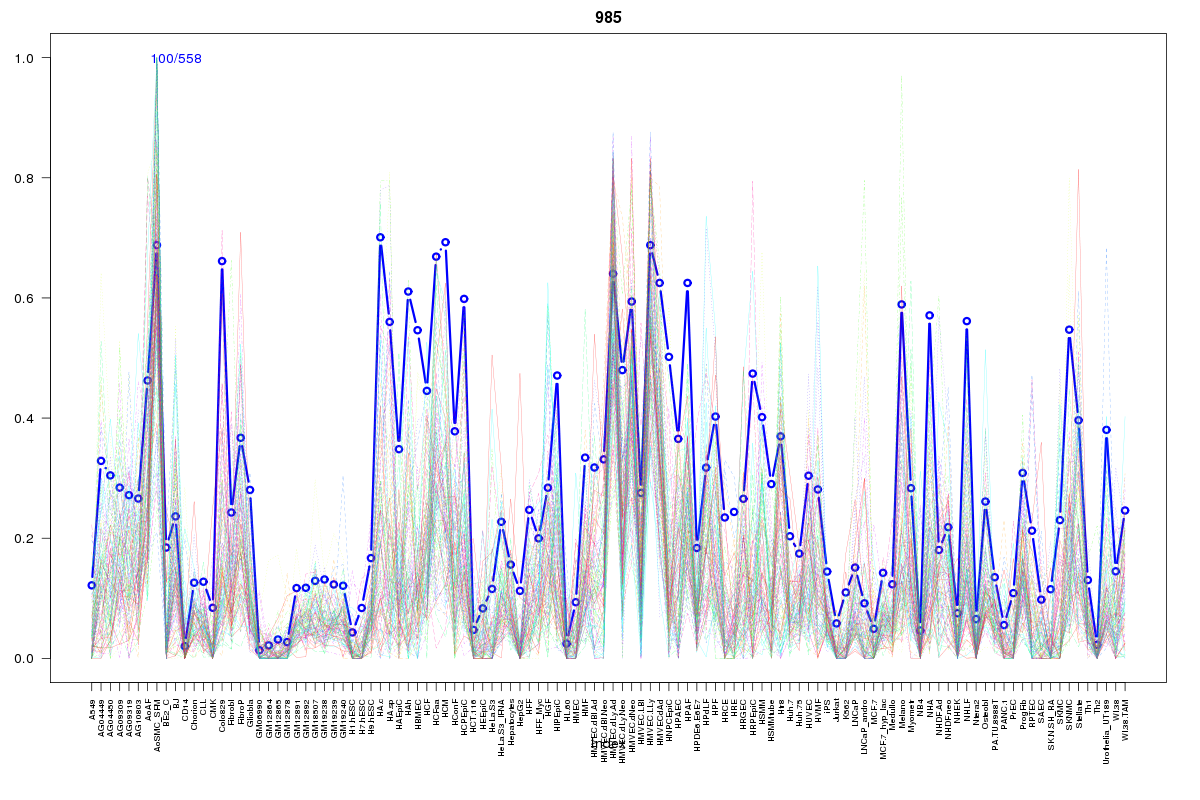
Cluster Hypersensitivity Profile

Genomic Location Trend
These plots show the distribution of the DHS sites surrounding the Transcript Start Site of the nearest gene.
Stats
Number of sites: 558Promoter: 3%
CpG-Island: 0%
Conserved: 61%
Enriched Motifs & Matches
Match Detail: [Jaspar]
|
| ||
|---|---|---|
| Sites: 40/100 | e-val: 0.00000000012 | ||
| Factor | e-val(match) | DB |
| FOXI1 | 0.0026551 | JASPAR |
| Foxd3 | 0.0037995 | JASPAR |
| Evi1 | 0.0055312 | JASPAR |
| IRF1 | 0.0066319 | JASPAR |
| Lhx3 | 0.0079212 | JASPAR |
|
| ||
| Sites: 20/100 | e-val: 0.0014 | ||
| Factor | e-val(match) | DB |
| SOX9 | 0.00015991 | JASPAR |
| NFATC2 | 0.0010473 | JASPAR |
| MEF2A | 0.0019471 | JASPAR |
| Sox2 | 0.0041627 | JASPAR |
| NR3C1 | 0.0041666 | JASPAR |
BED file downloads
Top 10 Example Regions
| Location | Gene Link | Dist. |
|---|---|---|
| chr1: 145478080-145478230 | RBM8A | 13.56 |
| chr1: 145478080-145478230 | GNRHR2 | 13.56 |
| chr1: 145478080-145478230 | TXNIP | 13.56 |
| chr10: 17252440-17252590 | CUBN | 33.85 |
| chr10: 17252440-17252590 | VIM-AS1 | 33.85 |
| chr10: 17252440-17252590 | RP11-124N14.3 | 33.85 |
| chr10: 17252440-17252590 | VIM | 33.85 |
| chr4: 90418200-90418350 | RP11-115D19.1 | 42.74 |
| chr17: 15372825-15372975 | TVP23C | 45.46 |
| chr17: 15372825-15372975 | RN7SL792P | 45.46 |