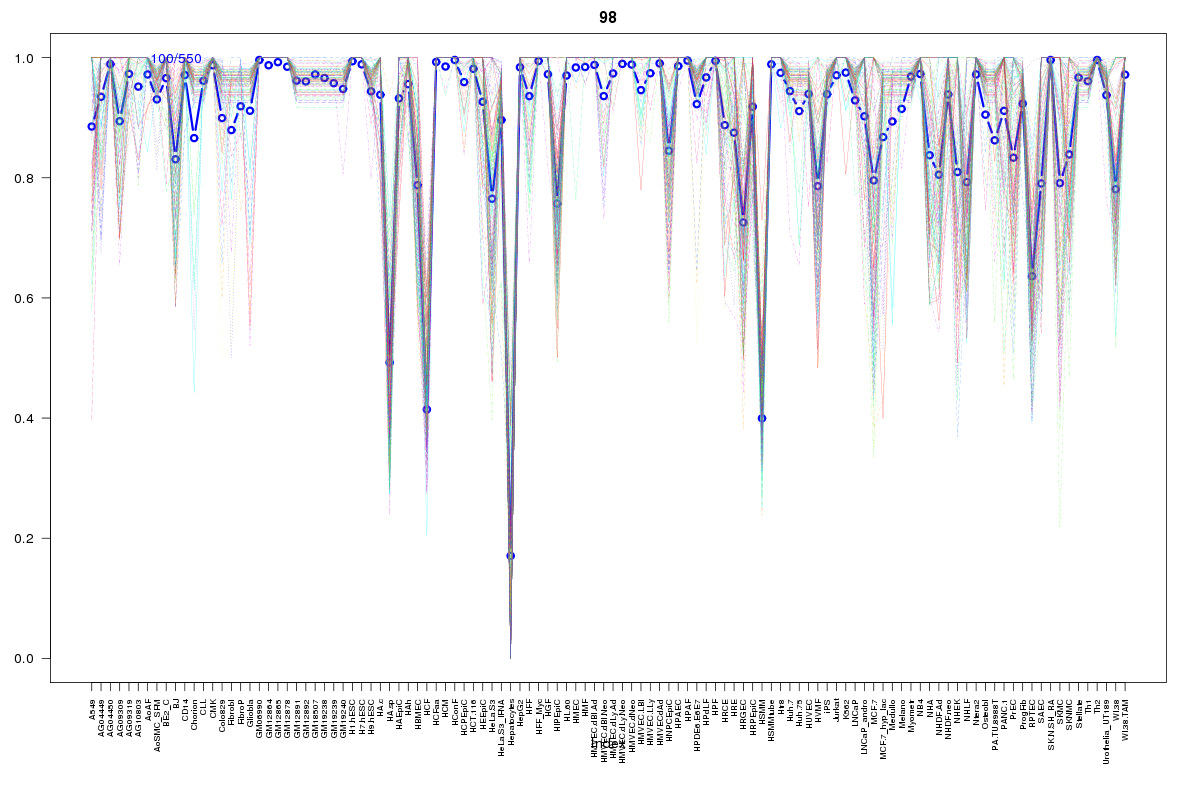
SOM cluster: 98
Cluster Hypersensitivity Profile

Genomic Location Trend
These plots show the distribution of the DHS sites surrounding the Transcript Start Site of the nearest gene.
Stats
Number of sites: 550Promoter: 93%
CpG-Island: 98%
Conserved: 93%
Enriched Motifs & Matches
Match Detail: [Jaspar]
|
| ||
|---|---|---|
| Sites: 99/100 | e-val: 0 | ||
| Factor | e-val(match) | DB |
| SP1 | 0.0000010783 | JASPAR |
| TFAP2A | 0.00018515 | JASPAR |
| PLAG1 | 0.0011232 | JASPAR |
| Egr1 | 0.02939 | JASPAR |
| E2F1 | 0.038939 | JASPAR |
|
| ||
| Sites: 94/100 | e-val: 0 | ||
| Factor | e-val(match) | DB |
| SP1 | 0.0000000080425 | JASPAR |
| Egr1 | 0.0001532 | JASPAR |
| Klf4 | 0.000342 | JASPAR |
| TFAP2A | 0.0013821 | JASPAR |
| PLAG1 | 0.0079699 | JASPAR |
|
| ||
| Sites: 8/100 | e-val: 0.00034 | ||
| Factor | e-val(match) | DB |
| Myb | 0.0015559 | JASPAR |
| znf143 | 0.0034522 | JASPAR |
| RELA | 0.0035015 | JASPAR |
| RUNX1 | 0.0068966 | JASPAR |
| SPI1 | 0.017828 | JASPAR |
|
| ||
| Sites: 71/100 | e-val: 0.000016 | ||
| Factor | e-val(match) | DB |
| TFAP2A | 0.0017185 | JASPAR |
| GABPA | 0.0047047 | JASPAR |
| SP1 | 0.009122 | JASPAR |
| ELK4 | 0.042045 | JASPAR |
| Egr1 | 0.063925 | JASPAR |
|
| ||
| Sites: 62/100 | e-val: 0.000082 | ||
| Factor | e-val(match) | DB |
| Klf4 | 0.000000038219 | JASPAR |
| SP1 | 0.00000014442 | JASPAR |
| Tal1::Gata1 | 0.000562 | JASPAR |
| Egr1 | 0.0014608 | JASPAR |
| TFAP2A | 0.0024071 | JASPAR |
BED file downloads
Top 10 Example Regions
| Location | Gene Link | Dist. |
|---|---|---|
| chr8: 17780340-17780490 | FGL1 | 34.33 |
| chr8: 17780340-17780490 | RP11-156K13.2 | 34.33 |
| chr8: 17780340-17780490 | RP11-156K13.1 | 34.33 |
| chr2: 136743140-136743290 | AC068492.1 | 41.17 |
| chr11: 125439200-125439350 | EI24 | 43.71 |
| chr3: 48282540-48282690 | CDC25A | 46.58 |
| chr1: 145827020-145827170 | PDZK1 | 50.12 |
| chr1: 230778060-230778210 | AGT | 50.71 |
| chr1: 19536780-19536930 | AKR7A3 | 53.67 |
| chr5: 68530600-68530750 | CCNB1 | 53.99 |