SOM cluster: 972
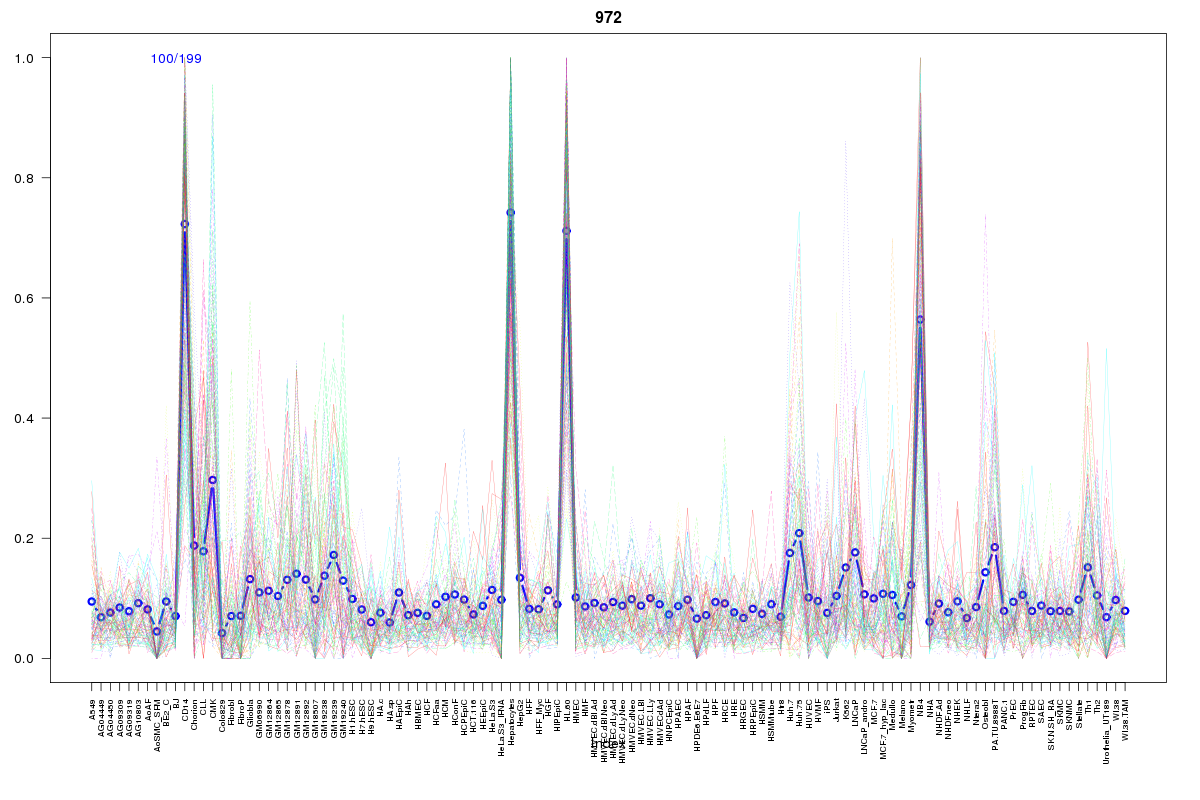
Cluster Hypersensitivity Profile

Genomic Location Trend
These plots show the distribution of the DHS sites surrounding the Transcript Start Site of the nearest gene.
Stats
Number of sites: 199Promoter: 26%
CpG-Island: 2%
Conserved: 33%
Enriched Motifs & Matches
Match Detail: [Jaspar]
|
| ||
|---|---|---|
| Sites: 56/100 | e-val: 9.2e-22 | ||
| Factor | e-val(match) | DB |
| SPI1 | 0.0000018152 | JASPAR |
| SPIB | 0.0000029088 | JASPAR |
| IRF1 | 0.00034622 | JASPAR |
| FEV | 0.001882 | JASPAR |
| ELF5 | 0.0070179 | JASPAR |
BED file downloads
Top 10 Example Regions
| Location | Gene Link | Dist. |
|---|---|---|
| chr3: 126249460-126249610 | UROC1 | 40.99 |
| chr9: 139416080-139416230 | C9orf163 | 44.12 |
| chr11: 64086900-64087050 | VEGFB | 48.55 |
| chr11: 64086900-64087050 | FKBP2 | 48.55 |
| chr11: 66102680-66102830 | SLC29A2 | 53.03 |
| chr15: 90749200-90749350 | CTD-2315E11.1 | 55.9 |
| chr20: 62492040-62492190 | TPD52L2 | 56.46 |
| chr20: 1876345-1876495 | SIRPA | 58.06 |
| chr8: 126507620-126507770 | RP11-136O12.2 | 59.71 |
| chr8: 67626220-67626370 | SGK3 | 60.2 |