SOM cluster: 971
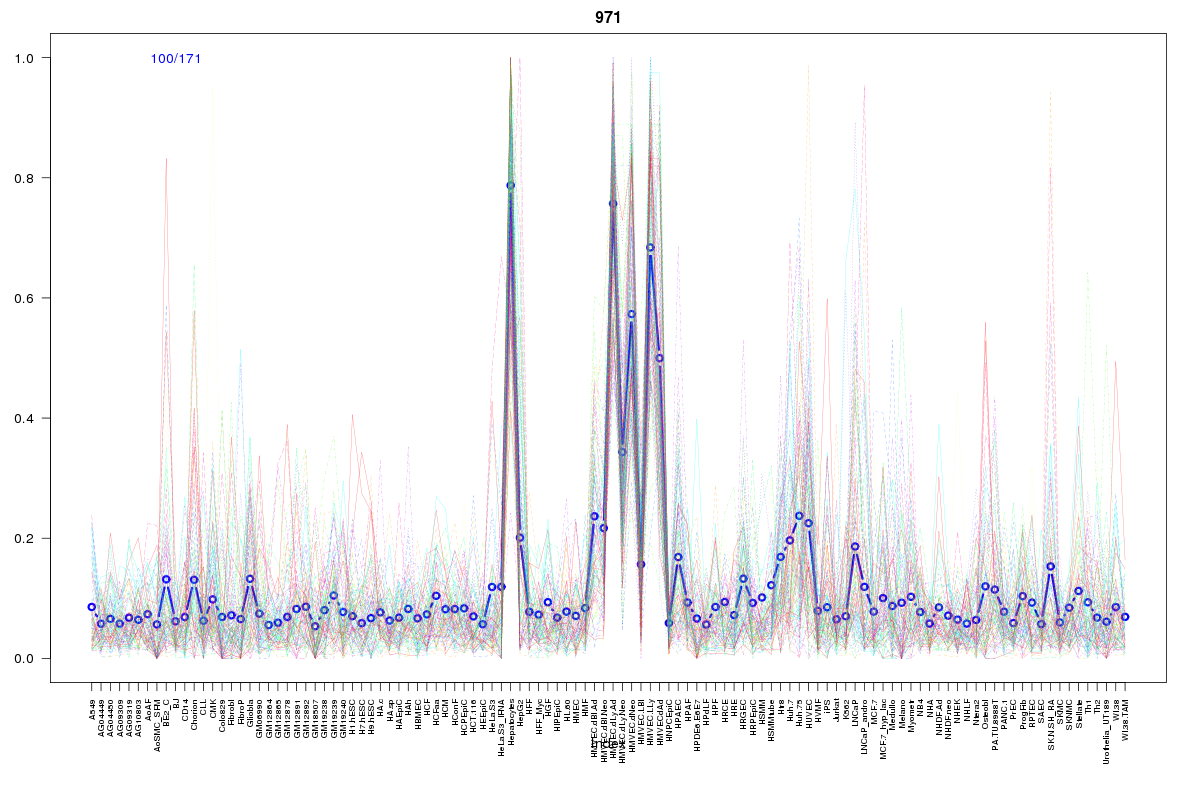
Cluster Hypersensitivity Profile

Genomic Location Trend
These plots show the distribution of the DHS sites surrounding the Transcript Start Site of the nearest gene.
Stats
Number of sites: 171Promoter: 12%
CpG-Island: 7%
Conserved: 41%
Enriched Motifs & Matches
Match Detail: [Jaspar]
|
| ||
|---|---|---|
| Sites: 41/100 | e-val: 0.11 | ||
| Factor | e-val(match) | DB |
| REST | 0.00023467 | JASPAR |
| SP1 | 0.0020785 | JASPAR |
| TFAP2A | 0.0062701 | JASPAR |
| FEV | 0.0067106 | JASPAR |
| Stat3 | 0.0073498 | JASPAR |
BED file downloads
Top 10 Example Regions
| Location | Gene Link | Dist. |
|---|---|---|
| chr8: 10585880-10586030 | CTD-2135J3.3 | 42.86 |
| chr22: 19755160-19755310 | TBX1 | 45.07 |
| chr7: 150782425-150782575 | NOS3 | 48.65 |
| chr7: 150782425-150782575 | AGAP3 | 48.65 |
| chr9: 130532160-130532310 | SH2D3C | 48.91 |
| chr4: 1041420-1041570 | IDUA | 51.86 |
| chr4: 1041420-1041570 | FGFRL1 | 51.86 |
| chr9: 116415100-116415250 | RP11-168K11.2 | 62.55 |
| chr9: 116273385-116273535 | RGS3 | 64.1 |
| chr11: 915140-915290 | EFCAB4A | 69.35 |