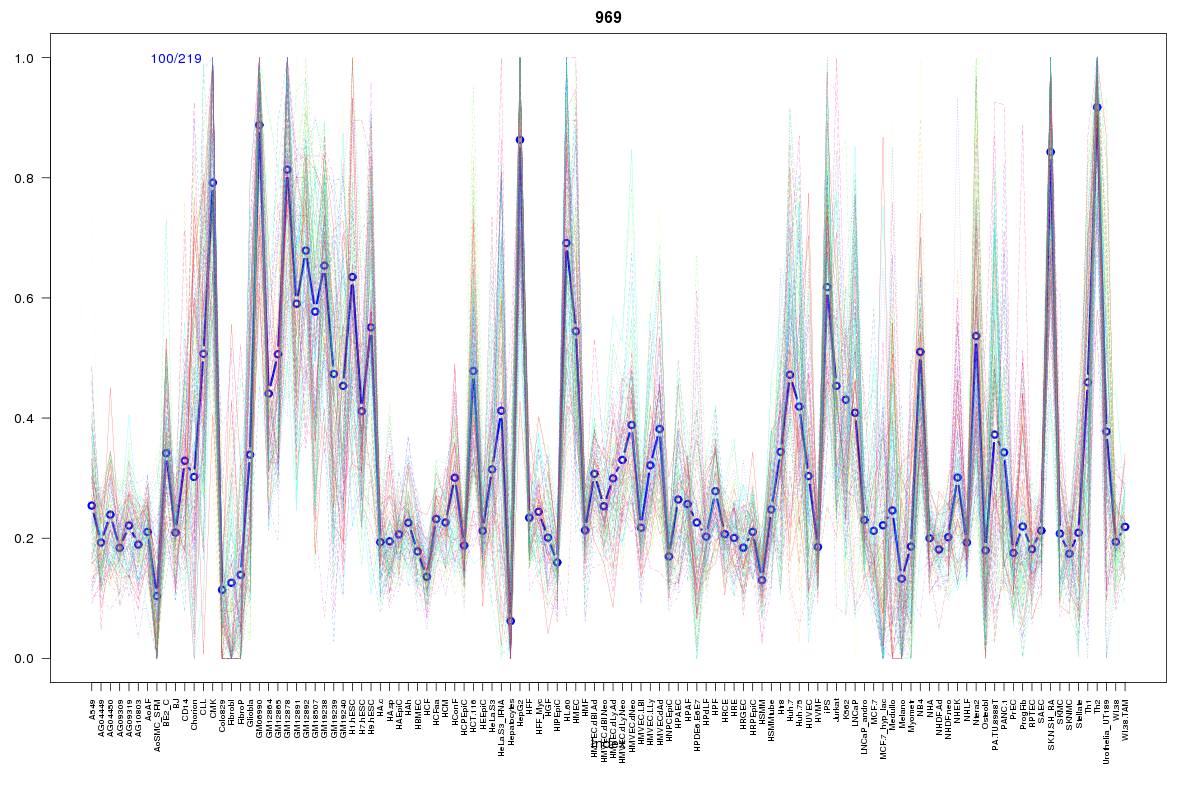
SOM cluster: 969
Cluster Hypersensitivity Profile

Genomic Location Trend
These plots show the distribution of the DHS sites surrounding the Transcript Start Site of the nearest gene.
Stats
Number of sites: 219Promoter: 37%
CpG-Island: 96%
Conserved: 65%
Enriched Motifs & Matches
Match Detail: [Jaspar]
|
| ||
|---|---|---|
| Sites: 97/100 | e-val: 0 | ||
| Factor | e-val(match) | DB |
| SP1 | 0.0000000010331 | JASPAR |
| TFAP2A | 0.00030071 | JASPAR |
| Egr1 | 0.0014921 | JASPAR |
| Klf4 | 0.0049514 | JASPAR |
| PLAG1 | 0.016448 | JASPAR |
|
| ||
| Sites: 93/100 | e-val: 0 | ||
| Factor | e-val(match) | DB |
| SP1 | 0.0000000040688 | JASPAR |
| PLAG1 | 0.000030126 | JASPAR |
| TFAP2A | 0.0014054 | JASPAR |
| Klf4 | 0.0015223 | JASPAR |
| Egr1 | 0.0057213 | JASPAR |
|
| ||
| Sites: 73/100 | e-val: 0.000000053 | ||
| Factor | e-val(match) | DB |
| TFAP2A | 0.00015663 | JASPAR |
| SP1 | 0.00015888 | JASPAR |
| PLAG1 | 0.0021307 | JASPAR |
| Zfx | 0.015384 | JASPAR |
| Klf4 | 0.03118 | JASPAR |
BED file downloads
Top 10 Example Regions
| Location | Gene Link | Dist. |
|---|---|---|
| chr11: 17298420-17298570 | RP11-452G18.1 | 34.99 |
| chr17: 76124940-76125090 | SYNGR2 | 39.06 |
| chr17: 76124940-76125090 | AFMID | 39.06 |
| chr17: 76124940-76125090 | TMC6 | 39.06 |
| chr17: 76124940-76125090 | TNRC6C-AS1 | 39.06 |
| chr17: 76124940-76125090 | TMC8 | 39.06 |
| chr17: 76124940-76125090 | BIRC5 | 39.06 |
| chr17: 76124940-76125090 | TK1 | 39.06 |
| chr3: 32726845-32726995 | CNOT10 | 39.26 |
| chr12: 49412285-49412435 | PRKAG1 | 47.38 |