SOM cluster: 96
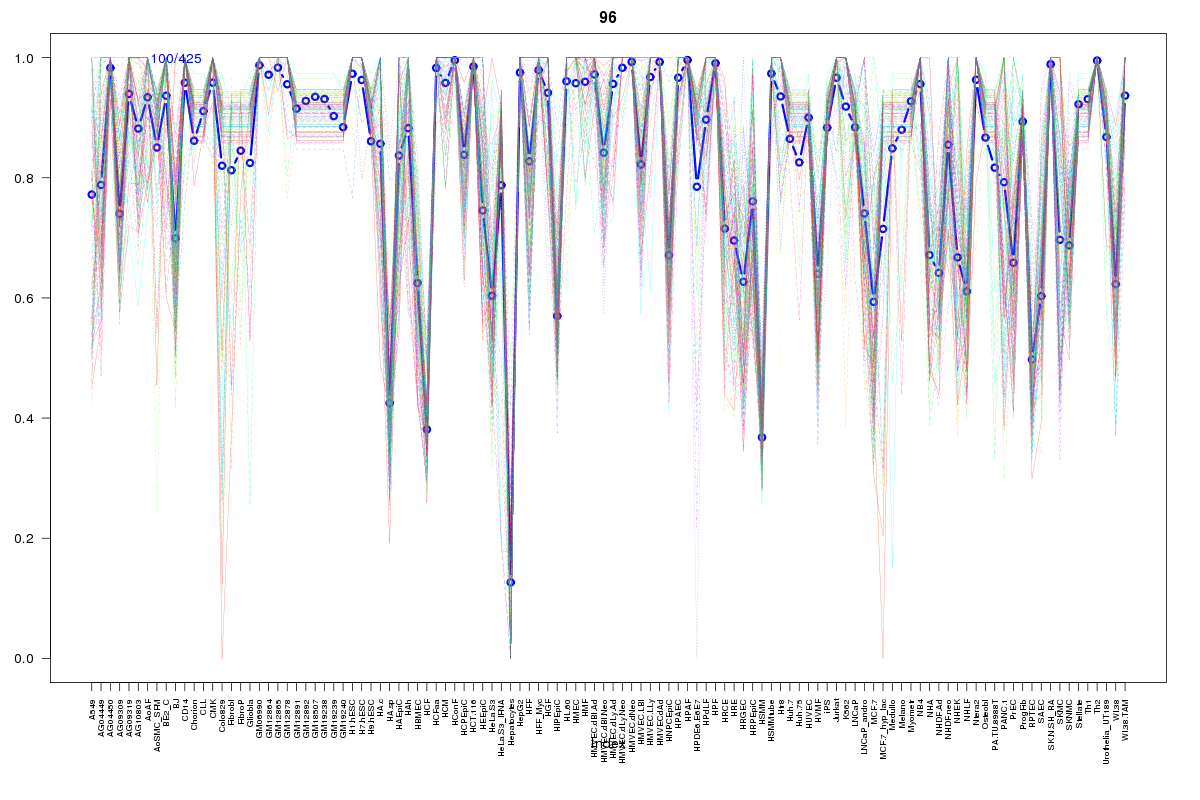
Cluster Hypersensitivity Profile

Genomic Location Trend
These plots show the distribution of the DHS sites surrounding the Transcript Start Site of the nearest gene.
Stats
Number of sites: 425Promoter: 90%
CpG-Island: 97%
Conserved: 93%
Enriched Motifs & Matches
Match Detail: [Jaspar]
|
| ||
|---|---|---|
| Sites: 94/100 | e-val: 0 | ||
| Factor | e-val(match) | DB |
| SP1 | 0.000000018948 | JASPAR |
| Klf4 | 0.00021843 | JASPAR |
| Egr1 | 0.013259 | JASPAR |
| PLAG1 | 0.016981 | JASPAR |
| NHLH1 | 0.020945 | JASPAR |
|
| ||
| Sites: 87/100 | e-val: 0 | ||
| Factor | e-val(match) | DB |
| SP1 | 0.00002963 | JASPAR |
| PLAG1 | 0.0015446 | JASPAR |
| TFAP2A | 0.002084 | JASPAR |
| Klf4 | 0.025716 | JASPAR |
| Egr1 | 0.054819 | JASPAR |
|
| ||
| Sites: 45/100 | e-val: 0.00000082 | ||
| Factor | e-val(match) | DB |
| Klf4 | 0.0000000021009 | JASPAR |
| SP1 | 0.00000032376 | JASPAR |
| Egr1 | 0.00033822 | JASPAR |
| Zfx | 0.0025501 | JASPAR |
| TFAP2A | 0.011305 | JASPAR |
BED file downloads
Top 10 Example Regions
| Location | Gene Link | Dist. |
|---|---|---|
| chrX: 47420820-47420970 | CXorf24 | 45.22 |
| chr11: 88070860-88071010 | CTSC | 47.51 |
| chr1: 151043600-151043750 | BNIPL | 50.22 |
| chr8: 124253560-124253710 | FAM83A-AS1 | 52.13 |
| chr8: 124253560-124253710 | TBC1D31 | 52.13 |
| chr2: 215674385-215674535 | BARD1 | 54.89 |
| chr5: 109024980-109025130 | KRT18P42 | 55.85 |
| chr4: 39367960-39368110 | LIAS | 56.34 |
| chr4: 39367960-39368110 | KLB | 56.34 |
| chr17: 6554840-6554990 | SLC13A5 | 56.78 |