SOM cluster: 959
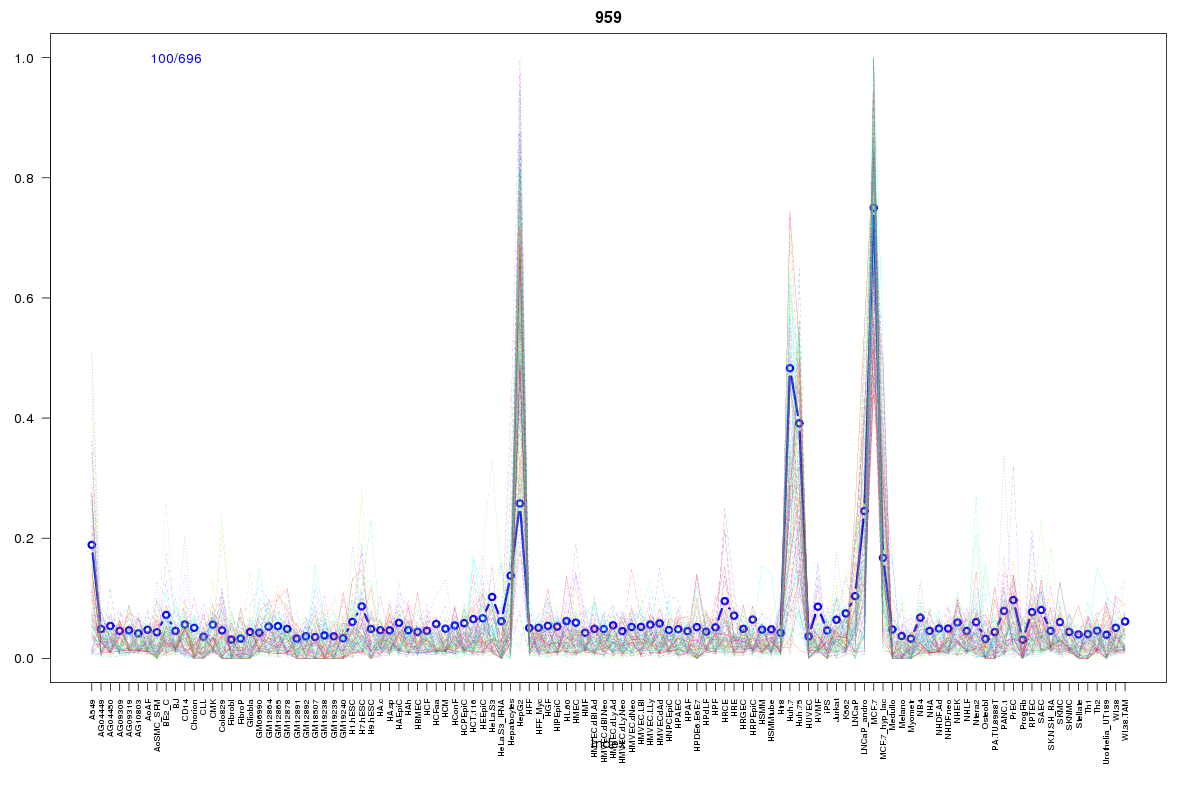
Cluster Hypersensitivity Profile

Genomic Location Trend
These plots show the distribution of the DHS sites surrounding the Transcript Start Site of the nearest gene.
Stats
Number of sites: 696Promoter: 4%
CpG-Island: 0%
Conserved: 27%
Enriched Motifs & Matches
Match Detail: [Jaspar]
|
| ||
|---|---|---|
| Sites: 19/100 | e-val: 0.000000000011 | ||
| Factor | e-val(match) | DB |
| FOXO3 | 0.0000018563 | JASPAR |
| HNF1B | 0.000001932 | JASPAR |
| HNF1A | 0.000035723 | JASPAR |
| NKX3-1 | 0.000039554 | JASPAR |
| Foxa2 | 0.000056028 | JASPAR |
|
| ||
| Sites: 24/100 | e-val: 0.024 | ||
| Factor | e-val(match) | DB |
| Foxa2 | 0.000000000067612 | JASPAR |
| FOXA1 | 0.00000000030595 | JASPAR |
| FOXD1 | 0.0000053349 | JASPAR |
| FOXO3 | 0.0000079149 | JASPAR |
| FOXF2 | 0.00005268 | JASPAR |