SOM cluster: 938
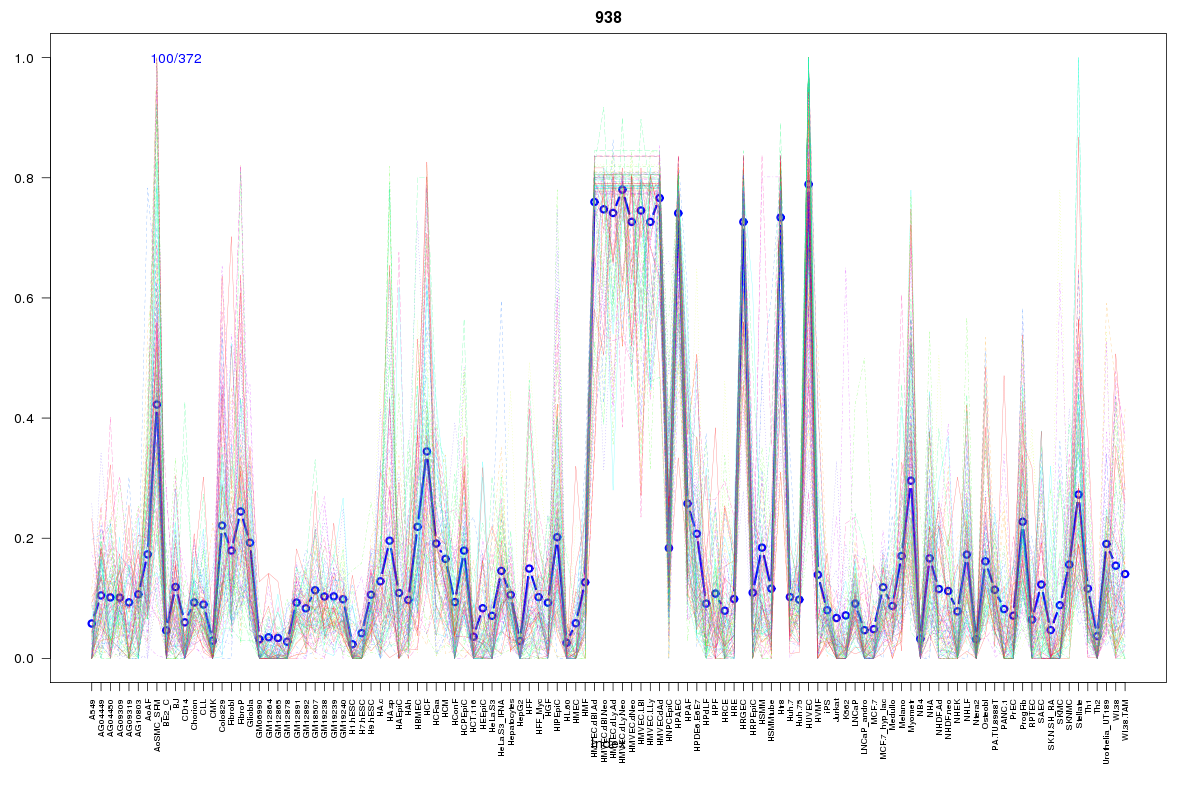
Cluster Hypersensitivity Profile

Genomic Location Trend
These plots show the distribution of the DHS sites surrounding the Transcript Start Site of the nearest gene.
Stats
Number of sites: 372Promoter: 3%
CpG-Island: 0%
Conserved: 52%
Enriched Motifs & Matches
Match Detail: [Jaspar]
|
| ||
|---|---|---|
| Sites: 56/100 | e-val: 7e-19 | ||
| Factor | e-val(match) | DB |
| Foxd3 | 0.00031171 | JASPAR |
| Foxq1 | 0.0019163 | JASPAR |
| SOX9 | 0.0032659 | JASPAR |
| SRY | 0.0044289 | JASPAR |
| Sox5 | 0.0096329 | JASPAR |
|
| ||
| Sites: 47/100 | e-val: 0.000000000000003 | ||
| Factor | e-val(match) | DB |
| FEV | 0.0000000085866 | JASPAR |
| ELF5 | 0.000005086 | JASPAR |
| SPI1 | 0.0000063476 | JASPAR |
| RELA | 0.00012561 | JASPAR |
| NFATC2 | 0.00041348 | JASPAR |
BED file downloads
Top 10 Example Regions
| Location | Gene Link | Dist. |
|---|---|---|
| chr6: 121864980-121865130 | GJA1 | 31.68 |
| chr6: 121864980-121865130 | RNU4-35P | 31.68 |
| chr6: 121864980-121865130 | RP11-129H15.1 | 31.68 |
| chr22: 39827820-39827970 | MIEF1 | 35.56 |
| chr22: 39827820-39827970 | MGAT3 | 35.56 |
| chr22: 39827820-39827970 | RPS19BP1 | 35.56 |
| chr6: 8000745-8000895 | BLOC1S5-TXNDC5 | 39.48 |
| chr6: 8000745-8000895 | TXNDC5 | 39.48 |
| chr8: 90742160-90742310 | RIPK2 | 46.72 |
| chr4: 38052780-38052930 | MRPS33P2 | 46.99 |