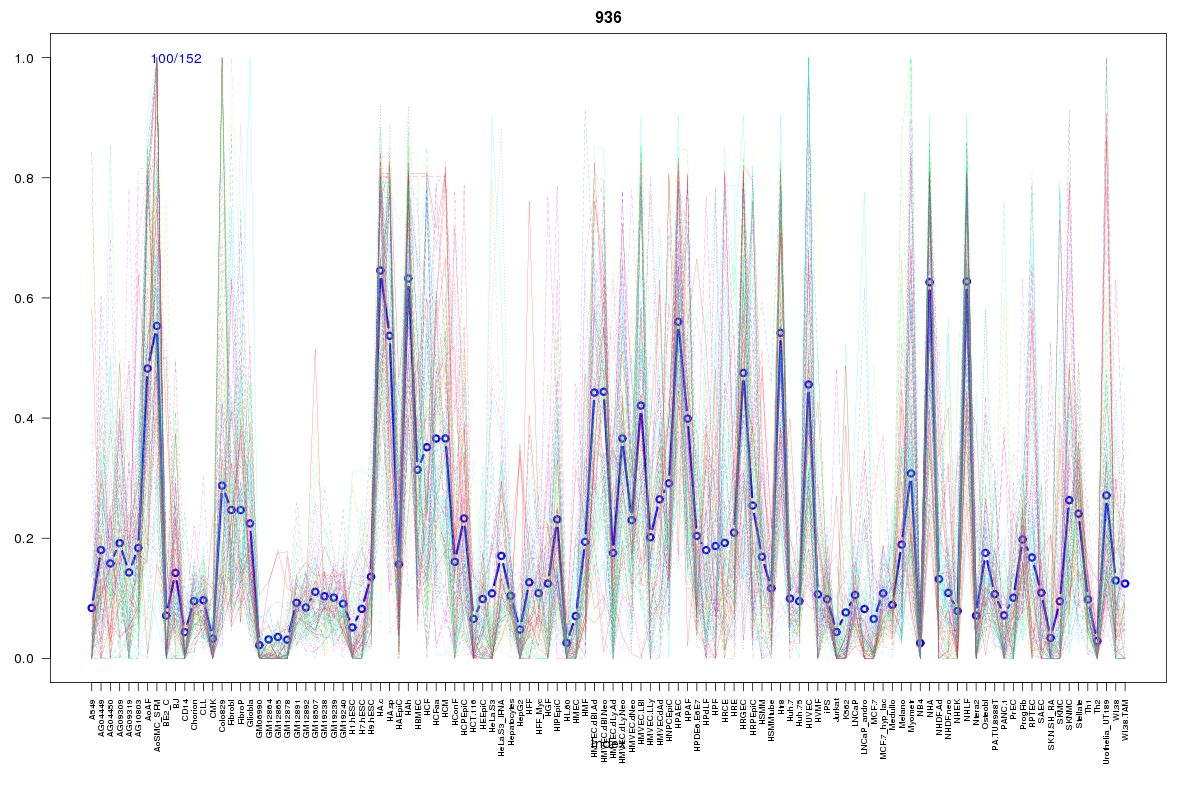
SOM cluster: 936
Cluster Hypersensitivity Profile

Genomic Location Trend
These plots show the distribution of the DHS sites surrounding the Transcript Start Site of the nearest gene.
Stats
Number of sites: 152Promoter: 0%
CpG-Island: 0%
Conserved: 59%
Enriched Motifs & Matches
Match Detail: [Jaspar]
|
| ||
|---|---|---|
| Sites: 25/100 | e-val: 0.92 | ||
| Factor | e-val(match) | DB |
| FEV | 0.00011323 | JASPAR |
| SPI1 | 0.0013603 | JASPAR |
| RELA | 0.0019306 | JASPAR |
| SOX10 | 0.0022021 | JASPAR |
| EWSR1-FLI1 | 0.0024567 | JASPAR |
BED file downloads
Top 10 Example Regions
| Location | Gene Link | Dist. |
|---|---|---|
| chr8: 121255560-121255710 | COL14A1 | 36.97 |
| chr15: 101708800-101708950 | CHSY1 | 37.08 |
| chr15: 101708800-101708950 | RP11-424I19.1 | 37.08 |
| chr3: 149271960-149272110 | WWTR1-IT1 | 40.03 |
| chr3: 149271960-149272110 | WWTR1 | 40.03 |
| chr3: 149271960-149272110 | TM4SF4 | 40.03 |
| chr6: 132275580-132275730 | CTGF | 57.64 |
| chr6: 132275580-132275730 | RP11-69I8.3 | 57.64 |
| chr12: 129286500-129286650 | GLT1D1 | 59.95 |
| chr3: 188494320-188494470 | LPP | 62.83 |