SOM cluster: 920
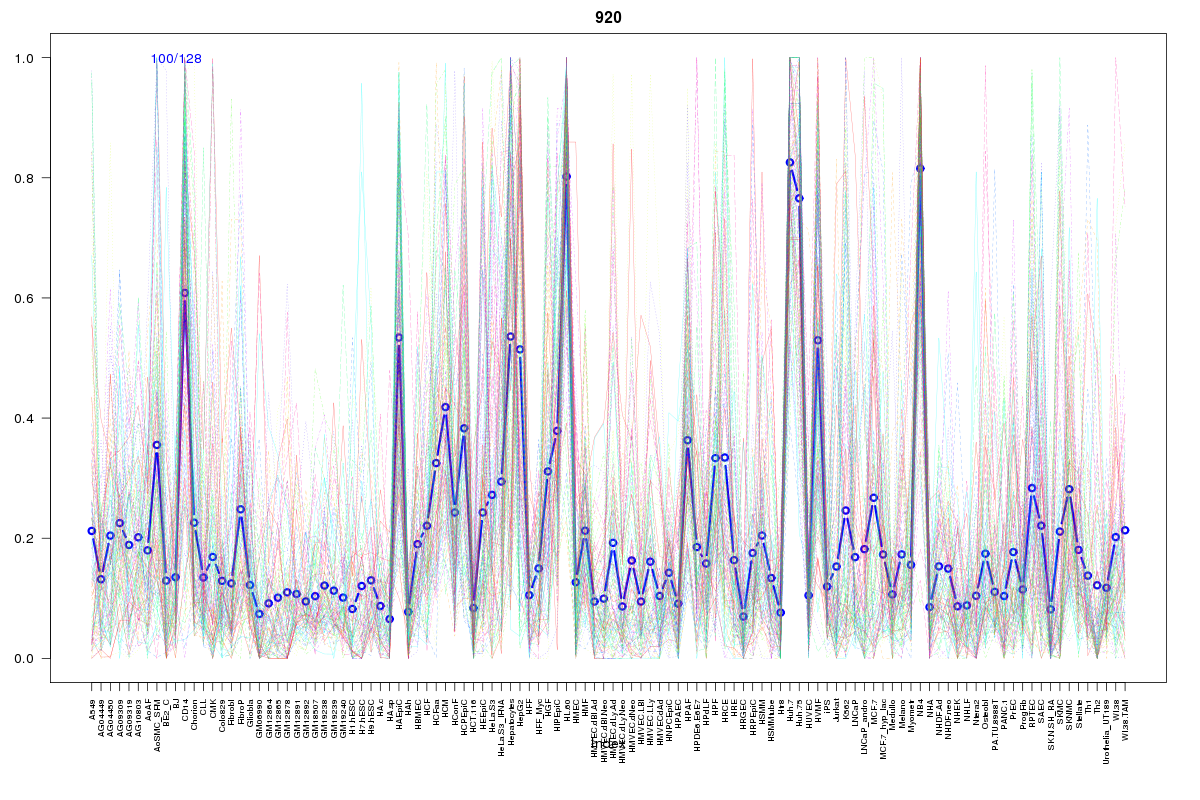
Cluster Hypersensitivity Profile

Genomic Location Trend
These plots show the distribution of the DHS sites surrounding the Transcript Start Site of the nearest gene.
Stats
Number of sites: 128Promoter: 7%
CpG-Island: 2%
Conserved: 38%
Enriched Motifs & Matches
Match Detail: [Jaspar]
|
| ||
|---|---|---|
| Sites: 55/100 | e-val: 3e-22 | ||
| Factor | e-val(match) | DB |
| CEBPA | 0.000000000096053 | JASPAR |
| HLF | 0.0000004251 | JASPAR |
| NFIL3 | 0.000018192 | JASPAR |
| Pou5f1 | 0.000051513 | JASPAR |
| Sox2 | 0.000056704 | JASPAR |
BED file downloads
Top 10 Example Regions
| Location | Gene Link | Dist. |
|---|---|---|
| chr1: 150525145-150525295 | GOLPH3L | 12.93 |
| chr1: 150525145-150525295 | ADAMTSL4 | 12.93 |
| chr22: 50183060-50183210 | RP3-522J7.5 | 56.98 |
| chr16: 57701380-57701530 | GPR97 | 60.85 |
| chr20: 2731640-2731790 | SNORD56 | 69.13 |
| chr1: 90288680-90288830 | LRRC8D | 69.94 |
| chr3: 4910640-4910790 | AC018816.3 | 71.77 |
| chr20: 1869900-1870050 | SIRPA | 73.6 |
| chr18: 11925200-11925350 | IMPA2 | 76.05 |
| chr18: 11925200-11925350 | MPPE1 | 76.05 |