SOM cluster: 92
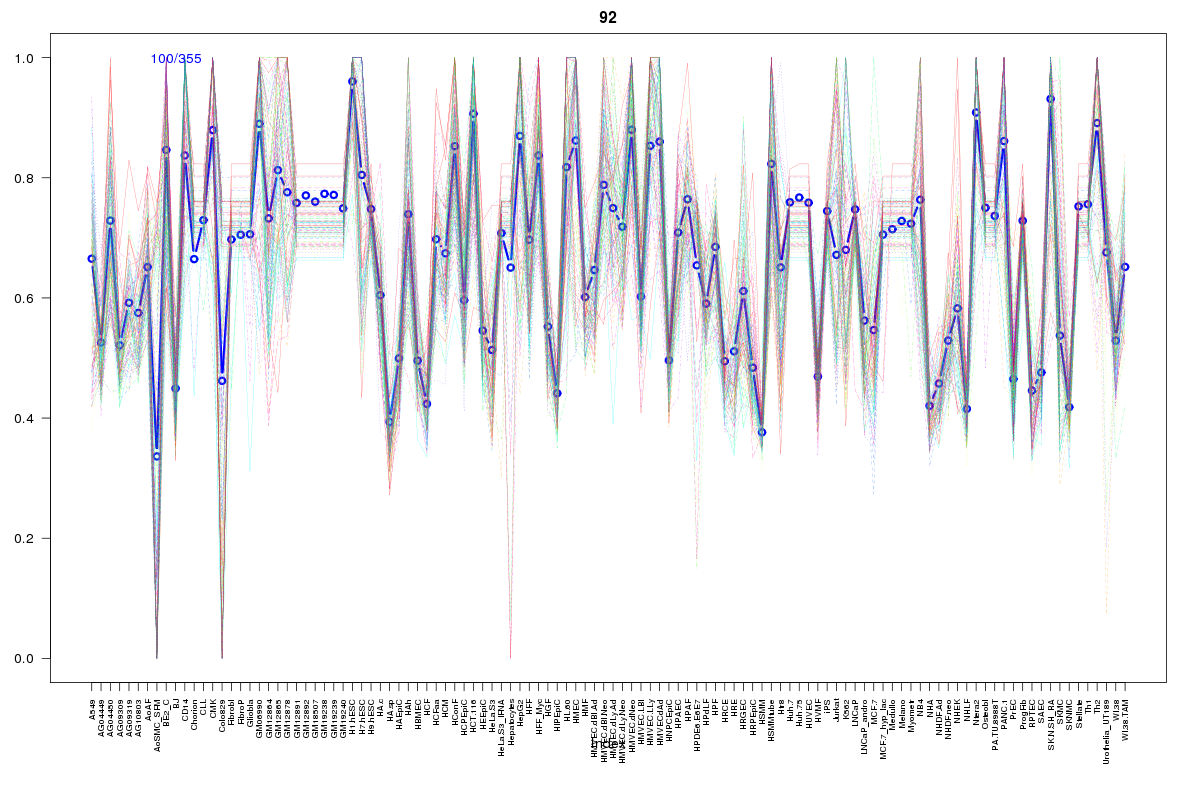
Cluster Hypersensitivity Profile

Genomic Location Trend
These plots show the distribution of the DHS sites surrounding the Transcript Start Site of the nearest gene.
Stats
Number of sites: 355Promoter: 13%
CpG-Island: 31%
Conserved: 82%
Enriched Motifs & Matches
Match Detail: [Jaspar]
|
| ||
|---|---|---|
| Sites: 99/100 | e-val: 0 | ||
| Factor | e-val(match) | DB |
| CTCF | 0 | JASPAR |
| INSM1 | 0.0000012057 | JASPAR |
| SP1 | 0.0018768 | JASPAR |
| Zfp423 | 0.0032805 | JASPAR |
| MYC::MAX | 0.0038491 | JASPAR |
|
| ||
| Sites: 92/100 | e-val: 3.64338e-44 | ||
| Factor | e-val(match) | DB |
| TFAP2A | 0.000019556 | JASPAR |
| PLAG1 | 0.00066876 | JASPAR |
| SP1 | 0.001124 | JASPAR |
| Pax5 | 0.020423 | JASPAR |
| INSM1 | 0.056031 | JASPAR |
|
| ||
| Sites: 83/100 | e-val: 0.00015 | ||
| Factor | e-val(match) | DB |
| NHLH1 | 0.000097769 | JASPAR |
| Klf4 | 0.00015513 | JASPAR |
| SP1 | 0.00040224 | JASPAR |
| Zfx | 0.0016321 | JASPAR |
| Tcfcp2l1 | 0.0054258 | JASPAR |
BED file downloads
Top 10 Example Regions
| Location | Gene Link | Dist. |
|---|---|---|
| chr1: 145589360-145589510 | PIAS3 | 30.79 |
| chr11: 62192320-62192470 | AHNAK | 52.1 |
| chr11: 62192320-62192470 | ASRGL1 | 52.1 |
| chr7: 100887600-100887750 | CLDN15 | 52.56 |
| chr3: 184053620-184053770 | PSMD2 | 52.78 |
| chr12: 110283220-110283370 | GLTP | 53.51 |
| chr4: 3482380-3482530 | DOK7 | 63.18 |
| chr19: 734160-734310 | PTBP1 | 64.31 |
| chr20: 61531660-61531810 | ARF4P2 | 64.87 |
| chr8: 6658360-6658510 | AGPAT5 | 65.81 |