SOM cluster: 918
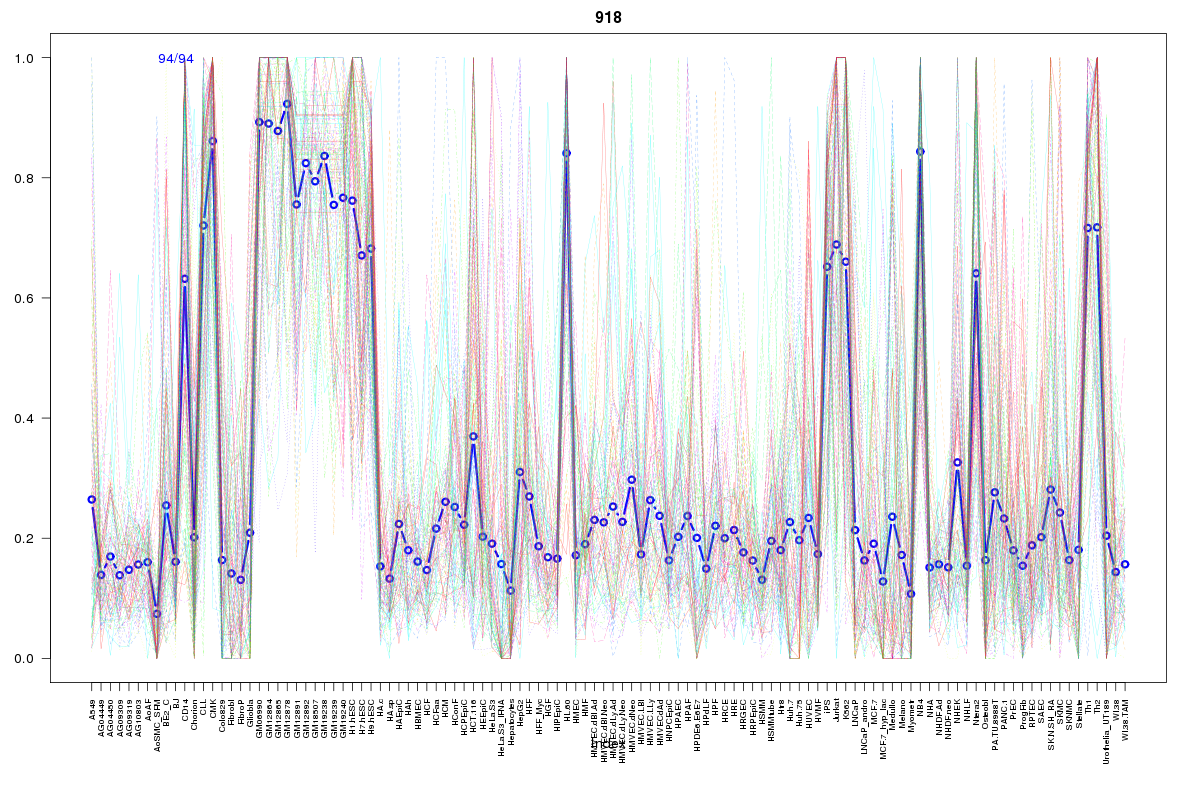
Cluster Hypersensitivity Profile

Genomic Location Trend
These plots show the distribution of the DHS sites surrounding the Transcript Start Site of the nearest gene.
Stats
Number of sites: 94Promoter: 32%
CpG-Island: 27%
Conserved: 55%
Enriched Motifs & Matches
Match Detail: [Jaspar]
|
| ||
|---|---|---|
| Sites: 88/94 | e-val: 0 | ||
| Factor | e-val(match) | DB |
| SP1 | 0.0000000000086168 | JASPAR |
| Egr1 | 0.000011889 | JASPAR |
| Klf4 | 0.000060397 | JASPAR |
| RREB1 | 0.000097251 | JASPAR |
| INSM1 | 0.00029059 | JASPAR |
|
| ||
| Sites: 57/94 | e-val: 3e-20 | ||
| Factor | e-val(match) | DB |
| SP1 | 0.000000000042955 | JASPAR |
| TFAP2A | 0.0002156 | JASPAR |
| Egr1 | 0.0020956 | JASPAR |
| Pax4 | 0.0025986 | JASPAR |
| Klf4 | 0.0034792 | JASPAR |
|
| ||
| Sites: 30/94 | e-val: 0.00000013 | ||
| Factor | e-val(match) | DB |
| SPIB | 0.0000000048872 | JASPAR |
| SPI1 | 0.0000031494 | JASPAR |
| FEV | 0.00017952 | JASPAR |
| ELK4 | 0.00046758 | JASPAR |
| Stat3 | 0.00062047 | JASPAR |
BED file downloads
Top 10 Example Regions
| Location | Gene Link | Dist. |
|---|---|---|
| chr10: 11208160-11208310 | RP3-323N1.2 | 41.32 |
| chr3: 152552540-152552690 | RP11-38P22.2 | 53.97 |
| chr3: 152552540-152552690 | P2RY1 | 53.97 |
| chrX: 12969100-12969250 | TLR7 | 57.37 |
| chrX: 12969100-12969250 | TMSB4X | 57.37 |
| chr2: 8723800-8723950 | AC011747.4 | 59.08 |
| chr3: 38080620-38080770 | VILL | 63.21 |
| chr3: 38080620-38080770 | CTDSPL | 63.21 |
| chr19: 48922560-48922710 | GRIN2D | 64.11 |
| chr12: 108297540-108297690 | RP11-554D14.1 | 65.09 |