SOM cluster: 909
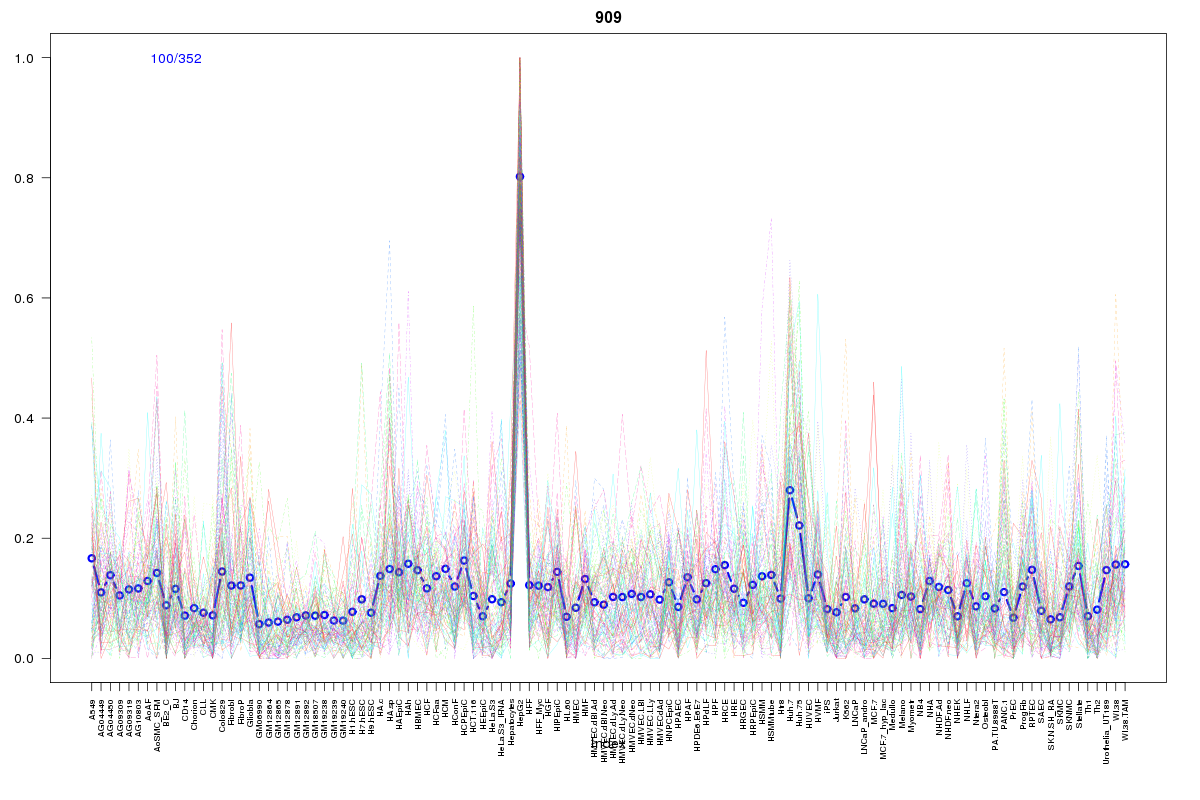
Cluster Hypersensitivity Profile

Genomic Location Trend
These plots show the distribution of the DHS sites surrounding the Transcript Start Site of the nearest gene.
Stats
Number of sites: 352Promoter: 7%
CpG-Island: 4%
Conserved: 39%
Enriched Motifs & Matches
Match Detail: [Jaspar]
|
| ||
|---|---|---|
| Sites: 33/100 | e-val: 0.000000000000026 | ||
| Factor | e-val(match) | DB |
| NR2F1 | 0.000000000000033418 | JASPAR |
| NR1H2::RXRA | 0.000000000014492 | JASPAR |
| HNF4A | 0.0000000017667 | JASPAR |
| PPARG::RXRA | 0.00000027171 | JASPAR |
| SOX10 | 0.012673 | JASPAR |
|
| ||
| Sites: 23/100 | e-val: 2.3 | ||
| Factor | e-val(match) | DB |
| Foxd3 | 0.0019527 | JASPAR |
| FOXO3 | 0.0033829 | JASPAR |
| FOXF2 | 0.0037868 | JASPAR |
| NR1H2::RXRA | 0.0054585 | JASPAR |
| NFATC2 | 0.0069204 | JASPAR |
BED file downloads
Top 10 Example Regions
| Location | Gene Link | Dist. |
|---|---|---|
| chr1: 146640280-146640430 | PRKAB2 | 25.43 |
| chr17: 1970040-1970190 | AC099684.1 | 35.61 |
| chr9: 104207820-104207970 | TRMT112P4 | 40.41 |
| chr1: 15516200-15516350 | TMEM51 | 51.4 |
| chr2: 133197480-133197630 | GPR39 | 53.99 |
| chr17: 63512300-63512450 | AXIN2 | 61.47 |
| chr12: 122296725-122296875 | HPD | 66.86 |
| chr12: 122296725-122296875 | RP11-7M8.2 | 66.86 |
| chr22: 41953760-41953910 | CSDC2 | 68.28 |
| chr22: 41953760-41953910 | XRCC6 | 68.28 |