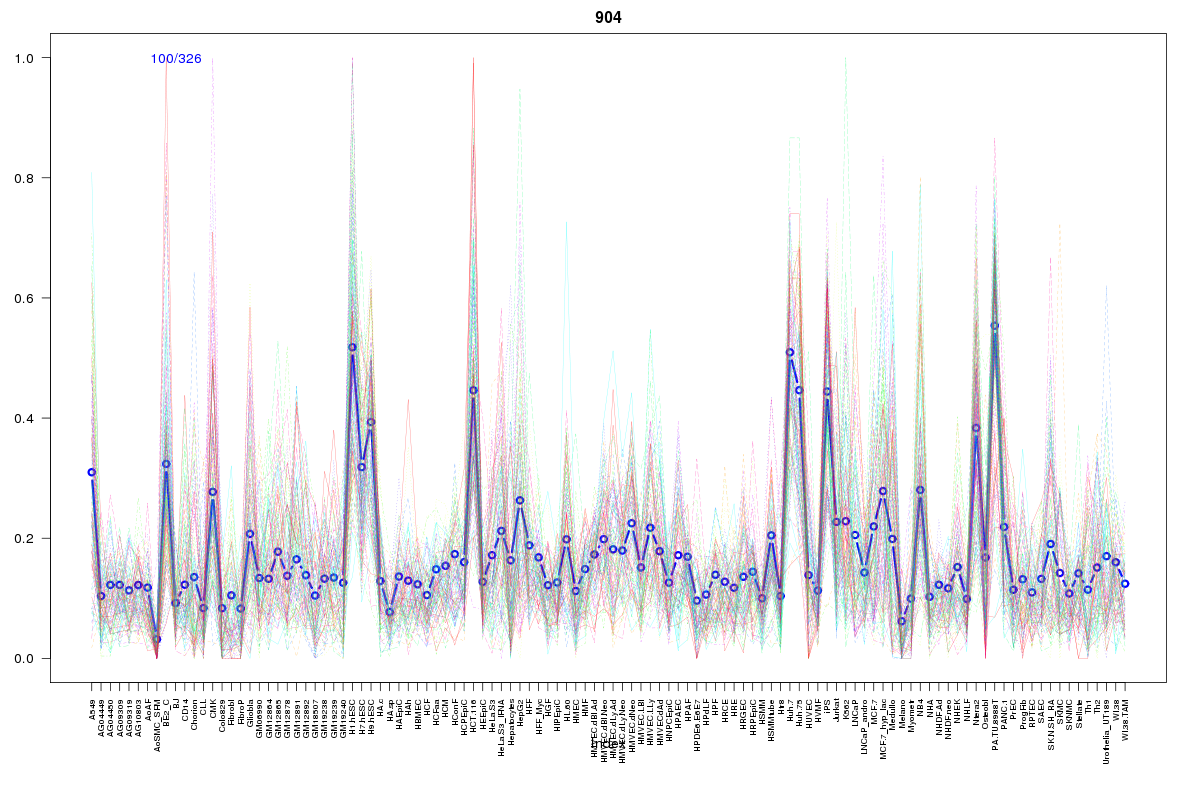
SOM cluster: 904
Cluster Hypersensitivity Profile

Genomic Location Trend
These plots show the distribution of the DHS sites surrounding the Transcript Start Site of the nearest gene.
Stats
Number of sites: 326Promoter: 5%
CpG-Island: 3%
Conserved: 29%
Enriched Motifs & Matches
Match Detail: [Jaspar]
|
| ||
|---|---|---|
| Sites: 74/100 | e-val: 1.26117e-44 | ||
| Factor | e-val(match) | DB |
| CTCF | 0 | JASPAR |
| INSM1 | 0.00000021443 | JASPAR |
| SP1 | 0.000067283 | JASPAR |
| MYC::MAX | 0.0030315 | JASPAR |
| Myf | 0.010202 | JASPAR |
BED file downloads
Top 10 Example Regions
| Location | Gene Link | Dist. |
|---|---|---|
| chr12: 120673480-120673630 | PLA2G1B | 39.77 |
| chr19: 33889120-33889270 | RPS3AP50 | 41.11 |
| chr19: 33889120-33889270 | PEPD | 41.11 |
| chr9: 133319905-133320055 | snoU13 | 42.44 |
| chr11: 70350085-70350235 | SHANK2 | 44.66 |
| chr11: 70350085-70350235 | AP001271.3 | 44.66 |
| chr5: 170792460-170792610 | RP11-117L6.1 | 57.55 |
| chr12: 121066845-121066995 | MLEC | 59.49 |
| chr12: 121066845-121066995 | RP11-173P15.3 | 59.49 |
| chr2: 150185705-150185855 | LYPD6 | 60.3 |