SOM cluster: 902
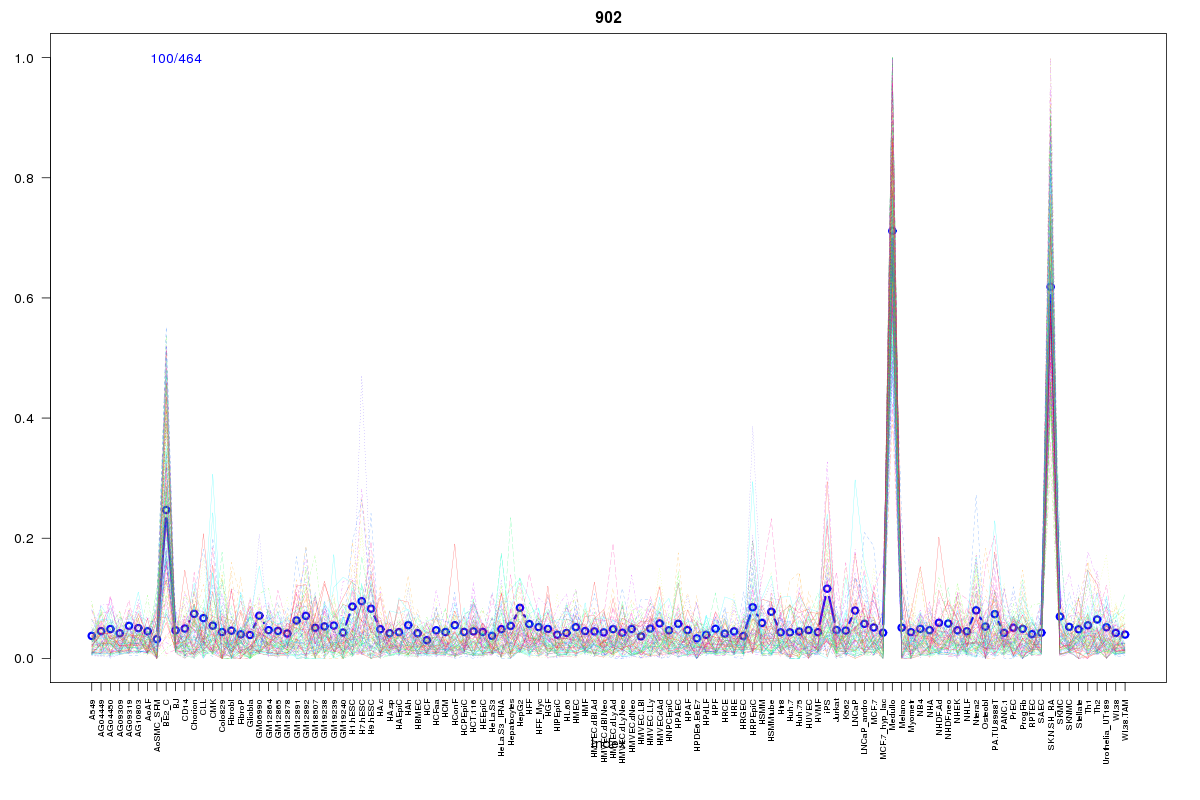
Cluster Hypersensitivity Profile

Genomic Location Trend
These plots show the distribution of the DHS sites surrounding the Transcript Start Site of the nearest gene.
Stats
Number of sites: 464Promoter: 2%
CpG-Island: 9%
Conserved: 62%
Enriched Motifs & Matches
Match Detail: [Jaspar]
|
| ||
|---|---|---|
| Sites: 27/100 | e-val: 1.5e-17 | ||
| Factor | e-val(match) | DB |
| SP1 | 0.000000015328 | JASPAR |
| PPARG::RXRA | 0.0012684 | JASPAR |
| Pax4 | 0.0037758 | JASPAR |
| RREB1 | 0.0043681 | JASPAR |
| Egr1 | 0.0050183 | JASPAR |
|
| ||
| Sites: 47/100 | e-val: 0.00000000000023 | ||
| Factor | e-val(match) | DB |
| TAL1::TCF3 | 0.000000011512 | JASPAR |
| Myf | 0.000011602 | JASPAR |
| CTCF | 0.0004682 | JASPAR |
| Myb | 0.00047949 | JASPAR |
| MYC::MAX | 0.00051571 | JASPAR |
|
| ||
| Sites: 29/100 | e-val: 0.0013 | ||
| Factor | e-val(match) | DB |
| Prrx2 | 0.00039688 | JASPAR |
| Pdx1 | 0.00050085 | JASPAR |
| Nobox | 0.00051366 | JASPAR |
| Nkx2-5 | 0.0052396 | JASPAR |
| Lhx3 | 0.0054932 | JASPAR |
BED file downloads
Top 10 Example Regions
| Location | Gene Link | Dist. |
|---|---|---|
| chr8: 42133000-42133150 | IKBKB | 50.39 |
| chr1: 204326925-204327075 | PLEKHA6 | 50.82 |
| chr11: 61294600-61294750 | RN7SL23P | 51.15 |
| chr18: 55019660-55019810 | ST8SIA3 | 51.92 |
| chr12: 109240045-109240195 | SVOP | 53.76 |
| chr8: 73163780-73163930 | RP11-656G20.1 | 54.54 |
| chr1: 110792760-110792910 | SLC6A17 | 56.31 |
| chr1: 180897440-180897590 | RP11-46A10.6 | 57.64 |
| chr3: 170303285-170303435 | SLC7A14 | 67.84 |
| chr8: 145926305-145926455 | ZNF34 | 70.73 |