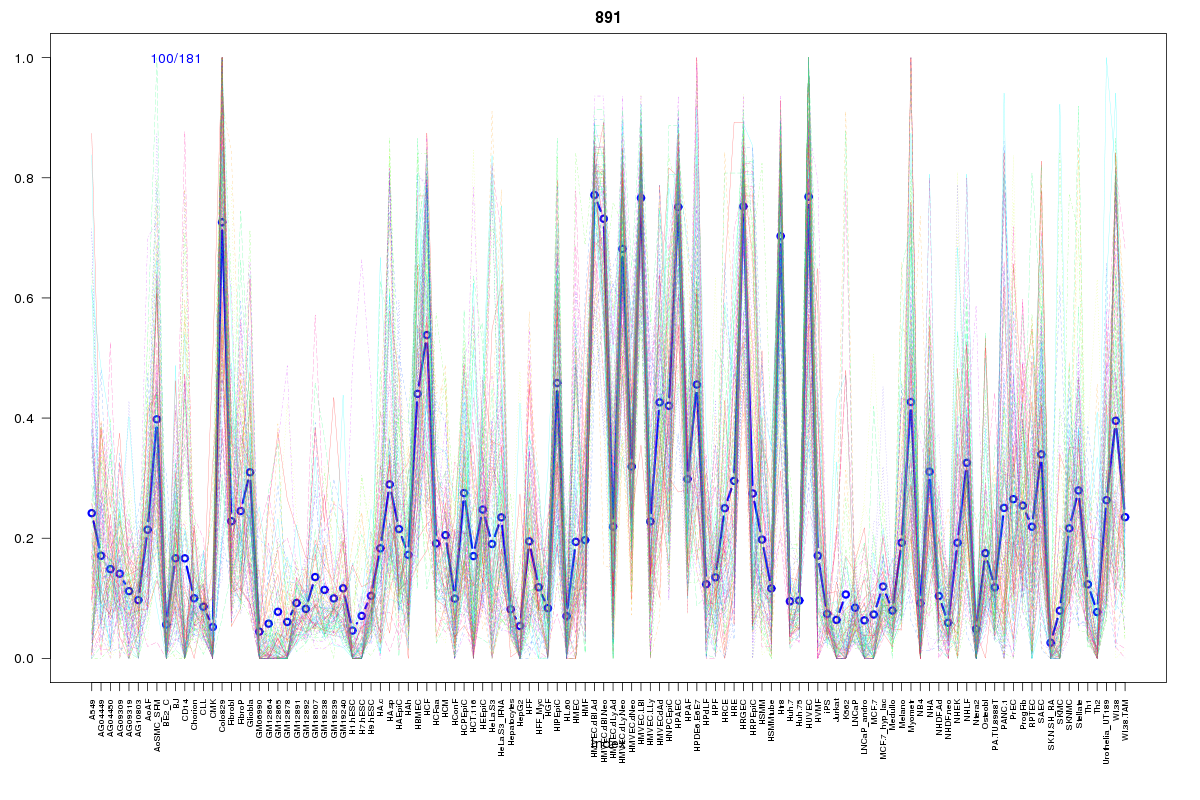
SOM cluster: 891
Cluster Hypersensitivity Profile

Genomic Location Trend
These plots show the distribution of the DHS sites surrounding the Transcript Start Site of the nearest gene.
Stats
Number of sites: 181Promoter: 1%
CpG-Island: 0%
Conserved: 47%
Enriched Motifs & Matches
Match Detail: [Jaspar]
|
| ||
|---|---|---|
| Sites: 55/100 | e-val: 9.5e-36 | ||
| Factor | e-val(match) | DB |
| AP1 | 0.000000026681 | JASPAR |
| NFE2L2 | 0.00000015572 | JASPAR |
| NFE2L1::MafG | 0.00088798 | JASPAR |
| Pax2 | 0.017732 | JASPAR |
| Pdx1 | 0.040975 | JASPAR |
|
| ||
| Sites: 40/100 | e-val: 0.00000041 | ||
| Factor | e-val(match) | DB |
| Foxd3 | 0.000000018348 | JASPAR |
| Foxq1 | 0.000000057852 | JASPAR |
| SOX10 | 0.000027557 | JASPAR |
| FOXI1 | 0.000058917 | JASPAR |
| SRY | 0.000095301 | JASPAR |
|
| ||
| Sites: 25/100 | e-val: 0.000065 | ||
| Factor | e-val(match) | DB |
| FEV | 0.000000015335 | JASPAR |
| SPI1 | 0.000004519 | JASPAR |
| ELF5 | 0.00001579 | JASPAR |
| EWSR1-FLI1 | 0.0003002 | JASPAR |
| IRF1 | 0.00068419 | JASPAR |
BED file downloads
Top 10 Example Regions
| Location | Gene Link | Dist. |
|---|---|---|
| chr3: 171430120-171430270 | PP13439 | 44.71 |
| chr3: 171430120-171430270 | PLD1 | 44.71 |
| chr3: 141129820-141129970 | RASA2 | 48.19 |
| chr6: 56732040-56732190 | DST | 50.08 |
| chr21: 17223100-17223250 | USP25 | 50.51 |
| chr1: 173012500-173012650 | TNFSF18 | 51.47 |
| chr1: 168196880-168197030 | ANKRD36BP1 | 51.97 |
| chrX: 14917900-14918050 | MOSPD2 | 53.97 |
| chrX: 14917900-14918050 | FANCB | 53.97 |
| chr4: 89455620-89455770 | RP11-466G12.2 | 61.73 |